Statistiques de base
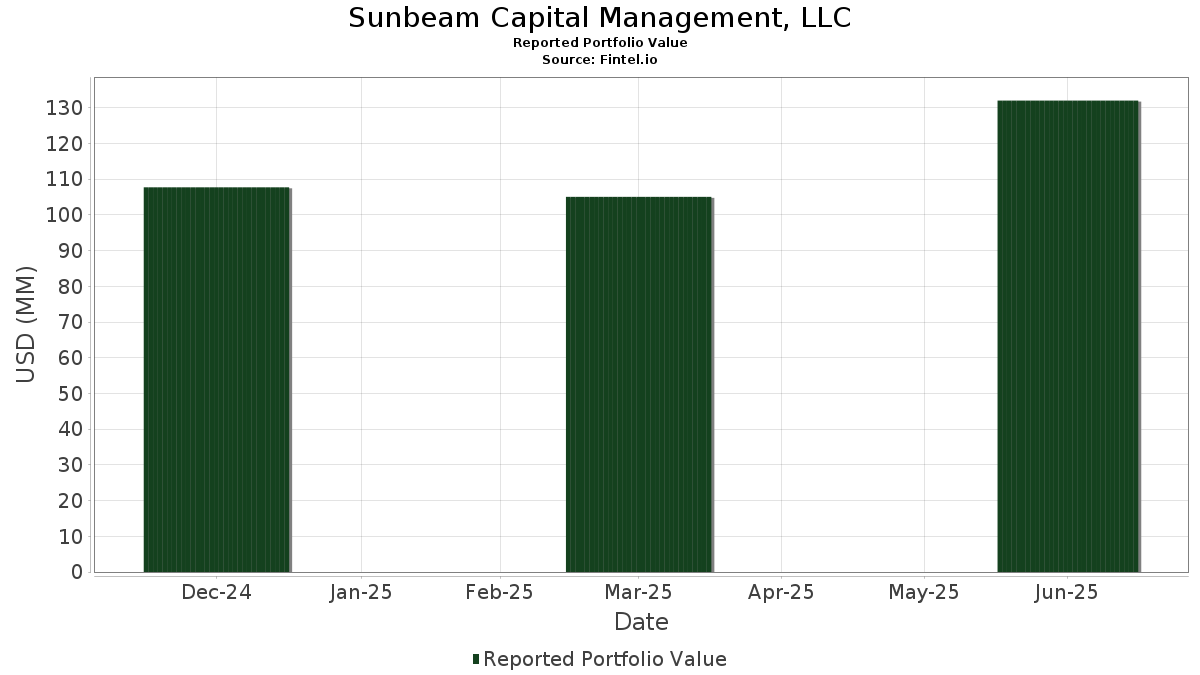
| Valeur du portefeuille | $ 132 009 364 |
| Positions actuelles | 92 |
Dernières positions, performances, ASG (à partir des dépôts 13F, 13D)
Sunbeam Capital Management, LLC a déclaré un total de 92 positions dans ses derniers dépôts auprès de la SEC. La valeur la plus récente du portefeuille est calculée à 132 009 364 USD. Les actifs sous gestion réels (ASG) sont cette valeur plus les liquidités (qui ne sont pas divulguées). Les principales positions de Sunbeam Capital Management, LLC sont iShares Trust - iShares Core S&P 500 ETF (US:IVV) , Vanguard Index Funds - Vanguard S&P 500 ETF (US:VOO) , ETF Series Solutions - Distillate U.S. Fundamental Stability & Value ETF (US:DSTL) , Strats Trust For Procter & Gambel Security - Preferred Security (US:GJR) , and NVIDIA Corporation (US:NVDA) . Les nouvelles positions de Sunbeam Capital Management, LLC incluent Global X Funds - Global X MLP & Energy Infrastructure ETF (US:MLPX) , Sprott Funds Trust - Sprott Uranium Miners ETF (US:URNM) , Caterpillar Inc. (US:CAT) , GE Vernova Inc. (US:GEV) , and CrowdStrike Holdings, Inc. (US:CRWD) .
Meilleures augmentations ce trimestre
Nous utilisons la variation de l'allocation du portefeuille car il s'agit de l'indicateur le plus significatif. Les changements peuvent être dus à des transactions ou à des variations de prix des actions.
| Titre | Actions (en millions) |
Valeur ($ en millions) |
% du portefeuille | ΔPortefeuille % |
|---|---|---|---|---|
| 0,03 | 2,75 | 2,0866 | 1,5690 | |
| 0,04 | 6,91 | 5,2363 | 1,3940 | |
| 0,01 | 5,55 | 4,2024 | 0,8844 | |
| 0,01 | 0,72 | 0,5457 | 0,5457 | |
| 0,01 | 0,68 | 0,5134 | 0,5134 | |
| 0,02 | 1,27 | 0,9601 | 0,4276 | |
| 0,05 | 1,42 | 1,0751 | 0,4197 | |
| 0,01 | 2,21 | 1,6710 | 0,3981 | |
| 0,00 | 1,00 | 0,7557 | 0,3430 | |
| 0,00 | 0,44 | 0,3370 | 0,3370 |
Principales baisses ce trimestre
Nous utilisons la variation de l'allocation du portefeuille car il s'agit de l'indicateur le plus significatif. Les changements peuvent être dus à des transactions ou à des variations de prix des actions.
| Titre | Actions (en millions) |
Valeur ($ en millions) |
% du portefeuille | ΔPortefeuille % |
|---|---|---|---|---|
| 0,05 | 7,34 | 5,5595 | -1,7228 | |
| 0,03 | 19,25 | 14,5828 | -1,4578 | |
| 0,14 | 2,66 | 2,0142 | -0,4988 | |
| 0,03 | 5,21 | 3,9451 | -0,4113 | |
| 0,01 | 1,05 | 0,7972 | -0,3676 | |
| 0,09 | 1,96 | 1,4827 | -0,3646 | |
| 0,02 | 2,36 | 1,7873 | -0,3533 | |
| 0,16 | 8,62 | 6,5292 | -0,3127 | |
| 0,00 | 0,86 | 0,6517 | -0,2958 | |
| 0,00 | 1,31 | 0,9956 | -0,2598 |
Déclarations 13F et dépôts de fonds
Ce formulaire a été déposé le 2025-07-23 pour la période de déclaration 2025-06-30. Cliquez sur l'icône du lien pour voir l'historique complet des transactions.
Mettre à niveau pour débloquer les données premium et exporter vers Excel ![]() .
.
| Titre | Type | Prix moyen de l'action | Actions (en millions) |
ΔActions (%) |
ΔActions (%) |
Valeur ($ en millions) |
Portefeuille (%) |
ΔPortefeuille (%) |
|
|---|---|---|---|---|---|---|---|---|---|
| IVV / iShares Trust - iShares Core S&P 500 ETF | 0,03 | 3,38 | 19,25 | 14,24 | 14,5828 | -1,4578 | |||
| VOO / Vanguard Index Funds - Vanguard S&P 500 ETF | 0,02 | 14,01 | 11,52 | 26,40 | 8,7296 | 0,0509 | |||
| DSTL / ETF Series Solutions - Distillate U.S. Fundamental Stability & Value ETF | 0,16 | 17,51 | 8,62 | 19,92 | 6,5292 | -0,3127 | |||
| GJR / Strats Trust For Procter & Gambel Security - Preferred Security | 0,05 | 2,62 | 7,34 | -4,07 | 5,5595 | -1,7228 | |||
| NVDA / NVIDIA Corporation | 0,04 | 17,48 | 6,91 | 71,26 | 5,2363 | 1,3940 | |||
| MSFT / Microsoft Corporation | 0,01 | 20,12 | 5,55 | 59,17 | 4,2024 | 0,8844 | |||
| AAPL / Apple Inc. | 0,03 | 23,21 | 5,21 | 13,79 | 3,9451 | -0,4113 | |||
| IEFA / iShares Trust - iShares Core MSCI EAFE ETF | 0,03 | 359,04 | 2,75 | 407,18 | 2,0866 | 1,5690 | |||
| BSCQ / Invesco Exchange-Traded Self-Indexed Fund Trust - Invesco BulletShares 2026 Corporate Bond ETF | 0,14 | 0,52 | 2,66 | 0,72 | 2,0142 | -0,4988 | |||
| GOOGL / Alphabet Inc. | 0,02 | 4,26 | 2,65 | 18,83 | 2,0075 | -0,1157 | |||
| WMT / Walmart Inc. | 0,03 | 10,22 | 2,61 | 22,47 | 1,9735 | -0,0521 | |||
| JPM / JPMorgan Chase & Co. | 0,01 | 4,75 | 2,51 | 23,80 | 1,8998 | -0,0286 | |||
| META / Meta Platforms, Inc. | 0,00 | 3,24 | 2,38 | 32,22 | 1,8006 | 0,0893 | |||
| XOM / Exxon Mobil Corporation | 0,02 | 15,76 | 2,36 | 4,94 | 1,7873 | -0,3533 | |||
| AVGO / Broadcom Inc. | 0,01 | 0,20 | 2,21 | 64,92 | 1,6710 | 0,3981 | |||
| AMZN / Amazon.com, Inc. | 0,01 | 36,74 | 2,13 | 57,76 | 1,6099 | 0,3268 | |||
| IBTG / iShares Trust - iShares iBonds Dec 2026 Term Treasury ETF | 0,09 | 0,90 | 1,96 | 0,88 | 1,4827 | -0,3646 | |||
| LLY / Eli Lilly and Company | 0,00 | 27,56 | 1,81 | 20,37 | 1,3744 | -0,0607 | |||
| HYG / iShares Trust - iShares iBoxx $ High Yield Corporate Bond ETF | 0,02 | 4,31 | 1,62 | 6,65 | 1,2274 | -0,2190 | |||
| GOOG / Alphabet Inc. | 0,01 | 10,63 | 1,48 | 25,70 | 1,1227 | -0,0004 | |||
| CEF / Sprott Physical Gold and Silver Trust | 0,05 | 94,56 | 1,42 | 106,25 | 1,0751 | 0,4197 | |||
| MDY / SPDR S&P MidCap 400 ETF Trust | 0,00 | -6,15 | 1,31 | -0,30 | 0,9956 | -0,2598 | |||
| COST / Costco Wholesale Corporation | 0,00 | 23,76 | 1,31 | 29,57 | 0,9925 | 0,0299 | |||
| UTES / ETFis Series Trust I - Virtus Reaves Utilities ETF | 0,02 | 93,61 | 1,27 | 126,65 | 0,9601 | 0,4276 | |||
| MA / Mastercard Incorporated | 0,00 | 2,88 | 1,23 | 5,51 | 0,9285 | -0,1776 | |||
| IWR / iShares Trust - iShares Russell Mid-Cap ETF | 0,01 | 0,29 | 1,18 | 8,36 | 0,8937 | -0,1421 | |||
| PNFP / Pinnacle Financial Partners, Inc. | 0,01 | 0,23 | 1,10 | 4,38 | 0,8305 | -0,1696 | |||
| SUB / iShares Trust - iShares Short-Term National Muni Bond ETF | 0,01 | 0,01 | 1,09 | 0,74 | 0,8220 | -0,2036 | |||
| VB / Vanguard Index Funds - Vanguard Small-Cap ETF | 0,00 | 0,00 | 1,06 | 7,27 | 0,8055 | -0,1385 | |||
| XLE / The Select Sector SPDR Trust - The Energy Select Sector SPDR Fund | 0,01 | -5,23 | 1,05 | -13,98 | 0,7972 | -0,3676 | |||
| KO / The Coca-Cola Company | 0,01 | 7,46 | 1,05 | 6,18 | 0,7942 | -0,1459 | |||
| NFLX / Netflix, Inc. | 0,00 | 60,22 | 1,00 | 130,25 | 0,7557 | 0,3430 | |||
| ORCL / Oracle Corporation | 0,00 | 0,44 | 0,89 | 57,14 | 0,6751 | 0,1350 | |||
| BRK.A / Berkshire Hathaway Inc. | 0,00 | -5,24 | 0,86 | -13,57 | 0,6517 | -0,2958 | |||
| ETN / Eaton Corporation plc | 0,00 | 0,63 | 0,85 | 31,84 | 0,6462 | 0,0296 | |||
| ABBV / AbbVie Inc. | 0,00 | 6,21 | 0,79 | -5,97 | 0,5968 | -0,2001 | |||
| DCRE / Doubleline ETF Trust - DoubleLine Commercial Real Estate ETF | 0,01 | 0,00 | 0,77 | 0,26 | 0,5830 | -0,1473 | |||
| HD / The Home Depot, Inc. | 0,00 | 46,24 | 0,76 | 46,35 | 0,5772 | 0,0813 | |||
| IBM / International Business Machines Corporation | 0,00 | 146,41 | 0,74 | 192,86 | 0,5595 | 0,3187 | |||
| MLPX / Global X Funds - Global X MLP & Energy Infrastructure ETF | 0,01 | 0,72 | 0,5457 | 0,5457 | |||||
| URNM / Sprott Funds Trust - Sprott Uranium Miners ETF | 0,01 | 0,68 | 0,5134 | 0,5134 | |||||
| GE / General Electric Company | 0,00 | 0,04 | 0,63 | 28,60 | 0,4740 | 0,0111 | |||
| V / Visa Inc. | 0,00 | 10,10 | 0,61 | 11,58 | 0,4601 | -0,0582 | |||
| SPY / SPDR S&P 500 ETF | 0,00 | 3,39 | 0,56 | 14,17 | 0,4276 | -0,0431 | |||
| MRK / Merck & Co., Inc. | 0,01 | 12,29 | 0,56 | -0,89 | 0,4217 | -0,1128 | |||
| IGF / iShares Trust - iShares Global Infrastructure ETF | 0,01 | 0,00 | 0,55 | 8,20 | 0,4201 | -0,0674 | |||
| DE / Deere & Company | 0,00 | 0,29 | 0,52 | 8,73 | 0,3965 | -0,0619 | |||
| FTXP / Foothills Exploration, Inc. | 0,00 | 0,18 | 0,51 | 32,12 | 0,3867 | 0,0188 | |||
| IWO / iShares Trust - iShares Russell 2000 Growth ETF | 0,00 | -3,86 | 0,50 | 7,56 | 0,3774 | -0,0636 | |||
| TT / Trane Technologies plc | 0,00 | 0,28 | 0,47 | 30,28 | 0,3555 | 0,0121 | |||
| RTX / RTX Corporation | 0,00 | 19,98 | 0,45 | 32,15 | 0,3401 | 0,0169 | |||
| CAT / Caterpillar Inc. | 0,00 | 0,44 | 0,3370 | 0,3370 | |||||
| CVX / Chevron Corporation | 0,00 | 0,83 | 0,43 | -13,72 | 0,3290 | -0,1500 | |||
| TMUS / T-Mobile US, Inc. | 0,00 | 0,34 | 0,42 | -10,52 | 0,3166 | -0,1271 | |||
| UNP / Union Pacific Corporation | 0,00 | 0,06 | 0,42 | -2,57 | 0,3163 | -0,0917 | |||
| VEA / Vanguard Tax-Managed Funds - Vanguard FTSE Developed Markets ETF | 0,01 | -7,72 | 0,42 | 3,48 | 0,3153 | -0,0675 | |||
| GLD / SPDR Gold Trust | 0,00 | 0,00 | 0,39 | 5,66 | 0,2977 | -0,0559 | |||
| MMM / 3M Company | 0,00 | 26,33 | 0,37 | 30,96 | 0,2789 | 0,0114 | |||
| MU / Micron Technology, Inc. | 0,00 | 0,14 | 0,37 | 42,02 | 0,2767 | 0,0316 | |||
| TXN / Texas Instruments Incorporated | 0,00 | 0,41 | 0,36 | 16,01 | 0,2693 | -0,0225 | |||
| PM / Philip Morris International Inc. | 0,00 | 2,98 | 0,34 | 17,89 | 0,2548 | -0,0166 | |||
| BSX / Boston Scientific Corporation | 0,00 | 0,00 | 0,33 | 6,43 | 0,2514 | -0,0453 | |||
| MCD / McDonald's Corporation | 0,00 | 3,25 | 0,32 | -3,57 | 0,2462 | -0,0741 | |||
| GEV / GE Vernova Inc. | 0,00 | 0,32 | 0,2422 | 0,2422 | |||||
| ITW / Illinois Tool Works Inc. | 0,00 | 0,64 | 0,31 | 0,32 | 0,2365 | -0,0597 | |||
| SPGI / S&P Global Inc. | 0,00 | 0,17 | 0,31 | 4,01 | 0,2359 | -0,0493 | |||
| ET / Energy Transfer LP - Limited Partnership | 0,02 | -10,29 | 0,31 | -12,29 | 0,2326 | -0,1015 | |||
| BAC / Bank of America Corporation | 0,01 | 7,27 | 0,31 | 21,91 | 0,2321 | -0,0077 | |||
| APH / Amphenol Corporation | 0,00 | 0,26 | 0,30 | 50,75 | 0,2303 | 0,0384 | |||
| SYK / Stryker Corporation | 0,00 | 0,26 | 0,30 | 6,74 | 0,2282 | -0,0410 | |||
| EPD / Enterprise Products Partners L.P. - Limited Partnership | 0,01 | 0,21 | 0,28 | -9,00 | 0,2148 | -0,0817 | |||
| AMP / Ameriprise Financial, Inc. | 0,00 | 0,20 | 0,27 | 10,37 | 0,2021 | -0,0279 | |||
| LOW / Lowe's Companies, Inc. | 0,00 | 0,00 | 0,27 | -5,02 | 0,2014 | -0,0646 | |||
| ABT / Abbott Laboratories | 0,00 | 13,28 | 0,26 | 16,37 | 0,1995 | -0,0164 | |||
| XOP / SPDR Series Trust - SPDR S&P Oil & Gas Exploration & Production ETF | 0,00 | 0,05 | 0,26 | -4,49 | 0,1934 | -0,0609 | |||
| LVS / Las Vegas Sands Corp. | 0,01 | 0,59 | 0,25 | 12,95 | 0,1924 | -0,0210 | |||
| MLM / Martin Marietta Materials, Inc. | 0,00 | 0,22 | 0,25 | 14,68 | 0,1899 | -0,0177 | |||
| PEP / PepsiCo, Inc. | 0,00 | 0,25 | 0,1891 | 0,1891 | |||||
| QCOM / QUALCOMM Incorporated | 0,00 | 0,32 | 0,25 | 4,22 | 0,1872 | -0,0390 | |||
| CRWD / CrowdStrike Holdings, Inc. | 0,00 | 0,25 | 0,1863 | 0,1863 | |||||
| GDX / VanEck ETF Trust - VanEck Gold Miners ETF | 0,00 | 0,00 | 0,25 | 13,43 | 0,1857 | -0,0204 | |||
| JNJ / Johnson & Johnson | 0,00 | 0,24 | 0,1821 | 0,1821 | |||||
| OKE / ONEOK, Inc. | 0,00 | -9,92 | 0,24 | -25,70 | 0,1818 | -0,1265 | |||
| IWF / iShares Trust - iShares Russell 1000 Growth ETF | 0,00 | 0,00 | 0,24 | 17,33 | 0,1801 | -0,0124 | |||
| TMO / Thermo Fisher Scientific Inc. | 0,00 | 0,00 | 0,23 | -18,44 | 0,1747 | -0,0945 | |||
| CME / CME Group Inc. | 0,00 | 0,23 | 0,1745 | 0,1745 | |||||
| HON / Honeywell International Inc. | 0,00 | 0,22 | 0,1640 | 0,1640 | |||||
| MO / Altria Group, Inc. | 0,00 | 0,20 | 0,21 | -0,48 | 0,1575 | -0,0412 | |||
| CSCO / Cisco Systems, Inc. | 0,00 | 0,20 | 0,1553 | 0,1553 | |||||
| MDLZ / Mondelez International, Inc. | 0,00 | 0,20 | 0,1537 | 0,1537 | |||||
| DIS / The Walt Disney Company | 0,00 | 0,20 | 0,1530 | 0,1530 | |||||
| GS / The Goldman Sachs Group, Inc. | 0,00 | 0,20 | 0,1528 | 0,1528 |