Statistiques de base
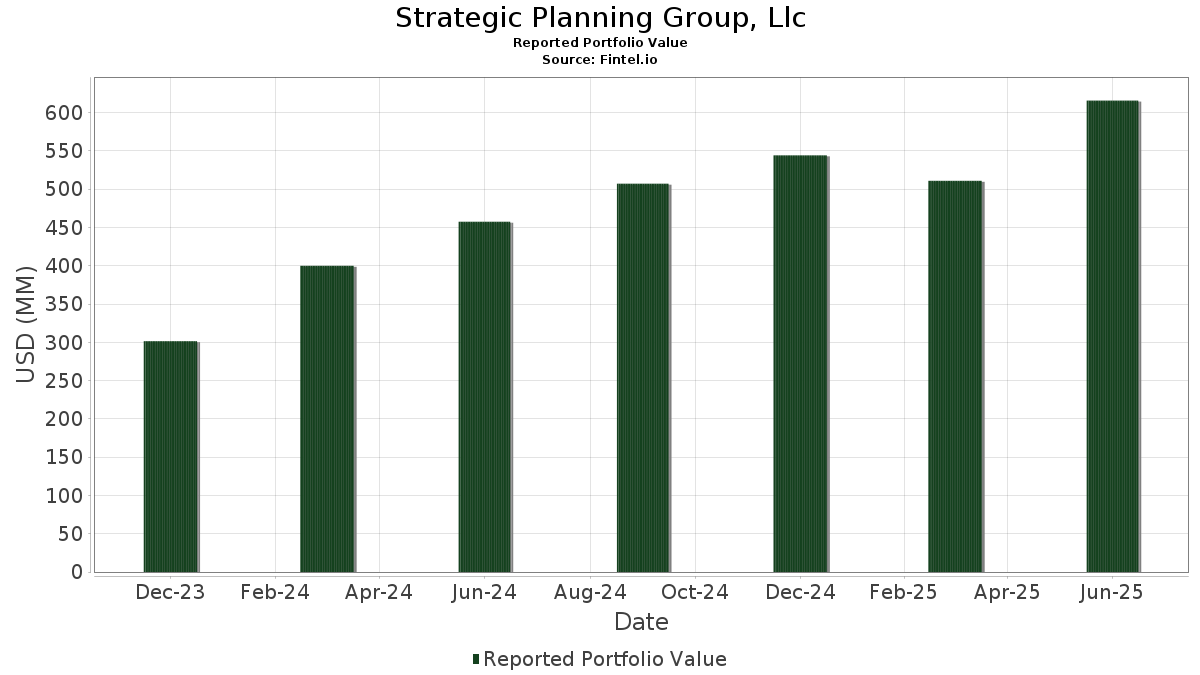
| Valeur du portefeuille | $ 615 741 290 |
| Positions actuelles | 77 |
Dernières positions, performances, ASG (à partir des dépôts 13F, 13D)
Strategic Planning Group, Llc a déclaré un total de 77 positions dans ses derniers dépôts auprès de la SEC. La valeur la plus récente du portefeuille est calculée à 615 741 290 USD. Les actifs sous gestion réels (ASG) sont cette valeur plus les liquidités (qui ne sont pas divulguées). Les principales positions de Strategic Planning Group, Llc sont NVIDIA Corporation (US:NVDA) , Amazon.com, Inc. (US:AMZN) , Apple Inc. (US:AAPL) , Microsoft Corporation (US:MSFT) , and iShares Trust - iShares High Yield Systematic Bond ETF (US:HYDB) . Les nouvelles positions de Strategic Planning Group, Llc incluent Morgan Stanley (US:MS) , HCA Healthcare, Inc. (US:HCA) , Rubrik, Inc. (US:RBRK) , . Les principales industries de Strategic Planning Group, Llc sont "Amusement And Recreation Services" (sic 79) , "Fabricated Metal Products, Except Machinery And Transportation Equipment" (sic 34) , and "Metal Mining" (sic 10) .
Meilleures augmentations ce trimestre
Nous utilisons la variation de l'allocation du portefeuille car il s'agit de l'indicateur le plus significatif. Les changements peuvent être dus à des transactions ou à des variations de prix des actions.
| Titre | Actions (en millions) |
Valeur ($ en millions) |
% du portefeuille | ΔPortefeuille % |
|---|---|---|---|---|
| 0,20 | 30,97 | 5,0297 | 1,5016 | |
| 0,05 | 7,61 | 1,2361 | 1,2361 | |
| 0,03 | 15,40 | 2,5006 | 1,0128 | |
| 0,01 | 5,49 | 0,8908 | 0,8908 | |
| 0,15 | 8,55 | 1,3883 | 0,8782 | |
| 0,05 | 4,45 | 0,7231 | 0,7231 | |
| 0,05 | 17,09 | 2,7758 | 0,7067 | |
| 0,05 | 24,53 | 3,9845 | 0,6384 | |
| 0,02 | 20,76 | 3,3711 | 0,6344 | |
| 0,07 | 3,45 | 0,5595 | 0,5144 |
Principales baisses ce trimestre
Nous utilisons la variation de l'allocation du portefeuille car il s'agit de l'indicateur le plus significatif. Les changements peuvent être dus à des transactions ou à des variations de prix des actions.
| Titre | Actions (en millions) |
Valeur ($ en millions) |
% du portefeuille | ΔPortefeuille % |
|---|---|---|---|---|
| 0,00 | 0,35 | 0,0575 | -1,1503 | |
| 0,00 | 0,25 | 0,0404 | -0,7318 | |
| 0,14 | 28,08 | 4,5601 | -0,6400 | |
| 0,50 | 17,58 | 2,8548 | -0,5878 | |
| 0,50 | 23,56 | 3,8260 | -0,3830 | |
| 0,02 | 7,75 | 1,2582 | -0,3458 | |
| 0,36 | 18,50 | 3,0051 | -0,3402 | |
| 0,16 | 14,19 | 2,3039 | -0,2828 | |
| 0,02 | 15,01 | 2,4374 | -0,2477 | |
| 0,23 | 14,64 | 2,3772 | -0,2272 |
Déclarations 13D/G
Il s'agit d'une liste des déclarations 13D et 13G déposées au cours de la dernière année (le cas échéant). Cliquez sur l'icône du lien pour voir l'historique complet des transactions. Les lignes vertes indiquent de nouvelles positions. Les lignes rouges indiquent des positions fermées.
| Date de dépôt | Formulaire | Titre | Actions précédentes |
Actions actuelles |
ΔActions % | % de participation |
% ΔParticipation | |
|---|---|---|---|---|---|---|---|---|
| 2025-02-05 | YLD / Principal Exchange-Traded Funds - Principal Active High Yield ETF | 998 813 | 1 051 167 | 5,24 | 7,10 | -15,48 | ||
| 2025-02-05 | NFLT / ETFis Series Trust I - Virtus Newfleet Multi-Sector Bond ETF | 640 724 | 672 968 | 5,03 | 6,50 | -23,53 |
Déclarations 13F et dépôts de fonds
Ce formulaire a été déposé le 2025-07-14 pour la période de déclaration 2025-06-30. Cliquez sur l'icône du lien pour voir l'historique complet des transactions.
Mettre à niveau pour débloquer les données premium et exporter vers Excel ![]() .
.
| Titre | Type | Prix moyen de l'action | Actions (en millions) |
ΔActions (%) |
ΔActions (%) |
Valeur ($ en millions) |
Portefeuille (%) |
ΔPortefeuille (%) |
|
|---|---|---|---|---|---|---|---|---|---|
| NVDA / NVIDIA Corporation | 0,20 | 17,85 | 30,97 | 71,80 | 5,0297 | 1,5016 | |||
| AMZN / Amazon.com, Inc. | 0,13 | 11,94 | 29,58 | 29,08 | 4,8038 | 0,3188 | |||
| AAPL / Apple Inc. | 0,14 | 14,41 | 28,08 | 5,68 | 4,5601 | -0,6400 | |||
| MSFT / Microsoft Corporation | 0,05 | 8,30 | 24,53 | 43,50 | 3,9845 | 0,6384 | |||
| HYDB / iShares Trust - iShares High Yield Systematic Bond ETF | 0,50 | 8,65 | 23,56 | 9,54 | 3,8260 | -0,3830 | |||
| GOOG / Alphabet Inc. | 0,12 | 20,23 | 21,57 | 36,52 | 3,5025 | 0,4107 | |||
| NFLX / Netflix, Inc. | 0,02 | 3,37 | 20,76 | 48,44 | 3,3711 | 0,6344 | |||
| EVTR / Morgan Stanley ETF Trust - Eaton Vance Total Return Bond ETF | 0,36 | 7,75 | 18,50 | 8,25 | 3,0051 | -0,3402 | |||
| SCHG / Schwab Strategic Trust - Schwab U.S. Large-Cap Growth ETF | 0,62 | 4,90 | 18,23 | 22,38 | 2,9609 | 0,0452 | |||
| VFLO / Victory Portfolios II - VictoryShares Free Cash Flow ETF | 0,50 | -3,09 | 17,58 | -0,07 | 2,8548 | -0,5878 | |||
| TSLA / Tesla, Inc. | 0,05 | 31,90 | 17,09 | 61,66 | 2,7758 | 0,7067 | |||
| WMT / Walmart Inc. | 0,16 | 5,26 | 16,09 | 17,24 | 2,6134 | -0,0729 | |||
| FIX / Comfort Systems USA, Inc. | 0,03 | 21,76 | 15,40 | 102,57 | 2,5006 | 1,0128 | |||
| COST / Costco Wholesale Corporation | 0,02 | 4,51 | 15,01 | 9,39 | 2,4374 | -0,2477 | |||
| RDVY / First Trust Exchange-Traded Fund VI - First Trust Rising Dividend Achievers ETF | 0,23 | 2,63 | 14,64 | 9,99 | 2,3772 | -0,2272 | |||
| JGRO / J.P. Morgan Exchange-Traded Fund Trust - JPMorgan Active Growth ETF | 0,16 | -7,98 | 14,19 | 7,33 | 2,3039 | -0,2828 | |||
| META / Meta Platforms, Inc. | 0,02 | 15,90 | 12,62 | 48,43 | 2,0503 | 0,3857 | |||
| PANW / Palo Alto Networks, Inc. | 0,05 | 5,15 | 9,45 | 26,10 | 1,5349 | 0,0680 | |||
| JPM / JPMorgan Chase & Co. | 0,03 | 4,73 | 8,99 | 23,77 | 1,4595 | 0,0386 | |||
| IBM / International Business Machines Corporation | 0,03 | 4,48 | 8,67 | 23,87 | 1,4085 | 0,0381 | |||
| OKLO / Oklo Inc. | 0,15 | 26,69 | 8,55 | 228,01 | 1,3883 | 0,8782 | |||
| CSCO / Cisco Systems, Inc. | 0,12 | 5,19 | 8,32 | 18,27 | 1,3508 | -0,0256 | |||
| BRK.A / Berkshire Hathaway Inc. | 0,02 | 3,64 | 7,75 | -5,47 | 1,2582 | -0,3458 | |||
| AVGO / Broadcom Inc. | 0,03 | 22,64 | 7,65 | 101,93 | 1,2421 | 0,5007 | |||
| MS / Morgan Stanley | 0,05 | 7,61 | 1,2361 | 1,2361 | |||||
| NET / Cloudflare, Inc. | 0,04 | 10,82 | 7,37 | 92,58 | 1,1970 | 0,4479 | |||
| ISRG / Intuitive Surgical, Inc. | 0,01 | 5,83 | 7,08 | 16,11 | 1,1496 | -0,0435 | |||
| ORCL / Oracle Corporation | 0,03 | 6,79 | 6,51 | 67,02 | 1,0568 | 0,2942 | |||
| CRWD / CrowdStrike Holdings, Inc. | 0,01 | 2,93 | 6,49 | 48,71 | 1,0537 | 0,1998 | |||
| GS / The Goldman Sachs Group, Inc. | 0,01 | 18,37 | 6,46 | 53,36 | 1,0493 | 0,2248 | |||
| VEEV / Veeva Systems Inc. | 0,02 | 4,06 | 6,33 | 29,38 | 1,0286 | 0,0705 | |||
| JCI / Johnson Controls International plc | 0,06 | 3,51 | 6,26 | 36,47 | 1,0168 | 0,1189 | |||
| AMD / Advanced Micro Devices, Inc. | 0,04 | 16,43 | 6,11 | 60,83 | 0,9916 | 0,2485 | |||
| INTU / Intuit Inc. | 0,01 | 4,27 | 6,04 | 33,75 | 0,9817 | 0,0972 | |||
| HTRB / Hartford Funds Exchange-Traded Trust - Hartford Total Return Bond ETF | 0,18 | 0,99 | 5,95 | 1,02 | 0,9671 | -0,1865 | |||
| SPIB / SPDR Series Trust - SPDR Portfolio Intermediate Term Corporate Bond ETF | 0,17 | 2,98 | 5,84 | 4,03 | 0,9477 | -0,1501 | |||
| COIN / Coinbase Global, Inc. | 0,02 | 24,73 | 5,81 | 153,80 | 0,9441 | 0,4958 | |||
| SHOP / Shopify Inc. | 0,05 | 15,13 | 5,78 | 39,08 | 0,9382 | 0,1253 | |||
| RTX / RTX Corporation | 0,04 | 4,13 | 5,74 | 14,81 | 0,9319 | -0,0464 | |||
| AMT / American Tower Corporation | 0,02 | 3,87 | 5,52 | 5,50 | 0,8966 | -0,1275 | |||
| USB / U.S. Bancorp | 0,12 | 24,06 | 5,50 | 32,98 | 0,8927 | 0,0836 | |||
| HCA / HCA Healthcare, Inc. | 0,01 | 5,49 | 0,8908 | 0,8908 | |||||
| PLTR / Palantir Technologies Inc. | 0,04 | 3,24 | 5,45 | 66,74 | 0,8858 | 0,2456 | |||
| TRV / The Travelers Companies, Inc. | 0,02 | 4,60 | 5,27 | 5,82 | 0,8560 | -0,1188 | |||
| ASML / ASML Holding N.V. - Depositary Receipt (Common Stock) | 0,01 | 12,54 | 5,25 | 36,08 | 0,8528 | 0,0977 | |||
| HON / Honeywell International Inc. | 0,02 | 5,42 | 5,16 | 15,93 | 0,8381 | -0,0330 | |||
| DUK / Duke Energy Corporation | 0,04 | 4,68 | 5,05 | 1,28 | 0,8203 | -0,1558 | |||
| NOC / Northrop Grumman Corporation | 0,01 | 4,10 | 5,04 | 1,65 | 0,8189 | -0,1519 | |||
| BWXT / BWX Technologies, Inc. | 0,03 | 6,33 | 4,80 | 55,29 | 0,7796 | 0,1746 | |||
| PSX / Phillips 66 | 0,04 | 10,62 | 4,66 | 6,87 | 0,7576 | -0,0966 | |||
| PG / The Procter & Gamble Company | 0,03 | 5,72 | 4,62 | -1,16 | 0,7498 | -0,1644 | |||
| LMT / Lockheed Martin Corporation | 0,01 | 5,27 | 4,58 | 9,14 | 0,7431 | -0,0774 | |||
| EOG / EOG Resources, Inc. | 0,04 | 8,50 | 4,48 | 1,20 | 0,7269 | -0,1387 | |||
| SO / The Southern Company | 0,05 | 4,45 | 0,7231 | 0,7231 | |||||
| CRM / Salesforce, Inc. | 0,02 | 7,65 | 4,44 | 9,39 | 0,7207 | -0,0733 | |||
| MMM / 3M Company | 0,03 | 3,80 | 4,23 | 7,61 | 0,6864 | -0,0823 | |||
| TTWO / Take-Two Interactive Software, Inc. | 0,02 | 2,95 | 4,23 | 20,65 | 0,6862 | 0,0007 | |||
| AXP / American Express Company | 0,01 | 5,30 | 3,94 | 24,87 | 0,6402 | 0,0222 | |||
| MA / Mastercard Incorporated | 0,01 | 4,43 | 3,80 | 7,04 | 0,6171 | -0,0775 | |||
| DKNG / DraftKings Inc. | 0,09 | 9,68 | 3,71 | 41,67 | 0,6024 | 0,0899 | |||
| BAC / Bank of America Corporation | 0,07 | 1 218,40 | 3,45 | 1 397,83 | 0,5595 | 0,5144 | |||
| HD / The Home Depot, Inc. | 0,01 | 5,96 | 3,37 | 6,00 | 0,5481 | -0,0750 | |||
| LOW / Lowe's Companies, Inc. | 0,01 | 6,72 | 3,14 | 1,52 | 0,5105 | -0,0955 | |||
| WFC / Wells Fargo & Company | 0,03 | 724,01 | 2,00 | 823,50 | 0,3255 | 0,2829 | |||
| JCPB / J.P. Morgan Exchange-Traded Fund Trust - JPMorgan Core Plus Bond ETF | 0,04 | 8,24 | 1,95 | 8,29 | 0,3163 | -0,0357 | |||
| UITB / Victory Portfolios II - VictoryShares Core Intermediate Bond ETF | 0,04 | 7,13 | 1,73 | 7,41 | 0,2804 | -0,0342 | |||
| JAVA / J.P. Morgan Exchange-Traded Fund Trust - JPMorgan Active Value ETF | 0,03 | -11,60 | 1,70 | -8,88 | 0,2767 | -0,0892 | |||
| FTCS / First Trust Exchange-Traded Fund - First Trust Capital Strength ETF | 0,02 | 8,77 | 1,45 | 10,29 | 0,2351 | -0,0218 | |||
| CDC / Lehman Abs Corp Backed Trust Certs Ser 2001-19 - Preferred Security | 0,02 | 9,43 | 1,43 | 6,11 | 0,2314 | -0,0315 | |||
| QQQ / Invesco QQQ Trust, Series 1 | 0,00 | 0,69 | 0,65 | 18,53 | 0,1049 | -0,0018 | |||
| SPY / SPDR S&P 500 ETF | 0,00 | 3,51 | 0,46 | 14,32 | 0,0740 | -0,0040 | |||
| LLY / Eli Lilly and Company | 0,00 | -93,94 | 0,35 | -94,28 | 0,0575 | -1,1503 | |||
| T / AT&T Inc. | 0,01 | 0,81 | 0,34 | 3,04 | 0,0552 | -0,0093 | |||
| TMO / Thermo Fisher Scientific Inc. | 0,00 | -92,27 | 0,25 | -93,71 | 0,0404 | -0,7318 | |||
| RBRK / Rubrik, Inc. | 0,00 | 0,24 | 0,0382 | 0,0382 | |||||
| SCHX / Schwab Strategic Trust - Schwab U.S. Large-Cap ETF | 0,01 | -14,38 | 0,23 | -5,33 | 0,0376 | -0,0102 | |||
| QQQM / Invesco Exchange-Traded Fund Trust II - Invesco NASDAQ 100 ETF | 0,00 | -69,85 | 0,21 | -64,51 | 0,0338 | -0,0810 | |||
| AVUV / American Century ETF Trust - Avantis U.S. Small Cap Value ETF | 0,00 | -100,00 | 0,00 | 0,0000 | |||||
| ABBV / AbbVie Inc. | 0,00 | -100,00 | 0,00 | 0,0000 | |||||
| FVD / First Trust Exchange-Traded Fund - First Trust Value Line Dividend Index Fund | 0,00 | -100,00 | 0,00 | 0,0000 | |||||
| NEE / NextEra Energy, Inc. | 0,00 | -100,00 | 0,00 | 0,0000 | |||||
| UNH / UnitedHealth Group Incorporated | 0,00 | -100,00 | 0,00 | 0,0000 | |||||
| DHR / Danaher Corporation | 0,00 | -100,00 | 0,00 | 0,0000 |