Statistiques de base
| Valeur du portefeuille | $ 132 811 |
| Positions actuelles | 125 |
Dernières positions, performances, ASG (à partir des dépôts 13F, 13D)
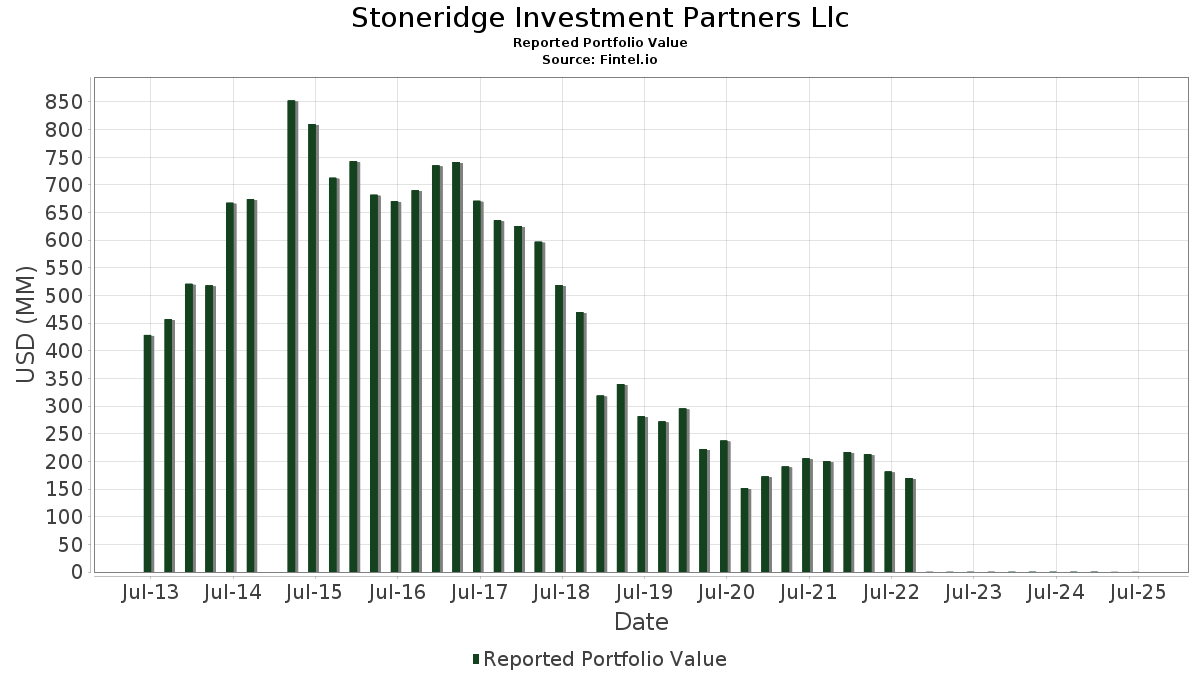
Stoneridge Investment Partners Llc a déclaré un total de 125 positions dans ses derniers dépôts auprès de la SEC. La valeur la plus récente du portefeuille est calculée à 132 811 USD. Les actifs sous gestion réels (ASG) sont cette valeur plus les liquidités (qui ne sont pas divulguées). Les principales positions de Stoneridge Investment Partners Llc sont Direxion Shares ETF Trust - Direxion Daily NVDA Bear 1X Shares (US:NVDD) , Microsoft Corporation (US:MSFT) , Apple Inc. (US:AAPL) , Becton, Dickinson and Company (US:BDX) , and The PNC Financial Services Group, Inc. (US:PNC) . Les nouvelles positions de Stoneridge Investment Partners Llc incluent Workday, Inc. (US:WDAY) , CenterPoint Energy, Inc. (US:CNP) , Savers Value Village, Inc. (US:SVV) , iShares Trust - iShares Russell 2000 Growth ETF (US:IWO) , and Motorola Solutions, Inc. (US:MSI) .
Meilleures augmentations ce trimestre
Nous utilisons la variation de l'allocation du portefeuille car il s'agit de l'indicateur le plus significatif. Les changements peuvent être dus à des transactions ou à des variations de prix des actions.
| Titre | Actions (en millions) |
Valeur ($ en millions) |
% du portefeuille | ΔPortefeuille % |
|---|---|---|---|---|
| 0,03 | 0,00 | 2,7001 | 2,7001 | |
| 0,03 | 0,00 | 1,9742 | 1,2128 | |
| 0,01 | 0,00 | 1,2062 | 1,2062 | |
| 0,02 | 0,00 | 1,1678 | 1,1678 | |
| 0,01 | 0,00 | 1,1385 | 1,1385 | |
| 0,00 | 0,00 | 1,1038 | 1,1038 | |
| 0,03 | 0,00 | 3,4161 | 0,9990 | |
| 0,01 | 0,00 | 0,9510 | 0,9510 | |
| 0,01 | 0,00 | 2,9704 | 0,9454 | |
| 0,03 | 0,00 | 0,8486 | 0,8486 |
Principales baisses ce trimestre
Nous utilisons la variation de l'allocation du portefeuille car il s'agit de l'indicateur le plus significatif. Les changements peuvent être dus à des transactions ou à des variations de prix des actions.
| Titre | Actions (en millions) |
Valeur ($ en millions) |
% du portefeuille | ΔPortefeuille % |
|---|---|---|---|---|
| 0,00 | 0,00 | 0,7627 | -1,4760 | |
| 0,02 | 0,00 | 2,6895 | -0,8803 | |
| 0,01 | 0,00 | 0,2500 | -0,7853 | |
| 0,02 | 0,00 | 0,6603 | -0,5769 | |
| 0,05 | 0,00 | 2,0021 | -0,5595 | |
| 0,01 | 0,00 | 0,7289 | -0,5101 | |
| 0,01 | 0,00 | 0,4653 | -0,3959 | |
| 0,00 | 0,00 | 0,4442 | -0,3629 | |
| 0,02 | 0,00 | 1,2055 | -0,3285 | |
| 0,01 | 0,00 | 1,3802 | -0,3084 |
Déclarations 13F et dépôts de fonds
Ce formulaire a été déposé le 2025-08-11 pour la période de déclaration 2025-06-30. Cliquez sur l'icône du lien pour voir l'historique complet des transactions.
Mettre à niveau pour débloquer les données premium et exporter vers Excel ![]() .
.
| Titre | Type | Prix moyen de l'action | Actions (en millions) |
ΔActions (%) |
ΔActions (%) |
Valeur ($ en millions) |
Portefeuille (%) |
ΔPortefeuille (%) |
|
|---|---|---|---|---|---|---|---|---|---|
| NVDD / Direxion Shares ETF Trust - Direxion Daily NVDA Bear 1X Shares | 0,05 | -17,94 | 0,01 | 16,67 | 5,5108 | 0,3394 | |||
| MSFT / Microsoft Corporation | 0,01 | -15,00 | 0,01 | 16,67 | 5,5011 | 0,0186 | |||
| AAPL / Apple Inc. | 0,03 | 16,63 | 0,01 | 16,67 | 5,3580 | -0,2241 | |||
| BDX / Becton, Dickinson and Company | 0,03 | 110,95 | 0,00 | 100,00 | 3,4161 | 0,9990 | |||
| PNC / The PNC Financial Services Group, Inc. | 0,02 | 0,00 | 0,00 | 0,00 | 2,9824 | -0,1742 | |||
| AVGO / Broadcom Inc. | 0,01 | 0,00 | 0,00 | 50,00 | 2,9704 | 0,9454 | |||
| META / Meta Platforms, Inc. | 0,00 | -14,35 | 0,00 | 0,00 | 2,7565 | -0,0645 | |||
| TJX / The TJX Companies, Inc. | 0,03 | 0,00 | 2,7001 | 2,7001 | |||||
| AMZN / Amazon.com, Inc. | 0,02 | -26,66 | 0,00 | -25,00 | 2,6895 | -0,8803 | |||
| GOOG / Alphabet Inc. | 0,02 | 0,00 | 0,00 | 50,00 | 2,4591 | 0,0277 | |||
| TGT / Target Corporation | 0,03 | 49,71 | 0,00 | 0,00 | 2,1956 | 0,4538 | |||
| GOOG / Alphabet Inc. | 0,02 | 10,83 | 0,00 | 0,00 | 2,0375 | 0,2264 | |||
| GM / General Motors Company | 0,05 | -16,16 | 0,00 | -33,33 | 2,0021 | -0,5595 | |||
| WFC / Wells Fargo & Company | 0,03 | 160,80 | 0,00 | 1,9742 | 1,2128 | ||||
| CRM / Salesforce, Inc. | 0,01 | 13,87 | 0,00 | 100,00 | 1,7122 | 0,0515 | |||
| JNJ / Johnson & Johnson | 0,01 | 104,18 | 0,00 | 100,00 | 1,6633 | 0,6702 | |||
| ADBE / Adobe Inc. | 0,01 | 0,00 | 0,00 | 0,00 | 1,5774 | -0,1779 | |||
| ROST / Ross Stores, Inc. | 0,02 | -4,92 | 0,00 | 0,00 | 1,5669 | -0,2857 | |||
| SPY / SPDR S&P 500 ETF | 0,00 | -9,79 | 0,00 | 0,00 | 1,4020 | -0,1776 | |||
| BIIB / Biogen Inc. | 0,01 | 0,00 | 0,00 | 0,00 | 1,3802 | -0,3084 | |||
| XYL / Xylem Inc. | 0,01 | 0,00 | 0,00 | 0,00 | 1,3478 | -0,0492 | |||
| 0HIN / Assurant, Inc. | 0,01 | 0,00 | 0,00 | 0,00 | 1,3011 | -0,2506 | |||
| WDAY / Workday, Inc. | 0,01 | 0,00 | 1,2062 | 1,2062 | |||||
| MRK / Merck & Co., Inc. | 0,02 | 0,00 | 0,00 | 0,00 | 1,2055 | -0,3285 | |||
| CF / CF Industries Holdings, Inc. | 0,02 | 97,31 | 0,00 | 1,2047 | 0,6224 | ||||
| BBY / Best Buy Co., Inc. | 0,02 | 0,00 | 1,1678 | 1,1678 | |||||
| ADSK / Autodesk, Inc. | 0,00 | -21,26 | 0,00 | 0,00 | 1,1482 | -0,2361 | |||
| XPRO / Expro Group Holdings N.V. | 0,01 | 0,00 | 1,1385 | 1,1385 | |||||
| RF / Regions Financial Corporation | 0,06 | 0,00 | 0,00 | 0,00 | 1,1046 | -0,0406 | |||
| UNH / UnitedHealth Group Incorporated | 0,00 | 0,00 | 1,1038 | 1,1038 | |||||
| USB / U.S. Bancorp | 0,03 | 0,00 | 0,00 | 0,00 | 1,0955 | -0,0513 | |||
| ALLE / Allegion plc | 0,01 | 0,00 | 0,00 | 0,00 | 1,0172 | -0,0164 | |||
| FEDERAL REALTY / (313747206) | 0,01 | 0,00 | 0,0000 | ||||||
| CL / Colgate-Palmolive Company | 0,01 | 0,00 | 0,9510 | 0,9510 | |||||
| VZ / Verizon Communications Inc. | 0,03 | 0,00 | 0,00 | 0,00 | 0,9352 | -0,1652 | |||
| DELL INC / (24702R101) | 0,01 | 0,00 | 0,0000 | ||||||
| LUV / Southwest Airlines Co. | 0,04 | 0,00 | 0,00 | 0,00 | 0,8862 | -0,1440 | |||
| AKAM / Akamai Technologies, Inc. | 0,01 | 0,00 | 0,00 | 0,00 | 0,8742 | -0,1163 | |||
| AMAT / Applied Materials, Inc. | 0,01 | 25,30 | 0,00 | 0,8674 | 0,2513 | ||||
| PPL / PPL Corporation | 0,03 | 0,00 | 0,8486 | 0,8486 | |||||
| HUM / Humana Inc. | 0,00 | -58,63 | 0,00 | -50,00 | 0,7627 | -1,4760 | |||
| ACN / Accenture plc | 0,00 | 0,00 | 0,7439 | 0,7439 | |||||
| XOM / Exxon Mobil Corporation | 0,01 | -27,20 | 0,00 | -100,00 | 0,7289 | -0,5101 | |||
| EL / The Estée Lauder Companies Inc. | 0,01 | 0,00 | 0,7085 | 0,7085 | |||||
| DHI / D.R. Horton, Inc. | 0,01 | 0,00 | 0,6987 | 0,6987 | |||||
| CDNS / Cadence Design Systems, Inc. | 0,00 | 0,00 | 0,6965 | 0,6965 | |||||
| NTAP / NetApp, Inc. | 0,01 | 0,00 | 0,00 | 0,6905 | 0,0515 | ||||
| FITB / Fifth Third Bancorp | 0,02 | 0,00 | 0,6889 | 0,6889 | |||||
| MOS / The Mosaic Company | 0,02 | -55,63 | 0,00 | -100,00 | 0,6603 | -0,5769 | |||
| GWW / W.W. Grainger, Inc. | 0,00 | -23,46 | 0,00 | -100,00 | 0,6310 | -0,2480 | |||
| DVN / Devon Energy Corporation | 0,02 | 0,00 | 0,00 | 0,5828 | -0,1863 | ||||
| JCI / Johnson Controls International plc | 0,01 | 0,00 | 0,00 | 0,5647 | 0,0838 | ||||
| GE / General Electric Company | 0,00 | -30,38 | 0,00 | 0,5602 | -0,1421 | ||||
| CNP / CenterPoint Energy, Inc. | 0,02 | 0,00 | 0,5549 | 0,5549 | |||||
| KEY / KeyCorp | 0,04 | 0,00 | 0,00 | 0,5504 | -0,0167 | ||||
| HPE / Hewlett Packard Enterprise Company | 0,04 | -29,65 | 0,00 | 0,5414 | -0,1102 | ||||
| ND1 / Nordson Corporation | 0,00 | 0,00 | 0,00 | 0,5361 | -0,0301 | ||||
| BKR / Baker Hughes Company | 0,02 | 0,00 | 0,00 | 0,5346 | -0,1533 | ||||
| HPQ / HP Inc. | 0,03 | 0,00 | 0,5338 | 0,5338 | |||||
| EIX / Edison International | 0,01 | -30,73 | 0,00 | -100,00 | 0,4653 | -0,3959 | |||
| EXC / Exelon Corporation | 0,01 | 75,04 | 0,00 | 0,4653 | 0,1484 | ||||
| EOG / EOG Resources, Inc. | 0,00 | 0,00 | 0,00 | 0,4457 | -0,0909 | ||||
| NOW / ServiceNow, Inc. | 0,00 | -52,13 | 0,00 | 0,4442 | -0,3629 | ||||
| PCAR / PACCAR Inc | 0,01 | 0,00 | 0,00 | 0,4420 | -0,0659 | ||||
| GD / General Dynamics Corporation | 0,00 | 0,00 | 0,4420 | 0,4420 | |||||
| RSG / Republic Services, Inc. | 0,00 | 0,00 | 0,4382 | 0,4382 | |||||
| SVV / Savers Value Village, Inc. | 0,05 | 0,00 | 0,4089 | 0,4089 | |||||
| UPS / United Parcel Service, Inc. | 0,01 | 0,00 | 0,00 | 0,3998 | -0,0887 | ||||
| CLX / The Clorox Company | 0,00 | 0,00 | 0,3991 | 0,3991 | |||||
| IWO / iShares Trust - iShares Russell 2000 Growth ETF | 0,00 | 0,00 | 0,3893 | 0,3893 | |||||
| EQIX / Equinix, Inc. | 0,00 | 0,00 | 0,3735 | 0,3735 | |||||
| GJR / Strats Trust For Procter & Gambel Security - Preferred Security | 0,00 | 0,00 | 0,3720 | 0,3720 | |||||
| MSI / Motorola Solutions, Inc. | 0,00 | 0,00 | 0,3569 | 0,3569 | |||||
| SWK / Stanley Black & Decker, Inc. | 0,01 | 0,00 | 0,00 | 0,3441 | -0,0937 | ||||
| T / AT&T Inc. | 0,02 | 0,00 | 0,00 | 0,3403 | -0,0332 | ||||
| GCBC / Greene County Bancorp, Inc. | 0,02 | 25,37 | 0,00 | 0,3328 | 0,0091 | ||||
| FFIN / First Financial Bankshares, Inc. | 0,01 | 0,00 | 0,00 | 0,3072 | -0,0376 | ||||
| CTRA / Coterra Energy Inc. | 0,01 | 0,00 | 0,2748 | 0,2748 | |||||
| COP / ConocoPhillips | 0,00 | 45,94 | 0,00 | 0,2741 | 0,0273 | ||||
| UPBD / Upbound Group, Inc. | 0,01 | 0,00 | 0,2537 | 0,2537 | |||||
| O / Realty Income Corporation | 0,01 | -72,68 | 0,00 | -100,00 | 0,2500 | -0,7853 | |||
| PPG / PPG Industries, Inc. | 0,00 | 0,00 | 0,00 | 0,2296 | -0,0180 | ||||
| SHBI / Shore Bancshares, Inc. | 0,02 | 63,33 | 0,00 | 0,2259 | 0,0924 | ||||
| UDMY / Udemy, Inc. | 0,04 | 0,00 | 0,2168 | 0,2168 | |||||
| ACIW / ACI Worldwide, Inc. | 0,01 | 0,00 | 0,2146 | 0,2146 | |||||
| GAMB / Gambling.com Group Limited | 0,02 | 0,00 | 0,2138 | 0,2138 | |||||
| PFIS / Peoples Financial Services Corp. | 0,01 | 24,08 | 0,00 | 0,2108 | 0,0393 | ||||
| ANF / Abercrombie & Fitch Co. | 0,00 | -3,75 | 0,00 | 0,2101 | -0,0156 | ||||
| CMI / Cummins Inc. | 0,00 | 0,00 | 0,00 | 0,2063 | -0,0160 | ||||
| HLIT / Harmonic Inc. | 0,03 | 0,00 | 0,1935 | 0,1935 | |||||
| MAX / MediaAlpha, Inc. | 0,02 | -22,45 | 0,00 | 0,1762 | -0,0393 | ||||
| SYNA / Synaptics Incorporated | 0,00 | 0,00 | 0,00 | 0,1656 | -0,0177 | ||||
| FG / F&G Annuities & Life, Inc. | 0,01 | 0,00 | 0,1551 | 0,1551 | |||||
| CMT / Core Molding Technologies, Inc. | 0,01 | 0,00 | 0,00 | 0,1423 | -0,0039 | ||||
| UHG / United Homes Group, Inc. | 0,06 | 0,00 | 0,00 | 0,1242 | -0,0101 | ||||
| CTOS / Custom Truck One Source, Inc. | 0,03 | 0,00 | 0,00 | 0,1129 | 0,0048 | ||||
| WBTN / WEBTOON Entertainment Inc. | 0,02 | -11,44 | 0,00 | 0,1047 | -0,0077 | ||||
| MITK / Mitek Systems, Inc. | 0,01 | 0,00 | 0,1039 | 0,1039 | |||||
| DBRG / DigitalBridge Group, Inc. | 0,01 | 0,00 | 0,00 | 0,1024 | 0,0044 | ||||
| STGW / Stagwell Inc. | 0,03 | 0,00 | 0,0986 | 0,0986 | |||||
| NVRI / Enviri Corporation | 0,01 | 0,00 | 0,00 | 0,0911 | 0,0125 | ||||
| TTI / TETRA Technologies, Inc. | 0,04 | 0,00 | 0,00 | 0,0904 | -0,0111 | ||||
| CRGY / Crescent Energy Company | 0,01 | 0,00 | 0,0836 | 0,0836 | |||||
| CVRX / CVRx, Inc. | 0,02 | 0,00 | 0,0828 | 0,0828 | |||||
| IMNM / Immunome, Inc. | 0,01 | 0,00 | 0,00 | 0,0806 | 0,0146 | ||||
| PGEN / Precigen, Inc. | 0,07 | 0,00 | 0,00 | 0,0738 | -0,0124 | ||||
| AISP / Airship AI Holdings, Inc. | 0,02 | 0,00 | 0,0708 | 0,0708 | |||||
| EGAN / eGain Corporation | 0,01 | 0,00 | 0,00 | 0,0678 | 0,0086 | ||||
| VMD / Viemed Healthcare, Inc. | 0,01 | -13,87 | 0,00 | 0,0632 | -0,0238 | ||||
| ALMS / Alumis Inc. | 0,03 | 0,00 | 0,0617 | 0,0617 | |||||
| HBI / Hanesbrands Inc. | 0,02 | 0,00 | 0,00 | 0,0610 | -0,0252 | ||||
| SVCO / Silvaco Group, Inc. | 0,02 | 0,00 | 0,00 | 0,0602 | -0,0048 | ||||
| MDXG / MiMedx Group, Inc. | 0,01 | 0,00 | 0,0595 | 0,0595 | |||||
| TERN / Terns Pharmaceuticals, Inc. | 0,02 | 0,00 | 0,00 | 0,0580 | 0,0098 | ||||
| AHH / Armada Hoffler Properties, Inc. | 0,01 | 0,00 | 0,00 | 0,0542 | -0,0126 | ||||
| MNMD / Mind Medicine (MindMed) Inc. | 0,01 | 0,00 | 0,00 | 0,0527 | -0,0005 | ||||
| APPS / Digital Turbine, Inc. | 0,01 | -14,23 | 0,00 | 0,0504 | 0,0200 | ||||
| NB / NioCorp Developments Ltd. | 0,03 | 0,00 | 0,00 | 0,0474 | 0,0018 | ||||
| CIFR / Cipher Mining Inc. | 0,01 | 0,00 | 0,00 | 0,0459 | 0,0214 | ||||
| STKS / The ONE Group Hospitality, Inc. | 0,01 | -6,09 | 0,00 | 0,0414 | 0,0042 | ||||
| VGAS / Verde Clean Fuels, Inc. | 0,01 | -11,41 | 0,00 | 0,0354 | -0,0077 | ||||
| HCAT / Health Catalyst, Inc. | 0,01 | 0,00 | 0,00 | 0,0309 | -0,0105 | ||||
| GUTS / Fractyl Health, Inc. | 0,02 | 0,00 | 0,00 | 0,0264 | 0,0044 | ||||
| IOVA / Iovance Biotherapeutics, Inc. | 0,02 | 0,00 | 0,0211 | 0,0211 | |||||
| SEAT / Vivid Seats Inc. | 0,01 | 0,00 | 0,0000 | ||||||
| ARLO / Arlo Technologies, Inc. | 0,00 | -100,00 | 0,00 | 0,0000 | |||||
| AEO / American Eagle Outfitters, Inc. | 0,00 | -100,00 | 0,00 | 0,0000 | |||||
| DOMO / Domo, Inc. | 0,00 | -100,00 | 0,00 | 0,0000 | |||||
| C / Citigroup Inc. | 0,00 | -100,00 | 0,00 | 0,0000 | |||||
| JNPR / Juniper Networks, Inc. | 0,00 | -100,00 | 0,00 | 0,0000 | |||||
| EHAB / Enhabit, Inc. | 0,00 | -100,00 | 0,00 | 0,0000 | |||||
| ED / Consolidated Edison, Inc. | 0,00 | -100,00 | 0,00 | 0,0000 | |||||
| DLTR / Dollar Tree, Inc. | 0,00 | -100,00 | 0,00 | 0,0000 | |||||
| VLO / Valero Energy Corporation | 0,00 | -100,00 | 0,00 | 0,0000 | |||||
| DLR / Digital Realty Trust, Inc. | 0,00 | -100,00 | 0,00 | 0,0000 | |||||
| WMT / Walmart Inc. | 0,00 | -100,00 | 0,00 | 0,0000 | |||||
| CORZ / Core Scientific, Inc. | 0,00 | -100,00 | 0,00 | 0,0000 | |||||
| KTOS / Kratos Defense & Security Solutions, Inc. | 0,00 | -100,00 | 0,00 | 0,0000 | |||||
| BAX / Baxter International Inc. | 0,00 | -100,00 | 0,00 | 0,0000 | |||||
| ES / Eversource Energy | 0,00 | -100,00 | 0,00 | 0,0000 | |||||
| VRNS / Varonis Systems, Inc. | 0,00 | -100,00 | 0,00 | 0,0000 | |||||
| INTU / Intuit Inc. | 0,00 | -100,00 | 0,00 | 0,0000 | |||||
| SEPN / Septerna, Inc. | 0,00 | -100,00 | 0,00 | 0,0000 | |||||
| CSCO / Cisco Systems, Inc. | 0,00 | -100,00 | 0,00 | 0,0000 | |||||
| FIS / Fidelity National Information Services, Inc. | 0,00 | -100,00 | 0,00 | 0,0000 | |||||
| CAPR / Capricor Therapeutics, Inc. | 0,00 | -100,00 | 0,00 | 0,0000 | -0,1268 | ||||
| YOU / Clear Secure, Inc. | 0,00 | -100,00 | 0,00 | 0,0000 | |||||
| AVY / Avery Dennison Corporation | 0,00 | -100,00 | 0,00 | 0,0000 | |||||
| DE / Deere & Company | 0,00 | -100,00 | 0,00 | 0,0000 | |||||
| SGHT / Sight Sciences, Inc. | 0,00 | -100,00 | 0,00 | 0,0000 | |||||
| LCTX / Lineage Cell Therapeutics, Inc. | 0,00 | -100,00 | 0,00 | 0,0000 | |||||
| ZBIO / Zenas BioPharma, Inc. | 0,00 | -100,00 | 0,00 | 0,0000 | |||||
| SGMT / Sagimet Biosciences Inc. | 0,00 | -100,00 | 0,00 | 0,0000 | |||||
| SEAT / Vivid Seats Inc. | 0,00 | -100,00 | 0,00 | 0,0000 | -0,0287 |