Statistiques de base
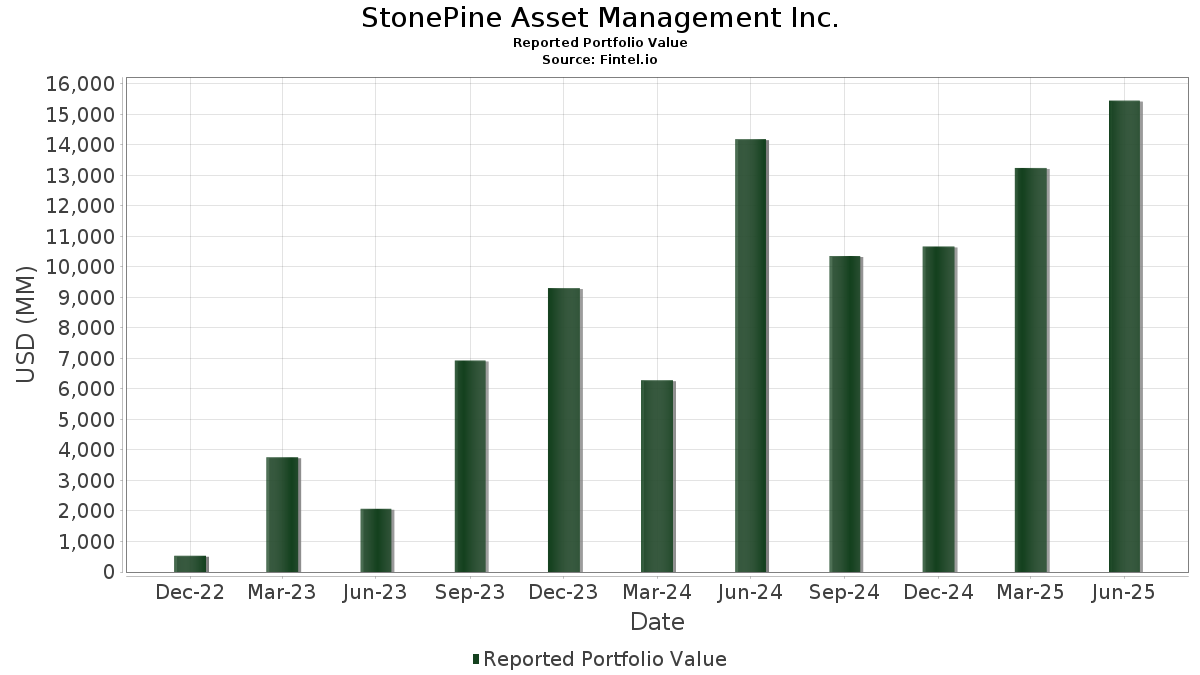
| Valeur du portefeuille | $ 15 454 573 190 |
| Positions actuelles | 44 |
Dernières positions, performances, ASG (à partir des dépôts 13F, 13D)
StonePine Asset Management Inc. a déclaré un total de 44 positions dans ses derniers dépôts auprès de la SEC. La valeur la plus récente du portefeuille est calculée à 15 454 573 190 USD. Les actifs sous gestion réels (ASG) sont cette valeur plus les liquidités (qui ne sont pas divulguées). Les principales positions de StonePine Asset Management Inc. sont Taiwan Semiconductor Manufacturing Company Limited - Depositary Receipt (Common Stock) (US:TSM) , Microsoft Corporation (US:MSFT) , Alphabet Inc. (US:GOOGL) , Moody's Corporation (US:MCO) , and AutoZone, Inc. (US:AZO) . Les nouvelles positions de StonePine Asset Management Inc. incluent Hayward Holdings, Inc. (US:HAYW) , .
Meilleures augmentations ce trimestre
Nous utilisons la variation de l'allocation du portefeuille car il s'agit de l'indicateur le plus significatif. Les changements peuvent être dus à des transactions ou à des variations de prix des actions.
| Titre | Actions (en millions) |
Valeur ($ en millions) |
% du portefeuille | ΔPortefeuille % |
|---|---|---|---|---|
| 3,59 | 785,06 | 5,0798 | 2,1023 | |
| 7,03 | 1 591,26 | 10,2964 | 1,7928 | |
| 3,11 | 1 547,92 | 10,0159 | 1,7137 | |
| 0,33 | 392,77 | 2,5414 | 0,4409 | |
| 0,84 | 224,93 | 1,4554 | 0,4143 | |
| 0,94 | 224,78 | 1,4545 | 0,2958 | |
| 6,41 | 314,41 | 2,0344 | 0,2839 | |
| 5,30 | 387,94 | 2,5102 | 0,2613 | |
| 6,81 | 1 199,62 | 7,7622 | 0,1344 | |
| 2,31 | 1 159,18 | 7,5006 | 0,1334 |
Principales baisses ce trimestre
Nous utilisons la variation de l'allocation du portefeuille car il s'agit de l'indicateur le plus significatif. Les changements peuvent être dus à des transactions ou à des variations de prix des actions.
| Titre | Actions (en millions) |
Valeur ($ en millions) |
% du portefeuille | ΔPortefeuille % |
|---|---|---|---|---|
| 0,83 | 258,73 | 1,6742 | -2,7664 | |
| 0,28 | 1 045,71 | 6,7663 | -1,0412 | |
| 2,52 | 333,26 | 2,1564 | -0,5908 | |
| 2,18 | 332,84 | 2,1537 | -0,4313 | |
| 4,69 | 579,21 | 3,7478 | -0,4115 | |
| 1,61 | 903,15 | 5,8439 | -0,3088 | |
| 0,62 | 326,10 | 2,1100 | -0,2801 | |
| 1,68 | 577,22 | 3,7350 | -0,2207 | |
| 4,64 | 459,36 | 2,9723 | -0,2183 | |
| 2,54 | 700,23 | 4,5309 | -0,2061 |
Déclarations 13F et dépôts de fonds
Ce formulaire a été déposé le 2025-07-16 pour la période de déclaration 2025-06-30. Cliquez sur l'icône du lien pour voir l'historique complet des transactions.
Mettre à niveau pour débloquer les données premium et exporter vers Excel ![]() .
.
| Titre | Type | Prix moyen de l'action | Actions (en millions) |
ΔActions (%) |
ΔActions (%) |
Valeur ($ en millions) |
Portefeuille (%) |
ΔPortefeuille (%) |
|
|---|---|---|---|---|---|---|---|---|---|
| TSM / Taiwan Semiconductor Manufacturing Company Limited - Depositary Receipt (Common Stock) | 7,03 | 3,54 | 1 591,26 | 41,27 | 10,2964 | 1,7928 | |||
| MSFT / Microsoft Corporation | 3,11 | 6,23 | 1 547,92 | 40,76 | 10,0159 | 1,7137 | |||
| GOOGL / Alphabet Inc. | 6,81 | 4,19 | 1 199,62 | 18,73 | 7,7622 | 0,1344 | |||
| MCO / Moody's Corporation | 2,31 | 10,29 | 1 159,18 | 18,79 | 7,5006 | 0,1334 | |||
| AZO / AutoZone, Inc. | 0,28 | 3,85 | 1 045,71 | 1,12 | 6,7663 | -1,0412 | |||
| MA / Mastercard Incorporated | 1,61 | 8,09 | 903,15 | 10,82 | 5,8439 | -0,3088 | |||
| ORCL / Oracle Corporation | 3,59 | 27,29 | 785,06 | 99,06 | 5,0798 | 2,1023 | |||
| CME / CME Group Inc. | 2,54 | 7,42 | 700,23 | 11,60 | 4,5309 | -0,2061 | |||
| TJX / The TJX Companies, Inc. | 4,69 | 3,69 | 579,21 | 5,13 | 3,7478 | -0,4115 | |||
| SHW / The Sherwin-Williams Company | 1,68 | 12,04 | 577,22 | 10,17 | 3,7350 | -0,2207 | |||
| MSCI / MSCI Inc. | 0,89 | 11,87 | 513,37 | 14,10 | 3,3218 | -0,0751 | |||
| OTIS / Otis Worldwide Corporation | 4,64 | 13,28 | 459,36 | 8,69 | 2,9723 | -0,2183 | |||
| MTD / Mettler-Toledo International Inc. | 0,33 | 41,91 | 392,77 | 41,16 | 2,5414 | 0,4409 | |||
| CARR / Carrier Global Corporation | 5,30 | 12,81 | 387,94 | 30,23 | 2,5102 | 0,2613 | |||
| GGG / Graco Inc. | 3,91 | 9,12 | 336,26 | 12,33 | 2,1758 | -0,0841 | |||
| PEP / PepsiCo, Inc. | 2,52 | 4,00 | 333,26 | -8,41 | 2,1564 | -0,5908 | |||
| JNJ / Johnson & Johnson | 2,18 | 5,54 | 332,84 | -2,79 | 2,1537 | -0,4313 | |||
| SPGI / S&P Global Inc. | 0,62 | -0,75 | 326,10 | 3,00 | 2,1100 | -0,2801 | |||
| CPRT / Copart, Inc. | 6,41 | 56,38 | 314,41 | 35,60 | 2,0344 | 0,2839 | |||
| HDB / HDFC Bank Limited - Depositary Receipt (Common Stock) | 4,07 | 2,66 | 312,39 | 18,46 | 2,0213 | 0,0305 | |||
| UNH / UnitedHealth Group Incorporated | 0,83 | -26,15 | 258,73 | -56,01 | 1,6742 | -2,7664 | |||
| HLT / Hilton Worldwide Holdings Inc. | 0,84 | 39,35 | 224,93 | 63,11 | 1,4554 | 0,4143 | |||
| ADI / Analog Devices, Inc. | 0,94 | 24,10 | 224,78 | 46,47 | 1,4545 | 0,2958 | |||
| LOW / Lowe's Companies, Inc. | 0,99 | 7,45 | 219,58 | 2,22 | 1,4208 | -0,2010 | |||
| FDS / FactSet Research Systems Inc. | 0,38 | 8,83 | 170,17 | 7,07 | 1,1011 | -0,0988 | |||
| ADBE / Adobe Inc. | 0,33 | 13,25 | 126,59 | 14,24 | 0,8191 | -0,0175 | |||
| NKE / NIKE, Inc. | 1,68 | 17,14 | 119,69 | 31,09 | 0,7745 | 0,0852 | |||
| CL / Colgate-Palmolive Company | 1,26 | 8,09 | 114,48 | 4,87 | 0,7407 | -0,0834 | |||
| WH / Wyndham Hotels & Resorts, Inc. | 0,41 | 102,96 | 35,30 | 92,39 | 0,2284 | 0,0899 | |||
| FSS / Federal Signal Corporation | 0,20 | 13,32 | 21,09 | 63,97 | 0,1365 | 0,0394 | |||
| IPAR / Interparfums, Inc. | 0,11 | -1,42 | 14,25 | 13,67 | 0,0922 | -0,0024 | |||
| HLI / Houlihan Lokey, Inc. | 0,07 | 7,35 | 13,41 | 19,61 | 0,0867 | 0,0021 | |||
| TREX / Trex Company, Inc. | 0,24 | 20,02 | 13,04 | 12,34 | 0,0844 | -0,0033 | |||
| MEDP / Medpace Holdings, Inc. | 0,04 | 0,00 | 11,39 | 3,01 | 0,0737 | -0,0098 | |||
| JKHY / Jack Henry & Associates, Inc. | 0,06 | 37,44 | 10,85 | 35,63 | 0,0702 | 0,0098 | |||
| JBTM / JBT Marel Corporation | 0,09 | -4,80 | 10,49 | -6,31 | 0,0679 | -0,0167 | |||
| DCI / Donaldson Company, Inc. | 0,15 | -14,02 | 10,46 | -11,08 | 0,0677 | -0,0211 | |||
| WDFC / WD-40 Company | 0,04 | 7,15 | 9,95 | 0,17 | 0,0644 | -0,0106 | |||
| BRKR / Bruker Corporation | 0,24 | 0,00 | 9,79 | -1,29 | 0,0633 | -0,0115 | |||
| EXPO / Exponent, Inc. | 0,12 | 6,60 | 9,17 | -1,75 | 0,0593 | -0,0111 | |||
| SSD / Simpson Manufacturing Co., Inc. | 0,06 | -3,81 | 9,01 | -4,90 | 0,0583 | -0,0132 | |||
| FND / Floor & Decor Holdings, Inc. | 0,11 | 0,00 | 8,53 | -5,60 | 0,0552 | -0,0130 | |||
| HAYW / Hayward Holdings, Inc. | 0,52 | 7,19 | 0,0465 | 0,0465 | |||||
| POWI / Power Integrations, Inc. | 0,08 | 0,00 | 4,42 | 10,69 | 0,0286 | -0,0015 | |||
| MIDD / The Middleby Corporation | 0,00 | -100,00 | 0,00 | 0,0000 | |||||
| BDX / Becton, Dickinson and Company | 0,00 | -100,00 | 0,00 | 0,0000 |