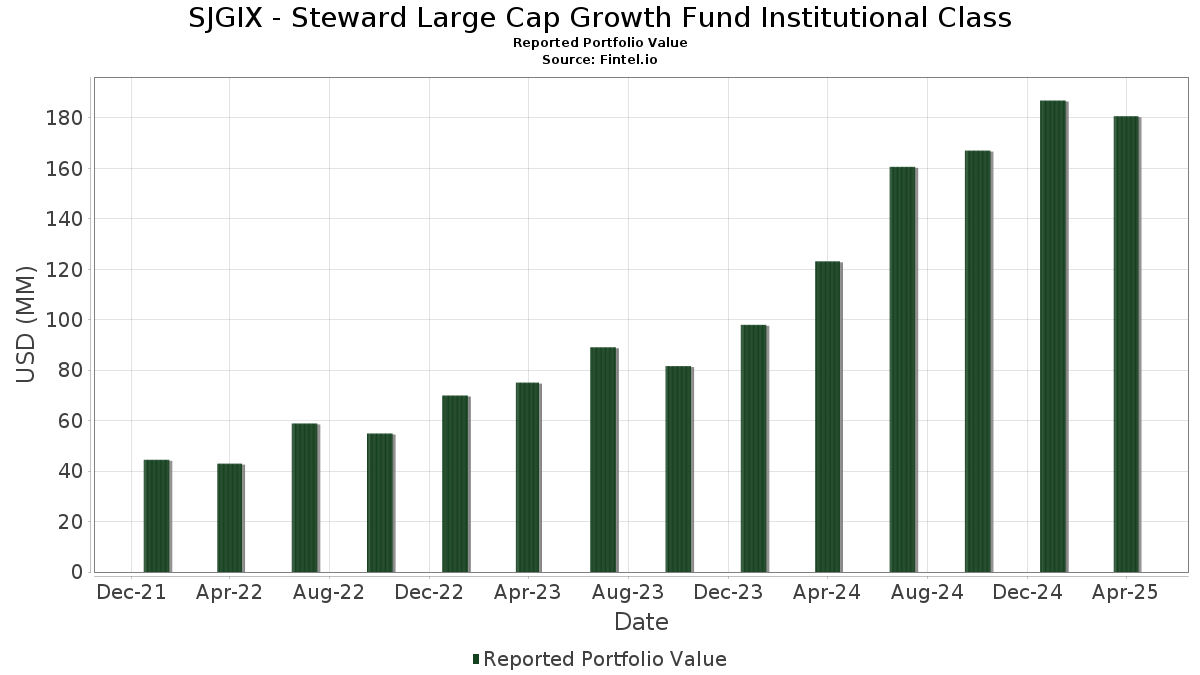
Statistiques de base
| Valeur du portefeuille | $ 180 670 129 |
| Positions actuelles | 70 |
Dernières positions, performances, ASG (à partir des dépôts 13F, 13D)
SJGIX - Steward Large Cap Growth Fund Institutional Class a déclaré un total de 70 positions dans ses derniers dépôts auprès de la SEC. La valeur la plus récente du portefeuille est calculée à 180 670 129 USD. Les actifs sous gestion réels (ASG) sont cette valeur plus les liquidités (qui ne sont pas divulguées). Les principales positions de SJGIX - Steward Large Cap Growth Fund Institutional Class sont Microsoft Corporation (US:MSFT) , NVIDIA Corporation (US:NVDA) , Apple Inc. (US:AAPL) , Alphabet Inc. (US:GOOGL) , and Amazon.com, Inc. (US:AMZN) . Les nouvelles positions de SJGIX - Steward Large Cap Growth Fund Institutional Class incluent Atlassian Corporation (US:TEAM) , Okta, Inc. (US:OKTA) , ResMed Inc. (US:RMD) , Generac Holdings Inc. (IT:1GNRC) , and Paycom Software, Inc. (US:PAYC) .
Meilleures augmentations ce trimestre
Nous utilisons la variation de l'allocation du portefeuille car il s'agit de l'indicateur le plus significatif. Les changements peuvent être dus à des transactions ou à des variations de prix des actions.
| Titre | Actions (en millions) |
Valeur ($ en millions) |
% du portefeuille | ΔPortefeuille % |
|---|---|---|---|---|
| 0,04 | 17,39 | 9,6289 | 1,4076 | |
| 0,01 | 2,10 | 1,1645 | 1,1645 | |
| 0,01 | 2,05 | 1,1376 | 1,1376 | |
| 0,02 | 2,02 | 1,1178 | 1,1178 | |
| 0,01 | 1,89 | 1,0479 | 1,0479 | |
| 0,02 | 1,83 | 1,0132 | 1,0132 | |
| 0,01 | 1,81 | 1,0027 | 1,0027 | |
| 0,01 | 1,80 | 0,9943 | 0,9943 | |
| 0,01 | 2,09 | 1,1551 | 0,9617 | |
| 0,03 | 1,99 | 1,1031 | 0,6981 |
Principales baisses ce trimestre
Nous utilisons la variation de l'allocation du portefeuille car il s'agit de l'indicateur le plus significatif. Les changements peuvent être dus à des transactions ou à des variations de prix des actions.
| Titre | Actions (en millions) |
Valeur ($ en millions) |
% du portefeuille | ΔPortefeuille % |
|---|---|---|---|---|
| 0,00 | 0,00 | -1,3368 | ||
| 0,00 | 0,63 | 0,3474 | -1,1144 | |
| 0,01 | 5,49 | 3,0396 | -1,0188 | |
| 0,01 | 3,67 | 2,0309 | -0,7849 | |
| 0,00 | 0,71 | 0,3946 | -0,5605 | |
| 0,01 | 0,92 | 0,5098 | -0,5337 | |
| 0,06 | 8,73 | 4,8356 | -0,4069 | |
| 0,06 | 12,75 | 7,0591 | -0,3949 | |
| 0,01 | 2,69 | 1,4877 | -0,3415 | |
| 0,02 | 1,38 | 0,7655 | -0,2303 |
Déclarations 13F et dépôts de fonds
Ce formulaire a été déposé le 2025-06-26 pour la période de déclaration 2025-04-30. Cliquez sur l'icône du lien pour voir l'historique complet des transactions.
Mettre à niveau pour débloquer les données premium et exporter vers Excel ![]() .
.
| Titre | Type | Prix moyen de l'action | Actions (en millions) |
ΔActions (%) |
ΔActions (%) |
Valeur ($ en millions) |
Portefeuille (%) |
ΔPortefeuille (%) |
|
|---|---|---|---|---|---|---|---|---|---|
| MSFT / Microsoft Corporation | 0,04 | 18,92 | 17,39 | 13,24 | 9,6289 | 1,4076 | |||
| NVDA / NVIDIA Corporation | 0,14 | 3,79 | 14,92 | -5,85 | 8,2617 | -0,2230 | |||
| AAPL / Apple Inc. | 0,06 | 1,69 | 12,75 | -8,43 | 7,0591 | -0,3949 | |||
| GOOGL / Alphabet Inc. | 0,06 | 14,58 | 8,73 | -10,80 | 4,8356 | -0,4069 | |||
| AMZN / Amazon.com, Inc. | 0,05 | 20,51 | 8,67 | -6,49 | 4,7990 | -0,1633 | |||
| V / Visa Inc. | 0,02 | 6,25 | 5,87 | 7,41 | 3,2519 | 0,3243 | |||
| META / Meta Platforms, Inc. | 0,01 | -9,09 | 5,49 | -27,57 | 3,0396 | -1,0188 | |||
| MA / Mastercard Incorporated | 0,01 | 0,00 | 4,93 | -1,32 | 2,7309 | 0,0549 | |||
| AVGO / Broadcom Inc. | 0,02 | 10,53 | 4,04 | -3,88 | 2,2378 | -0,0128 | |||
| TSLA / Tesla, Inc. | 0,01 | 0,00 | 3,67 | -30,25 | 2,0309 | -0,7849 | |||
| BKNG / Booking Holdings Inc. | 0,00 | 0,00 | 3,06 | 7,64 | 1,6940 | 0,1722 | |||
| PGR / The Progressive Corporation | 0,01 | -9,09 | 2,82 | 3,95 | 1,5599 | 0,1087 | |||
| CRM / Salesforce, Inc. | 0,01 | 0,00 | 2,69 | -21,36 | 1,4877 | -0,3415 | |||
| QCOM / QUALCOMM Incorporated | 0,02 | 0,00 | 2,38 | -14,14 | 1,3151 | -0,1661 | |||
| FTNT / Fortinet, Inc. | 0,02 | -4,35 | 2,28 | -1,64 | 1,2638 | 0,0217 | |||
| AMT / American Tower Corporation | 0,01 | 0,00 | 2,25 | 21,90 | 1,2480 | 0,2579 | |||
| ADSK / Autodesk, Inc. | 0,01 | 0,00 | 2,19 | -11,89 | 1,2147 | -0,1186 | |||
| VEEV / Veeva Systems Inc. | 0,01 | 2,10 | 1,1645 | 1,1645 | |||||
| WAT / Waters Corporation | 0,01 | 500,00 | 2,09 | 545,82 | 1,1551 | 0,9617 | |||
| GDDY / GoDaddy Inc. | 0,01 | 10,00 | 2,07 | -2,59 | 1,1470 | 0,0086 | |||
| TEAM / Atlassian Corporation | 0,01 | 2,05 | 1,1376 | 1,1376 | |||||
| OKTA / Okta, Inc. | 0,02 | 2,02 | 1,1178 | 1,1178 | |||||
| EME / EMCOR Group, Inc. | 0,01 | 150,00 | 2,00 | 123,55 | 1,1093 | 0,6295 | |||
| DECK / Deckers Outdoor Corporation | 0,02 | 80,00 | 1,99 | 12,46 | 1,1045 | 0,1550 | |||
| NTNX / Nutanix, Inc. | 0,03 | 163,64 | 1,99 | 163,49 | 1,1031 | 0,6981 | |||
| CAH / Cardinal Health, Inc. | 0,01 | -12,50 | 1,98 | 0,00 | 1,0952 | 0,0360 | |||
| DT / Dynatrace, Inc. | 0,04 | 16,67 | 1,97 | -5,15 | 1,0922 | -0,0207 | |||
| TWLO / Twilio Inc. | 0,02 | 100,00 | 1,93 | 32,01 | 1,0709 | 0,2862 | |||
| LPLA / LPL Financial Holdings Inc. | 0,01 | -14,29 | 1,92 | 23,74 | 1,0623 | 0,0921 | |||
| RMD / ResMed Inc. | 0,01 | 1,89 | 1,0479 | 1,0479 | |||||
| AMP / Ameriprise Financial, Inc. | 0,00 | 0,00 | 1,88 | -13,30 | 1,0431 | -0,1204 | |||
| IRDM / Iridium Communications Inc. | 0,08 | 20,31 | 1,86 | 0,98 | 1,0287 | 0,0437 | |||
| 1GNRC / Generac Holdings Inc. | 0,02 | 1,83 | 1,0132 | 1,0132 | |||||
| PAYC / Paycom Software, Inc. | 0,01 | 1,81 | 1,0027 | 1,0027 | |||||
| NXST / Nexstar Media Group, Inc. | 0,01 | 1,80 | 0,9943 | 0,9943 | |||||
| ALL / The Allstate Corporation | 0,01 | 0,00 | 1,79 | 3,18 | 0,9886 | 0,0619 | |||
| LOPE / Grand Canyon Education, Inc. | 0,01 | -9,09 | 1,78 | -7,71 | 0,9876 | -0,0467 | |||
| DBX / Dropbox, Inc. | 0,06 | 0,00 | 1,77 | -11,19 | 0,9800 | -0,0871 | |||
| EQIX / Equinix, Inc. | 0,00 | 0,00 | 1,72 | -5,80 | 0,9531 | -0,0251 | |||
| G / Genpact Limited | 0,03 | -17,07 | 1,71 | -14,43 | 0,9461 | -0,1226 | |||
| WSM / Williams-Sonoma, Inc. | 0,01 | 10,00 | 1,70 | -19,59 | 0,9408 | -0,1908 | |||
| TPR / Tapestry, Inc. | 0,02 | -14,81 | 1,62 | -17,52 | 0,8997 | -0,1546 | |||
| JLL / Jones Lang LaSalle Incorporated | 0,01 | 0,00 | 1,59 | -19,61 | 0,8813 | -0,1784 | |||
| HRB / H&R Block, Inc. | 0,03 | 0,00 | 1,57 | 9,11 | 0,8690 | 0,0992 | |||
| INCY / Incyte Corporation | 0,03 | 0,00 | 1,57 | -15,53 | 0,8673 | -0,1252 | |||
| LOW / Lowe's Companies, Inc. | 0,01 | 0,00 | 1,56 | -14,07 | 0,8664 | -0,1080 | |||
| DVA / DaVita Inc. | 0,01 | 0,00 | 1,56 | -19,66 | 0,8621 | -0,1755 | |||
| GEN / Gen Digital Inc. | 0,06 | 0,00 | 1,55 | -3,84 | 0,8594 | -0,0050 | |||
| NFLX / Netflix, Inc. | 0,00 | 62,50 | 1,47 | 88,35 | 0,8146 | 0,3962 | |||
| BAH / Booz Allen Hamilton Holding Corporation | 0,01 | -14,29 | 1,44 | -20,27 | 0,7974 | -0,1694 | |||
| PYPL / PayPal Holdings, Inc. | 0,02 | 0,00 | 1,38 | -25,70 | 0,7655 | -0,2303 | |||
| CI / The Cigna Group | 0,00 | -20,00 | 1,36 | -7,55 | 0,7531 | -0,0344 | |||
| COST / Costco Wholesale Corporation | 0,00 | 44,44 | 1,29 | 46,65 | 0,7158 | 0,2437 | |||
| NTAP / NetApp, Inc. | 0,01 | 0,00 | 1,26 | -26,51 | 0,6957 | -0,2194 | |||
| IRM / Iron Mountain Incorporated | 0,01 | 0,00 | 1,26 | -11,68 | 0,6950 | -0,0662 | |||
| CROX / Crocs, Inc. | 0,01 | 0,00 | 1,16 | -5,47 | 0,6406 | -0,0151 | |||
| CBRE / CBRE Group, Inc. | 0,01 | 0,00 | 1,15 | -15,59 | 0,6359 | -0,0925 | |||
| SPG / Simon Property Group, Inc. | 0,01 | -14,29 | 0,94 | -22,43 | 0,5228 | -0,1287 | |||
| PEGA / Pegasystems Inc. | 0,01 | -44,44 | 0,92 | -52,80 | 0,5098 | -0,5337 | |||
| AMCR / Amcor plc | 0,09 | 0,86 | 0,4764 | 0,4764 | |||||
| AXP / American Express Company | 0,00 | 0,00 | 0,80 | -16,07 | 0,4425 | -0,0673 | |||
| SYF / Synchrony Financial | 0,02 | 0,00 | 0,79 | -24,74 | 0,4401 | -0,1249 | |||
| HPQ / HP Inc. | 0,03 | 0,00 | 0,79 | -21,35 | 0,4389 | -0,1005 | |||
| MCK / McKesson Corporation | 0,00 | -66,67 | 0,71 | -60,09 | 0,3946 | -0,5605 | |||
| KMB / Kimberly-Clark Corporation | 0,01 | 0,00 | 0,66 | 1,39 | 0,3648 | 0,0169 | |||
| INTU / Intuit Inc. | 0,00 | -75,00 | 0,63 | -74,31 | 0,3474 | -1,1144 | |||
| RHI / Robert Half Inc. | 0,01 | 0,00 | 0,35 | -31,66 | 0,1962 | -0,0813 | |||
| HD / The Home Depot, Inc. | 0,00 | 50,00 | 0,32 | 31,17 | 0,1796 | 0,0473 | |||
| YUM / Yum! Brands, Inc. | 0,00 | 0,15 | 0,0833 | 0,0833 | |||||
| NTPXX / Northern Institutional Funds - Northern Institutional Treasury Portfolio Premier Shares | 0,13 | -55,40 | 0,13 | -55,48 | 0,0699 | -0,0816 | |||
| MCO / Moody's Corporation | 0,00 | -100,00 | 0,00 | -100,00 | -1,3368 |