Statistiques de base
| Valeur du portefeuille | $ 20 154 967 |
| Positions actuelles | 96 |
Dernières positions, performances, ASG (à partir des dépôts 13F, 13D)
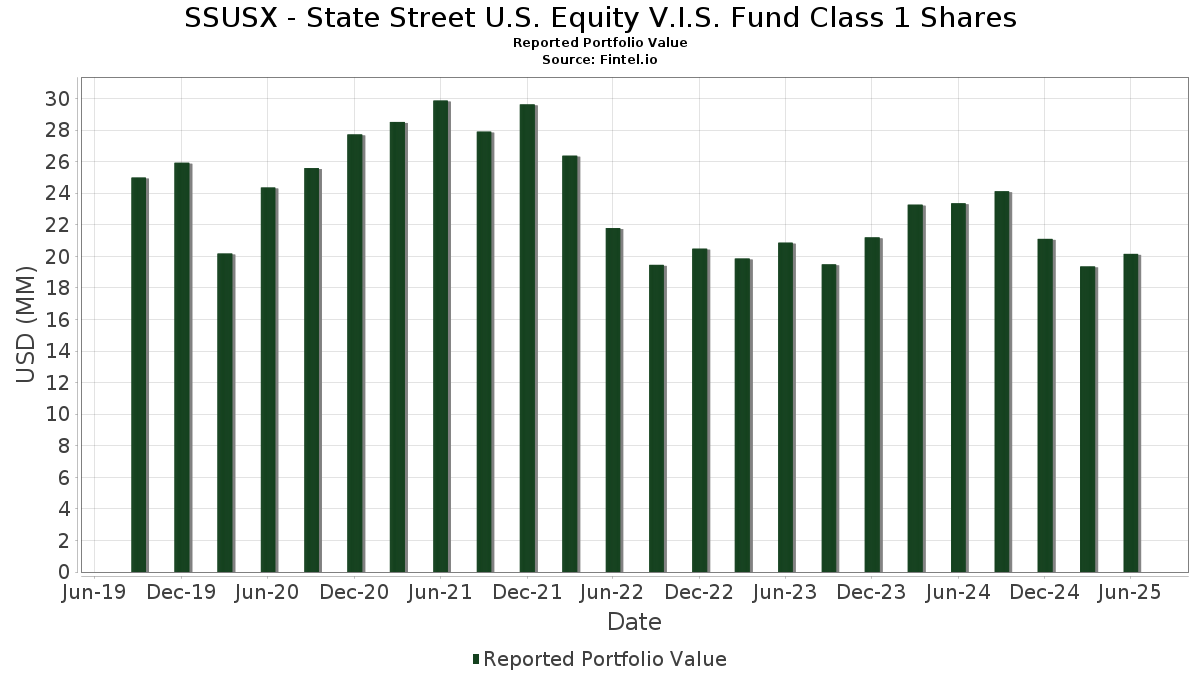
SSUSX - State Street U.S. Equity V.I.S. Fund Class 1 Shares a déclaré un total de 96 positions dans ses derniers dépôts auprès de la SEC. La valeur la plus récente du portefeuille est calculée à 20 154 967 USD. Les actifs sous gestion réels (ASG) sont cette valeur plus les liquidités (qui ne sont pas divulguées). Les principales positions de SSUSX - State Street U.S. Equity V.I.S. Fund Class 1 Shares sont NVIDIA Corporation (US:NVDA) , Microsoft Corporation (US:MSFT) , Apple Inc. (US:AAPL) , Amazon.com, Inc. (US:AMZN) , and Meta Platforms, Inc. (US:META) . Les nouvelles positions de SSUSX - State Street U.S. Equity V.I.S. Fund Class 1 Shares incluent EQT Corporation (US:EQT) , CrowdStrike Holdings, Inc. (US:CRWD) , The Cooper Companies, Inc. (US:COO) , .
Meilleures augmentations ce trimestre
Nous utilisons la variation de l'allocation du portefeuille car il s'agit de l'indicateur le plus significatif. Les changements peuvent être dus à des transactions ou à des variations de prix des actions.
| Titre | Actions (en millions) |
Valeur ($ en millions) |
% du portefeuille | ΔPortefeuille % |
|---|---|---|---|---|
| 0,65 | 0,65 | 3,2072 | 3,2049 | |
| 0,01 | 1,69 | 8,3760 | 1,6483 | |
| 0,00 | 1,61 | 7,9939 | 1,3131 | |
| 0,00 | 0,21 | 1,0356 | 1,0356 | |
| 0,00 | 0,63 | 3,1088 | 0,9879 | |
| 0,00 | 0,31 | 1,5205 | 0,8827 | |
| 0,00 | 0,16 | 0,8052 | 0,8052 | |
| 0,00 | 0,25 | 1,2597 | 0,6954 | |
| 0,00 | 0,24 | 1,1703 | 0,5845 | |
| 0,00 | 0,80 | 3,9881 | 0,4271 |
Principales baisses ce trimestre
Nous utilisons la variation de l'allocation du portefeuille car il s'agit de l'indicateur le plus significatif. Les changements peuvent être dus à des transactions ou à des variations de prix des actions.
| Titre | Actions (en millions) |
Valeur ($ en millions) |
% du portefeuille | ΔPortefeuille % |
|---|---|---|---|---|
| 0,00 | 0,98 | 4,8823 | -1,2856 | |
| 0,00 | 0,18 | 0,8958 | -0,9761 | |
| 0,00 | 0,07 | 0,3444 | -0,8602 | |
| 0,00 | 0,12 | 0,5778 | -0,8518 | |
| 0,00 | 0,06 | 0,2900 | -0,7945 | |
| 0,00 | 0,08 | 0,3838 | -0,6443 | |
| 0,00 | 0,05 | 0,2408 | -0,5331 | |
| 0,00 | 0,17 | 0,8652 | -0,4387 | |
| 0,00 | 0,14 | 0,6764 | -0,4223 | |
| 0,01 | 0,13 | 0,6562 | -0,4015 |
Déclarations 13F et dépôts de fonds
Ce formulaire a été déposé le 2025-08-28 pour la période de déclaration 2025-06-30. Cliquez sur l'icône du lien pour voir l'historique complet des transactions.
Mettre à niveau pour débloquer les données premium et exporter vers Excel ![]() .
.
| Titre | Type | Prix moyen de l'action | Actions (en millions) |
ΔActions (%) |
ΔActions (%) |
Valeur ($ en millions) |
Portefeuille (%) |
ΔPortefeuille (%) |
|
|---|---|---|---|---|---|---|---|---|---|
| NVDA / NVIDIA Corporation | 0,01 | -11,08 | 1,69 | 29,65 | 8,3760 | 1,6483 | |||
| MSFT / Microsoft Corporation | 0,00 | -5,98 | 1,61 | 24,59 | 7,9939 | 1,3131 | |||
| AAPL / Apple Inc. | 0,00 | -10,77 | 0,98 | -17,60 | 4,8823 | -1,2856 | |||
| AMZN / Amazon.com, Inc. | 0,00 | -6,04 | 0,93 | 8,35 | 4,6361 | 0,1807 | |||
| META / Meta Platforms, Inc. | 0,00 | -8,95 | 0,80 | 16,55 | 3,9881 | 0,4271 | |||
| GOOGL / Alphabet Inc. | 0,00 | -7,15 | 0,78 | 5,71 | 3,8587 | 0,0617 | |||
| GVMXX / State Street Institutional Investment Trust - State Street Institutional US Govt Money Market Fnd Premier Cls | 0,65 | 140 116,27 | 0,65 | 11,96 | 3,2072 | 3,2049 | |||
| AVGO / Broadcom Inc. | 0,00 | -7,30 | 0,63 | 52,68 | 3,1088 | 0,9879 | |||
| JPM / JPMorgan Chase & Co. | 0,00 | -17,19 | 0,42 | -2,08 | 2,1059 | -0,1346 | |||
| V / Visa Inc. | 0,00 | -10,28 | 0,36 | -9,11 | 1,7828 | -0,2594 | |||
| BAC / Bank of America Corporation | 0,01 | -1,88 | 0,35 | 11,29 | 1,7142 | 0,1101 | |||
| HD / The Home Depot, Inc. | 0,00 | -7,82 | 0,33 | -7,78 | 1,6518 | -0,2131 | |||
| GS / The Goldman Sachs Group, Inc. | 0,00 | 91,59 | 0,31 | 148,78 | 1,5205 | 0,8827 | |||
| LLY / Eli Lilly and Company | 0,00 | 28,81 | 0,30 | 21,69 | 1,5046 | 0,2160 | |||
| UBER / Uber Technologies, Inc. | 0,00 | -4,09 | 0,29 | 22,78 | 1,4453 | 0,2201 | |||
| EMR / Emerson Electric Co. | 0,00 | 1,57 | 0,27 | 23,61 | 1,3251 | 0,2081 | |||
| PH / Parker-Hannifin Corporation | 0,00 | -6,40 | 0,27 | 7,72 | 1,3169 | 0,0420 | |||
| CRM / Salesforce, Inc. | 0,00 | 128,75 | 0,25 | 132,11 | 1,2597 | 0,6954 | |||
| URI / United Rentals, Inc. | 0,00 | -9,34 | 0,25 | 8,77 | 1,2336 | 0,0551 | |||
| SPGI / S&P Global Inc. | 0,00 | -5,31 | 0,24 | -1,61 | 1,2139 | -0,0722 | |||
| UNH / UnitedHealth Group Incorporated | 0,00 | 127,70 | 0,24 | 35,75 | 1,2089 | 0,2809 | |||
| AMAT / Applied Materials, Inc. | 0,00 | 10,03 | 0,24 | 38,73 | 1,1954 | 0,2987 | |||
| BRK.B / Berkshire Hathaway Inc. | 0,00 | -10,00 | 0,24 | -17,81 | 1,1931 | -0,3201 | |||
| LIN / Linde plc | 0,00 | -17,41 | 0,24 | -16,96 | 1,1710 | -0,2940 | |||
| TXN / Texas Instruments Incorporated | 0,00 | 80,03 | 0,24 | 107,96 | 1,1703 | 0,5845 | |||
| WM / Waste Management, Inc. | 0,00 | -13,98 | 0,22 | -14,94 | 1,1036 | -0,2479 | |||
| TMO / Thermo Fisher Scientific Inc. | 0,00 | 23,60 | 0,21 | 0,94 | 1,0642 | -0,0360 | |||
| PM / Philip Morris International Inc. | 0,00 | 0,21 | 1,0356 | 1,0356 | |||||
| ADBE / Adobe Inc. | 0,00 | 22,64 | 0,20 | 24,07 | 0,9982 | 0,1581 | |||
| BR / Broadridge Financial Solutions, Inc. | 0,00 | 2,90 | 0,20 | 3,13 | 0,9852 | -0,0093 | |||
| NEE / NextEra Energy, Inc. | 0,00 | -15,75 | 0,19 | -17,90 | 0,9376 | -0,2457 | |||
| WMT / Walmart Inc. | 0,00 | -7,85 | 0,18 | 2,84 | 0,9000 | -0,0130 | |||
| JNJ / Johnson & Johnson | 0,00 | -45,90 | 0,18 | -50,28 | 0,8958 | -0,9761 | |||
| IQV / IQVIA Holdings Inc. | 0,00 | 25,17 | 0,18 | 12,10 | 0,8750 | 0,0607 | |||
| AMT / American Tower Corporation | 0,00 | -31,98 | 0,17 | -30,95 | 0,8652 | -0,4387 | |||
| SNPS / Synopsys, Inc. | 0,00 | -9,89 | 0,17 | 7,69 | 0,8344 | 0,0279 | |||
| EQIX / Equinix, Inc. | 0,00 | 0,16 | 0,8052 | 0,8052 | |||||
| MLM / Martin Marietta Materials, Inc. | 0,00 | 7,27 | 0,16 | 22,90 | 0,8035 | 0,1243 | |||
| XOM / Exxon Mobil Corporation | 0,00 | -14,11 | 0,15 | -22,22 | 0,7654 | -0,2582 | |||
| ORCL / Oracle Corporation | 0,00 | -3,90 | 0,15 | 51,04 | 0,7225 | 0,2219 | |||
| NFLX / Netflix, Inc. | 0,00 | -8,62 | 0,14 | 30,56 | 0,7043 | 0,1455 | |||
| TTEK / Tetra Tech, Inc. | 0,00 | 21,29 | 0,14 | 49,46 | 0,6932 | 0,2092 | |||
| COP / ConocoPhillips | 0,00 | -24,99 | 0,14 | -35,85 | 0,6764 | -0,4223 | |||
| CBRE / CBRE Group, Inc. | 0,00 | 16,19 | 0,14 | 23,85 | 0,6737 | 0,1102 | |||
| ETN / Eaton Corporation plc | 0,00 | -4,81 | 0,13 | 25,23 | 0,6660 | 0,1113 | |||
| KVUE / Kenvue Inc. | 0,01 | -25,99 | 0,13 | -35,29 | 0,6562 | -0,4015 | |||
| MSCI / MSCI Inc. | 0,00 | 9,62 | 0,13 | 8,26 | 0,6524 | 0,1491 | |||
| CMS / CMS Energy Corporation | 0,00 | 163,96 | 0,13 | 145,28 | 0,6469 | 0,3703 | |||
| MRK / Merck & Co., Inc. | 0,00 | -52,29 | 0,12 | -57,97 | 0,5778 | -0,8518 | |||
| ICE / Intercontinental Exchange, Inc. | 0,00 | -3,50 | 0,12 | 2,65 | 0,5771 | -0,0083 | |||
| ORLY / O'Reilly Automotive, Inc. | 0,00 | 1 287,10 | 0,12 | -12,78 | 0,5769 | -0,1114 | |||
| RTX / RTX Corporation | 0,00 | -14,27 | 0,11 | -5,08 | 0,5571 | -0,0567 | |||
| TT / Trane Technologies plc | 0,00 | -20,94 | 0,11 | 2,80 | 0,5491 | -0,0079 | |||
| GOOG / Alphabet Inc. | 0,00 | -7,96 | 0,11 | 3,85 | 0,5395 | 0,0020 | |||
| TSLA / Tesla, Inc. | 0,00 | -7,82 | 0,11 | 12,50 | 0,5390 | 0,0423 | |||
| DIS / The Walt Disney Company | 0,00 | -7,89 | 0,10 | 15,12 | 0,4959 | 0,0498 | |||
| GM / General Motors Company | 0,00 | -7,89 | 0,10 | -2,97 | 0,4871 | -0,0391 | |||
| CVX / Chevron Corporation | 0,00 | -10,70 | 0,10 | -24,22 | 0,4860 | -0,1760 | |||
| AMD / Advanced Micro Devices, Inc. | 0,00 | -7,87 | 0,10 | 28,00 | 0,4781 | 0,0869 | |||
| MCD / McDonald's Corporation | 0,00 | -7,91 | 0,10 | -13,64 | 0,4726 | -0,0987 | |||
| UNP / Union Pacific Corporation | 0,00 | -11,83 | 0,09 | -13,76 | 0,4681 | -0,0994 | |||
| SRE / Sempra | 0,00 | -4,09 | 0,09 | 2,17 | 0,4673 | -0,0105 | |||
| PEP / PepsiCo, Inc. | 0,00 | -8,02 | 0,09 | -19,09 | 0,4435 | -0,1266 | |||
| NOW / ServiceNow, Inc. | 0,00 | -35,82 | 0,09 | -16,98 | 0,4387 | -0,1124 | |||
| PGR / The Progressive Corporation | 0,00 | -6,38 | 0,09 | -11,34 | 0,4277 | -0,0767 | |||
| ABT / Abbott Laboratories | 0,00 | -17,69 | 0,09 | -15,84 | 0,4238 | -0,0991 | |||
| AZN / AstraZeneca PLC - Depositary Receipt (Common Stock) | 0,00 | -7,79 | 0,09 | -12,37 | 0,4227 | -0,0793 | |||
| MNST / Monster Beverage Corporation | 0,00 | -7,89 | 0,08 | -2,41 | 0,4065 | -0,0228 | |||
| CB / Chubb Limited | 0,00 | -59,48 | 0,08 | -61,31 | 0,3838 | -0,6443 | |||
| INTU / Intuit Inc. | 0,00 | -3,26 | 0,07 | 25,00 | 0,3478 | 0,0560 | |||
| APH / Amphenol Corporation | 0,00 | -7,95 | 0,07 | 38,00 | 0,3459 | 0,0860 | |||
| BDX / Becton, Dickinson and Company | 0,00 | -60,41 | 0,07 | -70,39 | 0,3444 | -0,8602 | |||
| DHR / Danaher Corporation | 0,00 | -18,56 | 0,07 | -21,59 | 0,3440 | -0,1124 | |||
| GWW / W.W. Grainger, Inc. | 0,00 | -7,04 | 0,07 | -2,86 | 0,3407 | -0,0217 | |||
| ELV / Elevance Health, Inc. | 0,00 | 3,11 | 0,06 | -8,57 | 0,3204 | -0,0414 | |||
| COST / Costco Wholesale Corporation | 0,00 | -9,72 | 0,06 | -5,88 | 0,3193 | -0,0325 | |||
| EQT / EQT Corporation | 0,00 | 0,06 | 0,2926 | 0,2926 | |||||
| MA / Mastercard Incorporated | 0,00 | -72,85 | 0,06 | -72,25 | 0,2900 | -0,7945 | |||
| MMC / Marsh & McLennan Companies, Inc. | 0,00 | -2,26 | 0,06 | -12,50 | 0,2810 | -0,0531 | |||
| ACN / Accenture plc | 0,00 | -4,08 | 0,06 | -8,20 | 0,2788 | -0,0371 | |||
| IDXX / IDEXX Laboratories, Inc. | 0,00 | -50,48 | 0,06 | -36,78 | 0,2741 | -0,1771 | |||
| VST / Vistra Corp. | 0,00 | 26,91 | 0,05 | 107,69 | 0,2721 | 0,1368 | |||
| CME / CME Group Inc. | 0,00 | -53,08 | 0,05 | -51,35 | 0,2708 | -0,3076 | |||
| CRWD / CrowdStrike Holdings, Inc. | 0,00 | 0,05 | 0,2704 | 0,2704 | |||||
| TMUS / T-Mobile US, Inc. | 0,00 | -8,02 | 0,05 | -19,05 | 0,2577 | -0,0688 | |||
| VRTX / Vertex Pharmaceuticals Incorporated | 0,00 | -64,72 | 0,05 | -67,79 | 0,2408 | -0,5331 | |||
| FIS / Fidelity National Information Services, Inc. | 0,00 | -26,67 | 0,05 | -20,69 | 0,2311 | -0,0699 | |||
| ROST / Ross Stores, Inc. | 0,00 | -7,96 | 0,04 | -9,30 | 0,1975 | -0,0263 | |||
| AIG / American International Group, Inc. | 0,00 | -2,53 | 0,04 | -4,88 | 0,1962 | -0,0167 | |||
| COO / The Cooper Companies, Inc. | 0,00 | 0,04 | 0,1960 | 0,1960 | |||||
| ECL / Ecolab Inc. | 0,00 | -21,55 | 0,04 | -15,56 | 0,1898 | -0,0472 | |||
| MDLZ / Mondelez International, Inc. | 0,00 | 8,19 | 0,03 | 6,45 | 0,1680 | 0,0053 | |||
| LOW / Lowe's Companies, Inc. | 0,00 | -7,45 | 0,03 | -10,81 | 0,1640 | -0,0300 | |||
| IFF / International Flavors & Fragrances Inc. | 0,00 | 9,59 | 0,03 | 3,57 | 0,1460 | -0,0004 | |||
| BMRN / BioMarin Pharmaceutical Inc. | 0,00 | -7,78 | 0,02 | -28,12 | 0,1165 | -0,0526 | |||
| SP500 MIC EMIN FUTSEP25 / DE (000000000) | 0,01 | 0,0651 | 0,0651 |