Statistiques de base
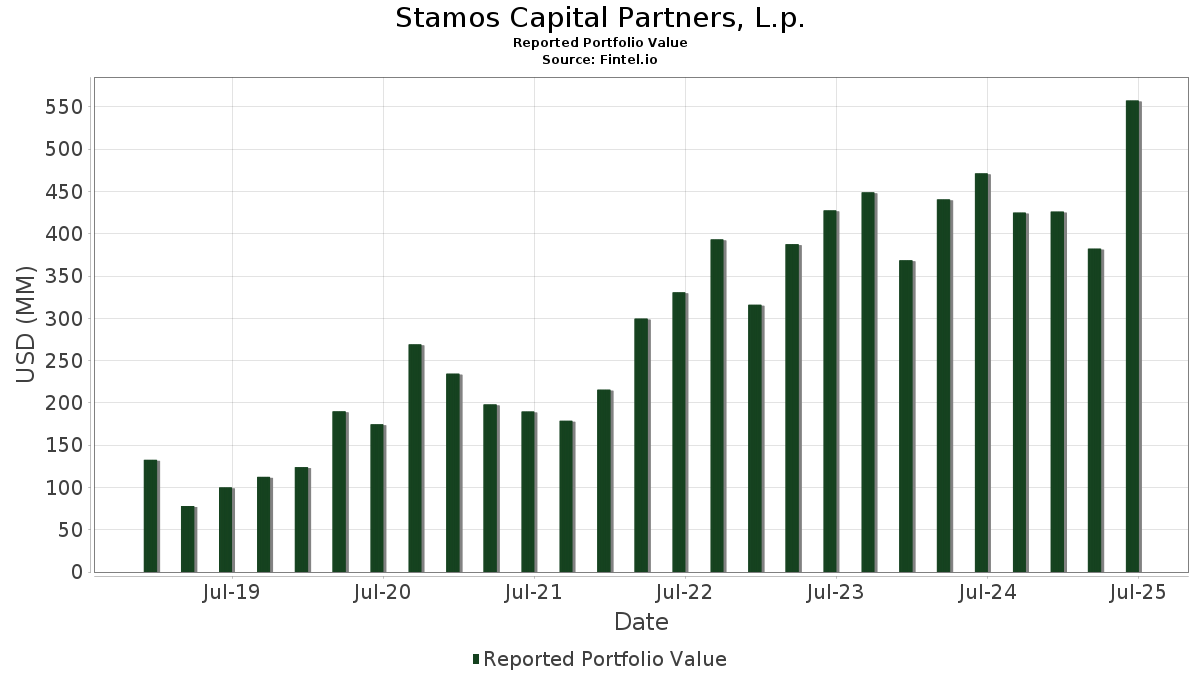
| Valeur du portefeuille | $ 557 486 482 |
| Positions actuelles | 138 |
Dernières positions, performances, ASG (à partir des dépôts 13F, 13D)
Stamos Capital Partners, L.p. a déclaré un total de 138 positions dans ses derniers dépôts auprès de la SEC. La valeur la plus récente du portefeuille est calculée à 557 486 482 USD. Les actifs sous gestion réels (ASG) sont cette valeur plus les liquidités (qui ne sont pas divulguées). Les principales positions de Stamos Capital Partners, L.p. sont iShares Trust - iShares Core U.S. Aggregate Bond ETF (US:AGG) , Merck & Co., Inc. (US:MRK) , Exxon Mobil Corporation (US:XOM) , UnitedHealth Group Incorporated (US:UNH) , and Chevron Corporation (US:CVX) . Les nouvelles positions de Stamos Capital Partners, L.p. incluent iShares Trust - iShares MSCI India ETF (US:INDA) , .
Meilleures augmentations ce trimestre
Nous utilisons la variation de l'allocation du portefeuille car il s'agit de l'indicateur le plus significatif. Les changements peuvent être dus à des transactions ou à des variations de prix des actions.
| Titre | Actions (en millions) |
Valeur ($ en millions) |
% du portefeuille | ΔPortefeuille % |
|---|---|---|---|---|
| 0,06 | 17,59 | 3,1556 | 1,5292 | |
| 0,16 | 17,70 | 3,1746 | 0,9996 | |
| 0,07 | 13,20 | 2,3681 | 0,8006 | |
| 0,11 | 15,62 | 2,8011 | 0,6298 | |
| 0,23 | 17,96 | 3,2219 | 0,5399 | |
| 0,08 | 5,78 | 1,0372 | 0,4485 | |
| 0,03 | 7,05 | 1,2646 | 0,4226 | |
| 0,03 | 8,84 | 1,5864 | 0,4049 | |
| 0,48 | 14,33 | 2,5697 | 0,3991 | |
| 0,02 | 9,57 | 1,7161 | 0,3947 |
Principales baisses ce trimestre
Nous utilisons la variation de l'allocation du portefeuille car il s'agit de l'indicateur le plus significatif. Les changements peuvent être dus à des transactions ou à des variations de prix des actions.
| Titre | Actions (en millions) |
Valeur ($ en millions) |
% du portefeuille | ΔPortefeuille % |
|---|---|---|---|---|
| 0,48 | 48,06 | 8,6201 | -8,4163 | |
| 0,12 | 5,20 | 0,9322 | -0,2455 | |
| 0,35 | 8,49 | 1,5235 | -0,2372 | |
| 0,00 | 0,00 | -0,2093 | ||
| 0,19 | 7,14 | 1,2811 | -0,1920 | |
| 0,06 | 3,97 | 0,7116 | -0,1896 | |
| 0,03 | 1,99 | 0,3572 | -0,1671 | |
| 0,01 | 2,01 | 0,3614 | -0,1630 | |
| 0,04 | 2,02 | 0,3618 | -0,1617 | |
| 0,03 | 2,01 | 0,3609 | -0,1614 |
Déclarations 13F et dépôts de fonds
Ce formulaire a été déposé le 2025-08-14 pour la période de déclaration 2025-06-30. Cliquez sur l'icône du lien pour voir l'historique complet des transactions.
Mettre à niveau pour débloquer les données premium et exporter vers Excel ![]() .
.
| Titre | Type | Prix moyen de l'action | Actions (en millions) |
ΔActions (%) |
ΔActions (%) |
Valeur ($ en millions) |
Portefeuille (%) |
ΔPortefeuille (%) |
|
|---|---|---|---|---|---|---|---|---|---|
| AGG / iShares Trust - iShares Core U.S. Aggregate Bond ETF | 0,48 | -26,43 | 48,06 | -26,22 | 8,6201 | -8,4163 | |||
| MRK / Merck & Co., Inc. | 0,23 | 98,63 | 17,96 | 75,18 | 3,2219 | 0,5399 | |||
| XOM / Exxon Mobil Corporation | 0,16 | 134,81 | 17,70 | 112,83 | 3,1746 | 0,9996 | |||
| UNH / UnitedHealth Group Incorporated | 0,06 | 374,98 | 17,59 | 182,95 | 3,1556 | 1,5292 | |||
| CVX / Chevron Corporation | 0,11 | 119,78 | 15,62 | 88,13 | 2,8011 | 0,6298 | |||
| BP / BP p.l.c. - Depositary Receipt (Common Stock) | 0,48 | 94,89 | 14,33 | 72,63 | 2,5697 | 0,3991 | |||
| SHEL / Shell plc - Depositary Receipt (Common Stock) | 0,19 | 69,29 | 13,54 | 62,67 | 2,4292 | 0,2515 | |||
| GOOGL / Alphabet Inc. | 0,07 | 93,31 | 13,20 | 120,31 | 2,3681 | 0,8006 | |||
| NEE / NextEra Energy, Inc. | 0,16 | 82,59 | 11,05 | 78,80 | 1,9818 | 0,3656 | |||
| JNJ / Johnson & Johnson | 0,07 | 58,73 | 9,94 | 46,21 | 1,7834 | 0,0046 | |||
| MSFT / Microsoft Corporation | 0,02 | 42,92 | 9,57 | 89,41 | 1,7161 | 0,3947 | |||
| TSM / Taiwan Semiconductor Manufacturing Company Limited - Depositary Receipt (Common Stock) | 0,04 | 26,58 | 9,07 | 72,71 | 1,6278 | 0,2534 | |||
| JPM / JPMorgan Chase & Co. | 0,03 | 65,66 | 8,84 | 95,81 | 1,5864 | 0,4049 | |||
| PFE / Pfizer Inc. | 0,35 | 31,90 | 8,49 | 26,18 | 1,5235 | -0,2372 | |||
| AMZN / Amazon.com, Inc. | 0,04 | 60,23 | 8,20 | 84,75 | 1,4715 | 0,3101 | |||
| BAC / Bank of America Corporation | 0,16 | 46,84 | 7,52 | 66,52 | 1,3480 | 0,1675 | |||
| TM / Toyota Motor Corporation - Depositary Receipt (Common Stock) | 0,04 | 93,36 | 7,25 | 88,68 | 1,3011 | 0,2955 | |||
| ASML / ASML Holding N.V. - Depositary Receipt (Common Stock) | 0,01 | 27,64 | 7,18 | 54,36 | 1,2873 | 0,0712 | |||
| GSK / GSK plc - Depositary Receipt (Common Stock) | 0,19 | 27,94 | 7,14 | 26,83 | 1,2811 | -0,1920 | |||
| AAPL / Apple Inc. | 0,03 | 137,12 | 7,05 | 119,05 | 1,2646 | 0,4226 | |||
| F / Ford Motor Company | 0,60 | 25,66 | 6,46 | 35,94 | 1,1583 | -0,0843 | |||
| BA / The Boeing Company | 0,03 | 46,72 | 6,45 | 80,25 | 1,1577 | 0,2211 | |||
| T / AT&T Inc. | 0,21 | 41,37 | 6,20 | 44,67 | 1,1125 | -0,0089 | |||
| BLK / BlackRock, Inc. | 0,01 | 21,91 | 6,06 | 35,16 | 1,0862 | -0,0858 | |||
| AMD / Advanced Micro Devices, Inc. | 0,04 | 12,84 | 5,79 | 55,88 | 1,0388 | 0,0669 | |||
| NVO / Novo Nordisk A/S - Depositary Receipt (Common Stock) | 0,08 | 158,46 | 5,78 | 156,98 | 1,0372 | 0,4485 | |||
| BN / Brookfield Corporation | 0,09 | 60,22 | 5,71 | 89,08 | 1,0247 | 0,2344 | |||
| MDT / Medtronic plc | 0,06 | 29,70 | 5,30 | 25,83 | 0,9508 | -0,1512 | |||
| VZ / Verizon Communications Inc. | 0,12 | 21,00 | 5,20 | 15,42 | 0,9322 | -0,2455 | |||
| DHI / D.R. Horton, Inc. | 0,04 | 61,78 | 4,89 | 64,07 | 0,8765 | 0,0974 | |||
| LEN / Lennar Corporation | 0,04 | 69,91 | 4,86 | 63,76 | 0,8723 | 0,0955 | |||
| TOL / Toll Brothers, Inc. | 0,04 | 51,15 | 4,83 | 63,37 | 0,8658 | 0,0930 | |||
| CNI / Canadian National Railway Company | 0,05 | 29,31 | 4,74 | 38,04 | 0,8502 | -0,0479 | |||
| BX / Blackstone Inc. | 0,03 | 59,26 | 4,72 | 70,41 | 0,8472 | 0,1223 | |||
| AVGO / Broadcom Inc. | 0,02 | -10,45 | 4,72 | 47,45 | 0,8462 | 0,0092 | |||
| NVDA / NVIDIA Corporation | 0,03 | 13,77 | 4,51 | 65,85 | 0,8092 | 0,0977 | |||
| SLB / Schlumberger Limited | 0,13 | 121,37 | 4,50 | 79,01 | 0,8077 | 0,1497 | |||
| ADBE / Adobe Inc. | 0,01 | 93,67 | 4,33 | 95,40 | 0,7768 | 0,1970 | |||
| V / Visa Inc. | 0,01 | 60,96 | 4,25 | 63,08 | 0,7630 | 0,0807 | |||
| LLY / Eli Lilly and Company | 0,01 | 96,14 | 4,20 | 85,09 | 0,7528 | 0,1598 | |||
| DIS / The Walt Disney Company | 0,03 | 26,19 | 4,14 | 58,60 | 0,7428 | 0,0596 | |||
| BCS / Barclays PLC - Depositary Receipt (Common Stock) | 0,22 | 14,88 | 4,11 | 39,03 | 0,7368 | -0,0359 | |||
| DELL / Dell Technologies Inc. | 0,03 | -5,57 | 4,09 | 27,00 | 0,7333 | -0,1086 | |||
| CEG / Constellation Energy Corporation | 0,01 | 12,21 | 4,00 | 79,63 | 0,7183 | 0,1352 | |||
| CVS / CVS Health Corporation | 0,06 | 13,09 | 3,97 | 15,15 | 0,7116 | -0,1896 | |||
| CP / Canadian Pacific Kansas City Limited | 0,05 | 48,89 | 3,87 | 68,13 | 0,6946 | 0,0921 | |||
| CRM / Salesforce, Inc. | 0,01 | 91,50 | 3,87 | 94,62 | 0,6945 | 0,1741 | |||
| MLPX / Global X Funds - Global X MLP & Energy Infrastructure ETF | 0,06 | 51,80 | 3,80 | 49,04 | 0,6816 | 0,0148 | |||
| CME / CME Group Inc. | 0,01 | 22,72 | 3,78 | 27,49 | 0,6789 | -0,0976 | |||
| AMLP / ALPS ETF Trust - Alerian MLP ETF | 0,08 | 56,75 | 3,77 | 47,44 | 0,6769 | 0,0075 | |||
| XOP / SPDR Series Trust - SPDR S&P Oil & Gas Exploration & Production ETF | 0,03 | 91,57 | 3,70 | 82,95 | 0,6640 | 0,1348 | |||
| UNP / Union Pacific Corporation | 0,02 | 55,94 | 3,67 | 51,90 | 0,6583 | 0,0262 | |||
| HSBC / HSBC Holdings plc - Depositary Receipt (Common Stock) | 0,06 | 17,36 | 3,66 | 24,24 | 0,6566 | -0,1142 | |||
| ENB / Enbridge Inc. | 0,08 | 45,56 | 3,64 | 48,92 | 0,6526 | 0,0134 | |||
| VST / Vistra Corp. | 0,02 | -6,53 | 3,44 | 54,28 | 0,6170 | 0,0338 | |||
| XBI / SPDR Series Trust - SPDR S&P Biotech ETF | 0,04 | 47,74 | 3,33 | 51,09 | 0,5975 | 0,0208 | |||
| HD / The Home Depot, Inc. | 0,01 | 276,31 | 3,21 | 276,64 | 0,5757 | 0,3527 | |||
| CCJ / Cameco Corporation | 0,04 | -18,98 | 3,08 | 46,11 | 0,5532 | 0,0011 | |||
| CSCO / Cisco Systems, Inc. | 0,04 | 8,36 | 3,06 | 21,83 | 0,5497 | -0,1083 | |||
| CAT / Caterpillar Inc. | 0,01 | 17,50 | 3,03 | 38,30 | 0,5442 | -0,0296 | |||
| IYR / iShares Trust - iShares U.S. Real Estate ETF | 0,03 | 64,13 | 2,81 | 62,51 | 0,5032 | 0,0515 | |||
| USRT / iShares Trust - iShares Core U.S. REIT ETF | 0,05 | 63,88 | 2,78 | 60,94 | 0,4990 | 0,0468 | |||
| KMI / Kinder Morgan, Inc. | 0,09 | 33,35 | 2,68 | 37,40 | 0,4813 | -0,0295 | |||
| D / Dominion Energy, Inc. | 0,05 | 20,68 | 2,63 | 21,67 | 0,4714 | -0,0937 | |||
| SPG / Simon Property Group, Inc. | 0,02 | 67,72 | 2,62 | 62,37 | 0,4698 | 0,0478 | |||
| FSLR / First Solar, Inc. | 0,02 | 98,70 | 2,61 | 160,36 | 0,4689 | 0,2061 | |||
| PAVE / Global X Funds - Global X U.S. Infrastructure Development ETF | 0,06 | 31,53 | 2,44 | 51,90 | 0,4380 | 0,0176 | |||
| UBER / Uber Technologies, Inc. | 0,03 | -6,71 | 2,39 | 19,46 | 0,4296 | -0,0948 | |||
| SO / The Southern Company | 0,03 | 22,24 | 2,39 | 22,14 | 0,4286 | -0,0833 | |||
| UBS / UBS Group AG | 0,07 | 54,39 | 2,38 | 70,58 | 0,4275 | 0,0618 | |||
| HDB / HDFC Bank Limited - Depositary Receipt (Common Stock) | 0,03 | 44,86 | 2,34 | 67,24 | 0,4195 | 0,0536 | |||
| AEP / American Electric Power Company, Inc. | 0,02 | 23,24 | 2,31 | 17,00 | 0,4138 | -0,1018 | |||
| DUK / Duke Energy Corporation | 0,02 | 20,50 | 2,29 | 16,58 | 0,4112 | -0,1031 | |||
| SONY / Sony Group Corporation - Depositary Receipt (Common Stock) | 0,09 | 66,73 | 2,23 | 70,97 | 0,3995 | 0,0587 | |||
| GDX / VanEck ETF Trust - VanEck Gold Miners ETF | 0,04 | 29,05 | 2,21 | 46,10 | 0,3964 | 0,0009 | |||
| PANW / Palo Alto Networks, Inc. | 0,01 | 49,50 | 2,19 | 79,25 | 0,3921 | 0,0732 | |||
| BRK.B / Berkshire Hathaway Inc. | 0,00 | 195,87 | 2,16 | 169,96 | 0,3870 | 0,1779 | |||
| XLE / The Select Sector SPDR Trust - The Energy Select Sector SPDR Fund | 0,03 | 68,37 | 2,15 | 52,84 | 0,3861 | 0,0176 | |||
| DE / Deere & Company | 0,00 | 31,61 | 2,12 | 42,56 | 0,3798 | -0,0086 | |||
| XLU / The Select Sector SPDR Trust - The Utilities Select Sector SPDR Fund | 0,03 | 45,26 | 2,09 | 50,43 | 0,3746 | 0,0115 | |||
| EOG / EOG Resources, Inc. | 0,02 | 94,07 | 2,06 | 81,02 | 0,3695 | 0,0718 | |||
| COP / ConocoPhillips | 0,02 | 108,95 | 2,06 | 78,56 | 0,3690 | 0,0676 | |||
| OXY / Occidental Petroleum Corporation | 0,05 | 110,60 | 2,05 | 79,33 | 0,3674 | 0,0685 | |||
| GIS / General Mills, Inc. | 0,04 | 16,29 | 2,02 | 0,80 | 0,3618 | -0,1617 | |||
| PG / The Procter & Gamble Company | 0,01 | 7,51 | 2,01 | 0,50 | 0,3614 | -0,1630 | |||
| KO / The Coca-Cola Company | 0,03 | 2,01 | 2,01 | 0,80 | 0,3609 | -0,1614 | |||
| GE / General Electric Company | 0,01 | 56,29 | 2,01 | 101,00 | 0,3607 | 0,0990 | |||
| MDLZ / Mondelez International, Inc. | 0,03 | -0,06 | 1,99 | -0,65 | 0,3572 | -0,1671 | |||
| MA / Mastercard Incorporated | 0,00 | 34,69 | 1,94 | 38,12 | 0,3472 | -0,0195 | |||
| GEV / GE Vernova Inc. | 0,00 | 11,01 | 1,93 | 92,52 | 0,3464 | 0,0839 | |||
| MFC / Manulife Financial Corporation | 0,06 | 8,28 | 1,82 | 11,08 | 0,3273 | -0,1023 | |||
| TMO / Thermo Fisher Scientific Inc. | 0,00 | 70,45 | 1,81 | 38,85 | 0,3252 | -0,0162 | |||
| EWY / iShares, Inc. - iShares MSCI South Korea ETF | 0,03 | 1,81 | 0,3242 | 0,3242 | |||||
| ARE / Alexandria Real Estate Equities, Inc. | 0,02 | 72,83 | 1,80 | 35,67 | 0,3235 | -0,0242 | |||
| GM / General Motors Company | 0,04 | 30,39 | 1,77 | 36,36 | 0,3177 | -0,0219 | |||
| NFLX / Netflix, Inc. | 0,00 | -6,21 | 1,76 | 34,69 | 0,3156 | -0,0261 | |||
| SNOW / Snowflake Inc. | 0,01 | -6,59 | 1,76 | 43,04 | 0,3154 | -0,0062 | |||
| LNG / Cheniere Energy, Inc. | 0,01 | 43,99 | 1,69 | 51,57 | 0,3027 | 0,0114 | |||
| ETN / Eaton Corporation plc | 0,00 | 60,19 | 1,68 | 110,38 | 0,3020 | 0,0927 | |||
| XME / SPDR Series Trust - SPDR S&P Metals & Mining ETF | 0,02 | 26,42 | 1,65 | 51,71 | 0,2954 | 0,0116 | |||
| EQT / EQT Corporation | 0,03 | 34,85 | 1,65 | 47,14 | 0,2952 | 0,0028 | |||
| PICK / iShares, Inc. - iShares MSCI Global Metals & Mining Producers ETF | 0,04 | 50,42 | 1,55 | 57,58 | 0,2780 | 0,0208 | |||
| URA / Global X Funds - Global X Uranium ETF | 0,04 | -7,75 | 1,55 | 56,26 | 0,2775 | 0,0184 | |||
| FINX / Global X Funds - Global X FinTech ETF | 0,04 | 9,47 | 1,36 | 35,94 | 0,2436 | -0,0177 | |||
| IQV / IQVIA Holdings Inc. | 0,01 | 48,60 | 1,33 | 32,80 | 0,2391 | -0,0234 | |||
| MMM / 3M Company | 0,01 | 10,41 | 1,32 | 14,42 | 0,2364 | -0,0648 | |||
| GLD / SPDR Gold Trust | 0,00 | 39,90 | 1,31 | 48,08 | 0,2354 | 0,0035 | |||
| BXP / Boston Properties, Inc. | 0,02 | 29,83 | 1,30 | 30,46 | 0,2336 | -0,0277 | |||
| AMGN / Amgen Inc. | 0,00 | 12,16 | 1,16 | 0,52 | 0,2073 | -0,0934 | |||
| INDA / iShares Trust - iShares MSCI India ETF | 0,02 | 1,13 | 0,2031 | 0,2031 | |||||
| ADP / Automatic Data Processing, Inc. | 0,00 | 9,77 | 1,11 | 10,87 | 0,1995 | -0,0631 | |||
| HPQ / HP Inc. | 0,04 | 24,13 | 1,09 | 9,66 | 0,1956 | -0,0645 | |||
| CRWD / CrowdStrike Holdings, Inc. | 0,00 | -3,20 | 1,03 | 39,84 | 0,1852 | -0,0079 | |||
| ISRG / Intuitive Surgical, Inc. | 0,00 | 82,19 | 0,98 | 100,00 | 0,1765 | 0,0478 | |||
| KR / The Kroger Co. | 0,01 | 8,99 | 0,98 | 15,52 | 0,1750 | -0,0460 | |||
| IBM / International Business Machines Corporation | 0,00 | -6,57 | 0,95 | 10,76 | 0,1699 | -0,0538 | |||
| NUE / Nucor Corporation | 0,01 | 42,74 | 0,94 | 53,76 | 0,1689 | 0,0086 | |||
| SPGI / S&P Global Inc. | 0,00 | 39,07 | 0,87 | 44,19 | 0,1559 | -0,0016 | |||
| GILD / Gilead Sciences, Inc. | 0,01 | 0,77 | 0,85 | -0,35 | 0,1528 | -0,0707 | |||
| MCO / Moody's Corporation | 0,00 | 29,54 | 0,84 | 39,53 | 0,1507 | -0,0068 | |||
| WOOD / iShares Trust - iShares Global Timber & Forestry ETF | 0,01 | 67,01 | 0,80 | 62,35 | 0,1439 | 0,0147 | |||
| BHP / BHP Group Limited - Depositary Receipt (Common Stock) | 0,02 | 63,20 | 0,80 | 61,82 | 0,1438 | 0,0141 | |||
| FCX / Freeport-McMoRan Inc. | 0,02 | 39,63 | 0,78 | 59,71 | 0,1403 | 0,0123 | |||
| MOO / VanEck ETF Trust - VanEck Agribusiness ETF | 0,01 | 43,65 | 0,78 | 55,89 | 0,1402 | 0,0090 | |||
| ICE / Intercontinental Exchange, Inc. | 0,00 | 21,97 | 0,78 | 29,78 | 0,1400 | -0,0174 | |||
| ADM / Archer-Daniels-Midland Company | 0,01 | 40,11 | 0,78 | 53,97 | 0,1393 | 0,0074 | |||
| CB / Chubb Limited | 0,00 | 32,18 | 0,76 | 26,83 | 0,1366 | -0,0205 | |||
| CG / The Carlyle Group Inc. | 0,01 | 61,81 | 0,76 | 90,66 | 0,1356 | 0,0320 | |||
| BAM / Brookfield Asset Management Ltd. | 0,01 | 68,47 | 0,75 | 92,58 | 0,1351 | 0,0326 | |||
| KKR / KKR & Co. Inc. | 0,01 | 65,15 | 0,75 | 90,08 | 0,1341 | 0,0312 | |||
| ARES / Ares Management Corporation | 0,00 | 55,59 | 0,75 | 83,99 | 0,1341 | 0,0277 | |||
| APO / Apollo Global Management, Inc. | 0,01 | 79,46 | 0,74 | 86,00 | 0,1336 | 0,0288 | |||
| TPG / TPG Inc. | 0,01 | 68,57 | 0,74 | 86,43 | 0,1331 | 0,0290 | |||
| WMT / Walmart Inc. | 0,01 | 23,60 | 0,69 | 37,57 | 0,1243 | -0,0074 | |||
| BWXT / BWX Technologies, Inc. | 0,00 | 4,29 | 0,61 | 52,25 | 0,1093 | 0,0046 | |||
| BEPC / Brookfield Renewable Corporation | 0,02 | 73,72 | 0,51 | 104,02 | 0,0911 | 0,0260 | |||
| BIPC / Brookfield Infrastructure Corporation | 0,01 | 71,99 | 0,50 | 97,63 | 0,0898 | 0,0236 | |||
| PHO / Invesco Exchange-Traded Fund Trust - Invesco Water Resources ETF | 0,01 | 45,56 | 0,40 | 57,94 | 0,0716 | 0,0054 | |||
| ENPH / Enphase Energy, Inc. | 0,00 | -100,00 | 0,00 | 0,0000 | |||||
| BABA / Alibaba Group Holding Limited - Depositary Receipt (Common Stock) | 0,00 | -100,00 | 0,00 | 0,0000 | |||||
| TSLA / Tesla, Inc. | 0,00 | -100,00 | 0,00 | -100,00 | -0,2093 | ||||
| COST / Costco Wholesale Corporation | 0,00 | -100,00 | 0,00 | 0,0000 |