Statistiques de base
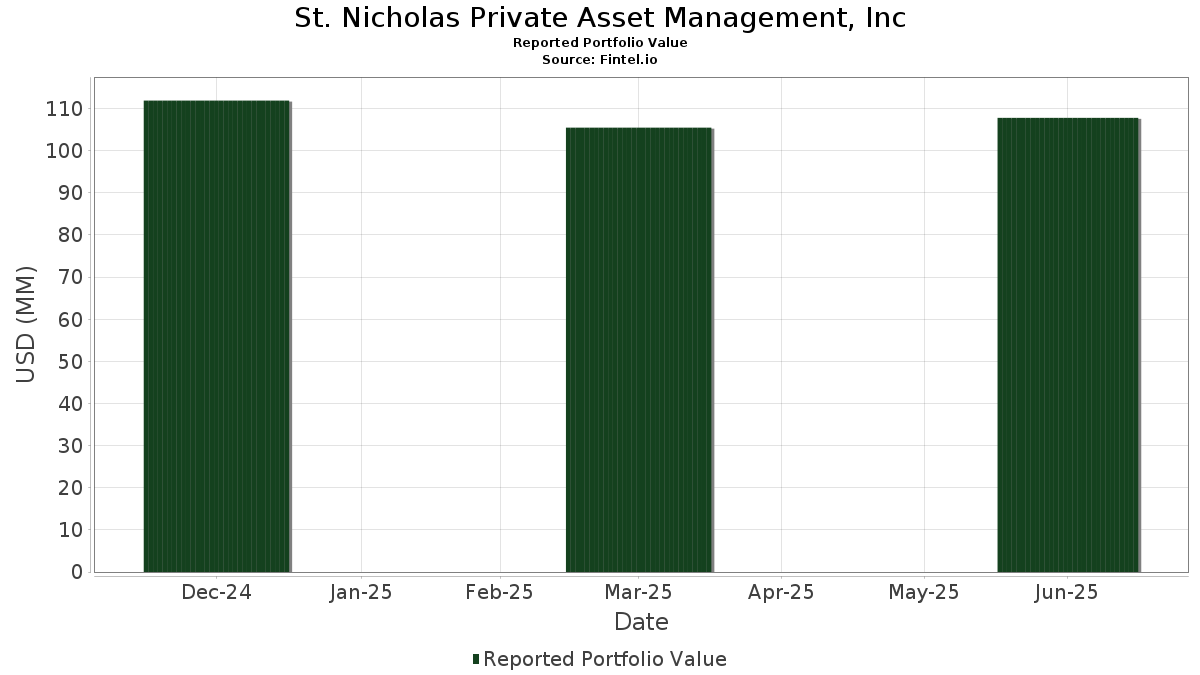
| Valeur du portefeuille | $ 107 806 242 |
| Positions actuelles | 36 |
Dernières positions, performances, ASG (à partir des dépôts 13F, 13D)
St. Nicholas Private Asset Management, Inc a déclaré un total de 36 positions dans ses derniers dépôts auprès de la SEC. La valeur la plus récente du portefeuille est calculée à 107 806 242 USD. Les actifs sous gestion réels (ASG) sont cette valeur plus les liquidités (qui ne sont pas divulguées). Les principales positions de St. Nicholas Private Asset Management, Inc sont Apple Inc. (US:AAPL) , Mastercard Incorporated (US:MA) , RLI Corp. (US:RLI) , AbbVie Inc. (US:ABBV) , and The Home Depot, Inc. (US:HD) .
Meilleures augmentations ce trimestre
Nous utilisons la variation de l'allocation du portefeuille car il s'agit de l'indicateur le plus significatif. Les changements peuvent être dus à des transactions ou à des variations de prix des actions.
| Titre | Actions (en millions) |
Valeur ($ en millions) |
% du portefeuille | ΔPortefeuille % |
|---|---|---|---|---|
| 0,03 | 5,11 | 4,7378 | 1,4494 | |
| 0,01 | 4,48 | 4,1562 | 1,3679 | |
| 0,03 | 5,65 | 5,2388 | 1,0587 | |
| 0,00 | 3,14 | 2,9159 | 0,5400 | |
| 0,01 | 3,37 | 3,1286 | 0,5329 | |
| 0,00 | 1,91 | 1,7678 | 0,4138 | |
| 0,02 | 3,90 | 3,6177 | 0,4077 | |
| 0,01 | 1,96 | 1,8175 | 0,1535 | |
| 0,01 | 1,31 | 1,2161 | 0,1469 | |
| 0,01 | 2,10 | 1,9439 | 0,1417 |
Principales baisses ce trimestre
Nous utilisons la variation de l'allocation du portefeuille car il s'agit de l'indicateur le plus significatif. Les changements peuvent être dus à des transactions ou à des variations de prix des actions.
| Titre | Actions (en millions) |
Valeur ($ en millions) |
% du portefeuille | ΔPortefeuille % |
|---|---|---|---|---|
| 0,06 | 11,55 | 10,7093 | -1,1030 | |
| 0,10 | 7,40 | 6,8651 | -0,9909 | |
| 0,04 | 6,82 | 6,3303 | -0,9117 | |
| 0,02 | 4,69 | 4,3538 | -0,4652 | |
| 0,06 | 2,49 | 2,3120 | -0,2511 | |
| 0,03 | 2,92 | 2,7055 | -0,2131 | |
| 0,01 | 1,66 | 1,5444 | -0,1693 | |
| 0,01 | 1,91 | 1,7734 | -0,1653 | |
| 0,03 | 4,80 | 4,4493 | -0,1577 | |
| 0,02 | 6,11 | 5,6707 | -0,1299 |
Déclarations 13F et dépôts de fonds
Ce formulaire a été déposé le 2025-08-12 pour la période de déclaration 2025-06-30. Cliquez sur l'icône du lien pour voir l'historique complet des transactions.
Mettre à niveau pour débloquer les données premium et exporter vers Excel ![]() .
.
| Titre | Type | Prix moyen de l'action | Actions (en millions) |
ΔActions (%) |
ΔActions (%) |
Valeur ($ en millions) |
Portefeuille (%) |
ΔPortefeuille (%) |
|
|---|---|---|---|---|---|---|---|---|---|
| AAPL / Apple Inc. | 0,06 | 0,32 | 11,55 | -7,34 | 10,7093 | -1,1030 | |||
| MA / Mastercard Incorporated | 0,02 | -1,18 | 9,84 | 1,31 | 9,1281 | -0,0803 | |||
| RLI / RLI Corp. | 0,10 | -0,66 | 7,40 | -10,69 | 6,8651 | -0,9909 | |||
| ABBV / AbbVie Inc. | 0,04 | 0,84 | 6,82 | -10,67 | 6,3303 | -0,9117 | |||
| HD / The Home Depot, Inc. | 0,02 | -0,13 | 6,11 | -0,08 | 5,6707 | -0,1299 | |||
| AMZN / Amazon.com, Inc. | 0,03 | 11,08 | 5,65 | 28,08 | 5,2388 | 1,0587 | |||
| NVDA / NVIDIA Corporation | 0,03 | 1,01 | 5,11 | 47,26 | 4,7378 | 1,4494 | |||
| ODFL / Old Dominion Freight Line, Inc. | 0,03 | 0,62 | 4,80 | -1,30 | 4,4493 | -0,1577 | |||
| MCD / McDonald's Corporation | 0,02 | -1,28 | 4,69 | -7,67 | 4,3538 | -0,4652 | |||
| MSFT / Microsoft Corporation | 0,01 | 14,97 | 4,48 | 52,33 | 4,1562 | 1,3679 | |||
| GOOGL / Alphabet Inc. | 0,02 | 1,07 | 3,90 | 15,21 | 3,6177 | 0,4077 | |||
| VGT / Vanguard World Fund - Vanguard Information Technology ETF | 0,01 | 0,73 | 3,37 | 23,20 | 3,1286 | 0,5329 | |||
| BKNG / Booking Holdings Inc. | 0,00 | -0,18 | 3,14 | 25,42 | 2,9159 | 0,5400 | |||
| ORLY / O'Reilly Automotive, Inc. | 0,03 | 1 405,86 | 2,92 | -5,26 | 2,7055 | -0,2131 | |||
| NSC / Norfolk Southern Corporation | 0,01 | 0,00 | 2,69 | 8,08 | 2,4954 | 0,1355 | |||
| COST / Costco Wholesale Corporation | 0,00 | 3,28 | 2,68 | 8,11 | 2,4866 | 0,1357 | |||
| PEG / Public Service Enterprise Group Incorporated | 0,03 | 0,00 | 2,68 | 2,29 | 2,4823 | 0,0020 | |||
| VZ / Verizon Communications Inc. | 0,06 | -3,36 | 2,49 | -7,81 | 2,3120 | -0,2511 | |||
| RTX / RTX Corporation | 0,01 | 0,00 | 2,10 | 10,21 | 1,9439 | 0,1417 | |||
| PM / Philip Morris International Inc. | 0,01 | -2,71 | 1,96 | 11,62 | 1,8175 | 0,1535 | |||
| PG / The Procter & Gamble Company | 0,01 | 0,00 | 1,91 | -6,55 | 1,7734 | -0,1653 | |||
| META / Meta Platforms, Inc. | 0,00 | 4,20 | 1,91 | 33,40 | 1,7678 | 0,4138 | |||
| JNJ / Johnson & Johnson | 0,01 | 0,00 | 1,66 | -7,91 | 1,5444 | -0,1693 | |||
| WCC / WESCO International, Inc. | 0,01 | -2,52 | 1,31 | 16,33 | 1,2161 | 0,1469 | |||
| XLU / The Select Sector SPDR Trust - The Utilities Select Sector SPDR Fund | 0,01 | 0,00 | 1,16 | 3,57 | 1,0771 | 0,0142 | |||
| SCHX / Schwab Strategic Trust - Schwab U.S. Large-Cap ETF | 0,04 | 0,29 | 1,06 | 11,04 | 0,9802 | 0,0777 | |||
| MIDD / The Middleby Corporation | 0,01 | -3,92 | 1,02 | -8,90 | 0,9500 | -0,1165 | |||
| SHW / The Sherwin-Williams Company | 0,00 | 2,86 | 0,83 | 1,22 | 0,7673 | -0,0080 | |||
| V / Visa Inc. | 0,00 | 0,00 | 0,63 | 1,29 | 0,5846 | -0,0052 | |||
| MRK / Merck & Co., Inc. | 0,01 | -0,02 | 0,42 | -11,81 | 0,3878 | -0,0617 | |||
| SCHW / The Charles Schwab Corporation | 0,00 | 0,00 | 0,30 | 16,54 | 0,2818 | 0,0347 | |||
| MLM / Martin Marietta Materials, Inc. | 0,00 | -0,20 | 0,27 | 14,83 | 0,2515 | 0,0272 | |||
| HON / Honeywell International Inc. | 0,00 | 0,00 | 0,26 | 9,91 | 0,2372 | 0,0168 | |||
| COP / ConocoPhillips | 0,00 | 0,00 | 0,25 | -14,48 | 0,2360 | -0,0463 | |||
| BIV / Vanguard Bond Index Funds - Vanguard Intermediate-Term Bond ETF | 0,00 | -1,35 | 0,22 | 0,00 | 0,2051 | -0,0053 | |||
| MDLZ / Mondelez International, Inc. | 0,00 | 0,00 | 0,21 | -0,47 | 0,1948 | -0,0055 | |||
| DEO / Diageo plc - Depositary Receipt (Common Stock) | 0,00 | -100,00 | 0,00 | 0,0000 | |||||
| SAIA / Saia, Inc. | 0,00 | -100,00 | 0,00 | 0,0000 |