Statistiques de base
| Valeur du portefeuille | $ 109 750 972 |
| Positions actuelles | 98 |
Dernières positions, performances, ASG (à partir des dépôts 13F, 13D)
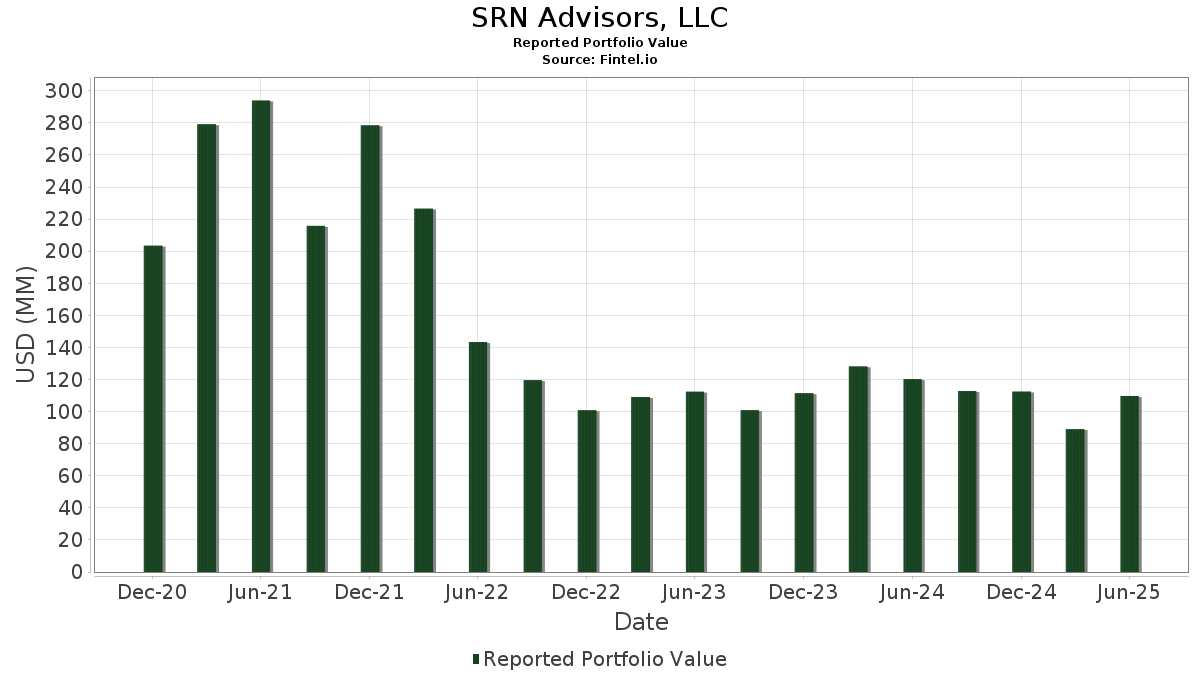
SRN Advisors, LLC a déclaré un total de 98 positions dans ses derniers dépôts auprès de la SEC. La valeur la plus récente du portefeuille est calculée à 109 750 972 USD. Les actifs sous gestion réels (ASG) sont cette valeur plus les liquidités (qui ne sont pas divulguées). Les principales positions de SRN Advisors, LLC sont NVIDIA Corporation (US:NVDA) , Broadcom Inc. (US:AVGO) , Costco Wholesale Corporation (US:COST) , Visa Inc. (US:V) , and Mastercard Incorporated (US:MA) . Les nouvelles positions de SRN Advisors, LLC incluent Bitdeer Technologies Group (DE:R1T) , Circle Internet Group, Inc. (US:CRCL) , Hut 8 Corp. (US:HUT) , .
Meilleures augmentations ce trimestre
Nous utilisons la variation de l'allocation du portefeuille car il s'agit de l'indicateur le plus significatif. Les changements peuvent être dus à des transactions ou à des variations de prix des actions.
| Titre | Actions (en millions) |
Valeur ($ en millions) |
% du portefeuille | ΔPortefeuille % |
|---|---|---|---|---|
| 0,03 | 4,37 | 3,9826 | 2,1818 | |
| 0,18 | 2,04 | 1,8596 | 1,8596 | |
| 0,01 | 2,71 | 2,4649 | 1,6504 | |
| 0,01 | 1,53 | 1,3940 | 1,3940 | |
| 0,43 | 2,04 | 1,8628 | 1,1289 | |
| 0,01 | 2,11 | 1,9202 | 1,0990 | |
| 0,43 | 1,90 | 1,7294 | 1,0790 | |
| 0,06 | 1,10 | 1,0043 | 1,0043 | |
| 0,01 | 3,55 | 3,2329 | 0,9547 | |
| 0,15 | 1,70 | 1,5492 | 0,7281 |
Principales baisses ce trimestre
Nous utilisons la variation de l'allocation du portefeuille car il s'agit de l'indicateur le plus significatif. Les changements peuvent être dus à des transactions ou à des variations de prix des actions.
| Titre | Actions (en millions) |
Valeur ($ en millions) |
% du portefeuille | ΔPortefeuille % |
|---|---|---|---|---|
| 0,00 | 0,91 | 0,8297 | -0,9768 | |
| 0,00 | 1,24 | 1,1257 | -0,9536 | |
| 0,00 | 0,20 | 0,1860 | -0,8691 | |
| 0,00 | 0,33 | 0,3035 | -0,6735 | |
| 0,00 | 1,45 | 1,3256 | -0,6243 | |
| 0,01 | 1,52 | 1,3859 | -0,4710 | |
| 0,03 | 0,70 | 0,6390 | -0,4394 | |
| 0,00 | 0,61 | 0,5578 | -0,4055 | |
| 0,00 | 0,56 | 0,5127 | -0,3787 | |
| 0,01 | 2,82 | 2,5667 | -0,3738 |
Déclarations 13F et dépôts de fonds
Ce formulaire a été déposé le 2025-08-14 pour la période de déclaration 2025-06-30. Cliquez sur l'icône du lien pour voir l'historique complet des transactions.
Mettre à niveau pour débloquer les données premium et exporter vers Excel ![]() .
.
| Titre | Type | Prix moyen de l'action | Actions (en millions) |
ΔActions (%) |
ΔActions (%) |
Valeur ($ en millions) |
Portefeuille (%) |
ΔPortefeuille (%) |
|
|---|---|---|---|---|---|---|---|---|---|
| NVDA / NVIDIA Corporation | 0,03 | 87,00 | 4,37 | 172,61 | 3,9826 | 2,1818 | |||
| AVGO / Broadcom Inc. | 0,01 | 6,24 | 3,55 | 74,95 | 3,2329 | 0,9547 | |||
| COST / Costco Wholesale Corporation | 0,00 | 4,94 | 3,11 | 9,85 | 2,8349 | -0,3462 | |||
| V / Visa Inc. | 0,01 | 6,20 | 2,82 | 7,56 | 2,5667 | -0,3738 | |||
| MA / Mastercard Incorporated | 0,00 | 7,73 | 2,71 | 10,43 | 2,4700 | -0,2865 | |||
| PWR / Quanta Services, Inc. | 0,01 | 150,86 | 2,71 | 273,10 | 2,4649 | 1,6504 | |||
| HOOD / Robinhood Markets, Inc. | 0,02 | -29,06 | 2,23 | 59,63 | 2,0325 | 0,4627 | |||
| KLAC / KLA Corporation | 0,00 | 3,86 | 2,15 | 36,93 | 1,9563 | 0,1943 | |||
| TSM / Taiwan Semiconductor Manufacturing Company Limited - Depositary Receipt (Common Stock) | 0,01 | 111,24 | 2,11 | 188,24 | 1,9202 | 1,0990 | |||
| MSFT / Microsoft Corporation | 0,00 | -13,83 | 2,05 | 14,21 | 1,8673 | -0,1483 | |||
| CIFR / Cipher Mining Inc. | 0,43 | 50,53 | 2,04 | 213,02 | 1,8628 | 1,1289 | |||
| R1T / Bitdeer Technologies Group | 0,18 | 2,04 | 1,8596 | 1,8596 | |||||
| WULF / TeraWulf Inc. | 0,43 | 104,26 | 1,90 | 227,81 | 1,7294 | 1,0790 | |||
| GRMN / Garmin Ltd. | 0,01 | 98,91 | 1,82 | 91,18 | 1,6591 | 0,5896 | |||
| CTAS / Cintas Corporation | 0,01 | 6,25 | 1,80 | 15,20 | 1,6440 | -0,1148 | |||
| CORZ / Core Scientific, Inc. | 0,10 | -47,90 | 1,75 | 22,84 | 1,5936 | -0,0055 | |||
| VRSK / Verisk Analytics, Inc. | 0,01 | 3,67 | 1,71 | 8,52 | 1,5551 | -0,2114 | |||
| RIOT / Riot Platforms, Inc. | 0,15 | 46,53 | 1,70 | 132,56 | 1,5492 | 0,7281 | |||
| GWW / W.W. Grainger, Inc. | 0,00 | 4,11 | 1,69 | 9,62 | 1,5364 | -0,1909 | |||
| CRCL / Circle Internet Group, Inc. | 0,01 | 1,53 | 1,3940 | 1,3940 | |||||
| HUBB / Hubbell Incorporated | 0,00 | 6,21 | 1,52 | 31,09 | 1,3869 | 0,0829 | |||
| ACN / Accenture plc | 0,01 | -3,96 | 1,52 | -7,99 | 1,3859 | -0,4710 | |||
| MSCI / MSCI Inc. | 0,00 | 3,56 | 1,46 | 5,58 | 1,3285 | -0,2218 | |||
| MSTR / Strategy Inc | 0,00 | -40,25 | 1,45 | -16,24 | 1,3256 | -0,6243 | |||
| MPWR / Monolithic Power Systems, Inc. | 0,00 | 6,20 | 1,43 | 33,96 | 1,3015 | 0,1037 | |||
| XYZ / Block, Inc. | 0,02 | 21,82 | 1,41 | 52,32 | 1,2843 | 0,2450 | |||
| QCOM / QUALCOMM Incorporated | 0,01 | 53,05 | 1,29 | 58,69 | 1,1731 | 0,2619 | |||
| COIN / Coinbase Global, Inc. | 0,00 | -67,21 | 1,24 | -33,28 | 1,1257 | -0,9536 | |||
| INTU / Intuit Inc. | 0,00 | 1,98 | 1,21 | 30,82 | 1,1066 | 0,0640 | |||
| ETN / Eaton Corporation plc | 0,00 | 4,17 | 1,19 | 36,77 | 1,0887 | 0,1078 | |||
| APH / Amphenol Corporation | 0,01 | 3,35 | 1,19 | 55,69 | 1,0857 | 0,2257 | |||
| CUBI / Customers Bancorp, Inc. | 0,02 | 22,89 | 1,19 | 43,81 | 1,0803 | 0,1543 | |||
| MARA / MARA Holdings, Inc. | 0,07 | 3,95 | 1,16 | 41,74 | 1,0558 | 0,1377 | |||
| HUT / Hut 8 Corp. | 0,06 | 1,10 | 1,0043 | 1,0043 | |||||
| LRCX / Lam Research Corporation | 0,01 | 4,38 | 1,10 | 39,85 | 0,9979 | 0,1178 | |||
| ECL / Ecolab Inc. | 0,00 | 1,87 | 1,07 | 8,30 | 0,9756 | -0,1351 | |||
| GL / Globe Life Inc. | 0,01 | 3,65 | 1,03 | -2,19 | 0,9362 | -0,2437 | |||
| PHM / PulteGroup, Inc. | 0,01 | 3,00 | 1,00 | 5,70 | 0,9124 | -0,1518 | |||
| FAST / Fastenal Company | 0,02 | 111,22 | 1,00 | 14,42 | 0,9118 | -0,0706 | |||
| CB / Chubb Limited | 0,00 | 2,21 | 0,99 | -1,97 | 0,9054 | -0,2327 | |||
| CMI / Cummins Inc. | 0,00 | 6,24 | 0,99 | 10,96 | 0,9045 | -0,0998 | |||
| ODFL / Old Dominion Freight Line, Inc. | 0,01 | 4,28 | 0,98 | 2,29 | 0,8945 | -0,1833 | |||
| MCO / Moody's Corporation | 0,00 | 2,72 | 0,97 | 10,67 | 0,8793 | -0,1002 | |||
| EXPD / Expeditors International of Washington, Inc. | 0,01 | 1,97 | 0,95 | -3,17 | 0,8636 | -0,2351 | |||
| IBM / International Business Machines Corporation | 0,00 | -52,25 | 0,91 | -43,41 | 0,8297 | -0,9768 | |||
| MSI / Motorola Solutions, Inc. | 0,00 | 6,23 | 0,90 | 1,92 | 0,8237 | -0,1715 | |||
| TXN / Texas Instruments Incorporated | 0,00 | 141,22 | 0,90 | 178,95 | 0,8214 | 0,4581 | |||
| HIG / The Hartford Insurance Group, Inc. | 0,01 | 4,69 | 0,88 | 7,34 | 0,7992 | -0,1184 | |||
| BR / Broadridge Financial Solutions, Inc. | 0,00 | 6,25 | 0,86 | 6,44 | 0,7834 | -0,1233 | |||
| SHW / The Sherwin-Williams Company | 0,00 | 2,31 | 0,85 | 0,59 | 0,7746 | -0,1744 | |||
| LLY / Eli Lilly and Company | 0,00 | 1,60 | 0,84 | -4,10 | 0,7664 | -0,2187 | |||
| CTSH / Cognizant Technology Solutions Corporation | 0,01 | 3,87 | 0,84 | 5,93 | 0,7647 | -0,1249 | |||
| AMAT / Applied Materials, Inc. | 0,00 | 6,09 | 0,83 | 33,87 | 0,7531 | 0,0595 | |||
| SAP / SAP SE - Depositary Receipt (Common Stock) | 0,00 | -22,23 | 0,83 | -11,95 | 0,7523 | -0,3002 | |||
| PNR / Pentair plc | 0,01 | 3,86 | 0,82 | 21,94 | 0,7451 | -0,0084 | |||
| CME / CME Group Inc. | 0,00 | 6,23 | 0,82 | 10,41 | 0,7451 | -0,0870 | |||
| J / Jacobs Solutions Inc. | 0,01 | 3,85 | 0,81 | 12,90 | 0,7423 | -0,0679 | |||
| HON / Honeywell International Inc. | 0,00 | 6,20 | 0,81 | 16,81 | 0,7414 | -0,0410 | |||
| LIN / Linde plc | 0,00 | 6,18 | 0,81 | 7,05 | 0,7340 | -0,1116 | |||
| ITW / Illinois Tool Works Inc. | 0,00 | 3,47 | 0,80 | 3,08 | 0,7324 | -0,1427 | |||
| GS / The Goldman Sachs Group, Inc. | 0,00 | -9,06 | 0,80 | 17,78 | 0,7248 | -0,0335 | |||
| MMC / Marsh & McLennan Companies, Inc. | 0,00 | 6,28 | 0,77 | -4,85 | 0,6976 | -0,2054 | |||
| ERIE / Erie Indemnity Company | 0,00 | 3,09 | 0,76 | -14,75 | 0,6961 | -0,3096 | |||
| KMB / Kimberly-Clark Corporation | 0,01 | 5,18 | 0,76 | -4,66 | 0,6898 | -0,2020 | |||
| NKE / NIKE, Inc. | 0,01 | 4,54 | 0,75 | 16,98 | 0,6848 | -0,0367 | |||
| MPC / Marathon Petroleum Corporation | 0,00 | 6,24 | 0,74 | 21,28 | 0,6752 | -0,0118 | |||
| CHD / Church & Dwight Co., Inc. | 0,01 | 5,51 | 0,74 | -7,97 | 0,6741 | -0,2279 | |||
| CINF / Cincinnati Financial Corporation | 0,00 | 5,85 | 0,74 | 6,68 | 0,6702 | -0,1039 | |||
| PG / The Procter & Gamble Company | 0,00 | 6,24 | 0,73 | -0,68 | 0,6624 | -0,1596 | |||
| NDAQ / Nasdaq, Inc. | 0,01 | -12,78 | 0,72 | 2,87 | 0,6547 | -0,1302 | |||
| BLK / BlackRock, Inc. | 0,00 | -8,59 | 0,71 | 1,28 | 0,6511 | -0,1408 | |||
| AME / AMETEK, Inc. | 0,00 | 6,11 | 0,71 | 11,42 | 0,6496 | -0,0682 | |||
| AOS / A. O. Smith Corporation | 0,01 | 5,90 | 0,71 | 6,31 | 0,6457 | -0,1034 | |||
| HPE / Hewlett Packard Enterprise Company | 0,03 | -44,89 | 0,70 | -26,98 | 0,6390 | -0,4394 | |||
| MU / Micron Technology, Inc. | 0,01 | -28,03 | 0,70 | 2,04 | 0,6374 | -0,1322 | |||
| DHI / D.R. Horton, Inc. | 0,01 | 5,23 | 0,68 | 6,79 | 0,6165 | -0,0955 | |||
| CLSK / CleanSpark, Inc. | 0,06 | -48,56 | 0,68 | -15,52 | 0,6151 | -0,2829 | |||
| AAPL / Apple Inc. | 0,00 | 5,86 | 0,66 | -2,21 | 0,6044 | -0,1575 | |||
| A / Agilent Technologies, Inc. | 0,01 | 5,63 | 0,66 | 6,60 | 0,6037 | -0,0945 | |||
| MRK / Merck & Co., Inc. | 0,01 | 4,08 | 0,66 | -8,09 | 0,6005 | -0,2059 | |||
| PYPL / PayPal Holdings, Inc. | 0,01 | -29,25 | 0,64 | -19,42 | 0,5792 | -0,3067 | |||
| CSCO / Cisco Systems, Inc. | 0,01 | -32,43 | 0,62 | -24,05 | 0,5643 | -0,3512 | |||
| ORCL / Oracle Corporation | 0,00 | -54,36 | 0,61 | -28,59 | 0,5578 | -0,4055 | |||
| AMD / Advanced Micro Devices, Inc. | 0,00 | -14,56 | 0,61 | 18,09 | 0,5531 | -0,0246 | |||
| AXP / American Express Company | 0,00 | -40,20 | 0,56 | -29,13 | 0,5127 | -0,3787 | |||
| BK / The Bank of New York Mellon Corporation | 0,01 | -9,03 | 0,55 | -1,26 | 0,5018 | -0,1241 | |||
| NU / Nu Holdings Ltd. | 0,04 | -44,80 | 0,51 | -26,12 | 0,4646 | -0,3097 | |||
| BIDU / Baidu, Inc. - Depositary Receipt (Common Stock) | 0,01 | 33,30 | 0,51 | 24,51 | 0,4629 | 0,0036 | |||
| BFB / Brown-Forman Corp. - Class B | 0,02 | 5,90 | 0,45 | -16,01 | 0,4111 | -0,1924 | |||
| BABA / Alibaba Group Holding Limited - Depositary Receipt (Common Stock) | 0,00 | 83,55 | 0,42 | 57,25 | 0,3862 | 0,0838 | |||
| JD / JD.com, Inc. - Depositary Receipt (Common Stock) | 0,01 | 53,21 | 0,38 | 21,61 | 0,3440 | -0,0046 | |||
| IREN / IREN Limited | 0,03 | -73,40 | 0,37 | -36,35 | 0,3337 | -0,3125 | |||
| WMT / Walmart Inc. | 0,00 | -65,62 | 0,33 | -61,68 | 0,3035 | -0,6735 | |||
| RMD / ResMed Inc. | 0,00 | -10,85 | 0,23 | 2,73 | 0,2066 | -0,0412 | |||
| SBAC / SBA Communications Corporation | 0,00 | -10,83 | 0,22 | -4,68 | 0,2043 | -0,0603 | |||
| SPGI / S&P Global Inc. | 0,00 | -10,68 | 0,22 | -7,17 | 0,2008 | -0,0662 | |||
| TRV / The Travelers Companies, Inc. | 0,00 | -10,85 | 0,22 | -9,88 | 0,2004 | -0,0735 | |||
| JPM / JPMorgan Chase & Co. | 0,00 | -81,62 | 0,20 | -78,27 | 0,1860 | -0,8691 | |||
| TPL / Texas Pacific Land Corporation | 0,00 | -100,00 | 0,00 | 0,0000 | |||||
| TMO / Thermo Fisher Scientific Inc. | 0,00 | -100,00 | 0,00 | 0,0000 | |||||
| DOV / Dover Corporation | 0,00 | -100,00 | 0,00 | 0,0000 | |||||
| ZTS / Zoetis Inc. | 0,00 | -100,00 | 0,00 | 0,0000 |