Statistiques de base
| Valeur du portefeuille | $ 77 501 000 |
| Positions actuelles | 56 |
Dernières positions, performances, ASG (à partir des dépôts 13F, 13D)
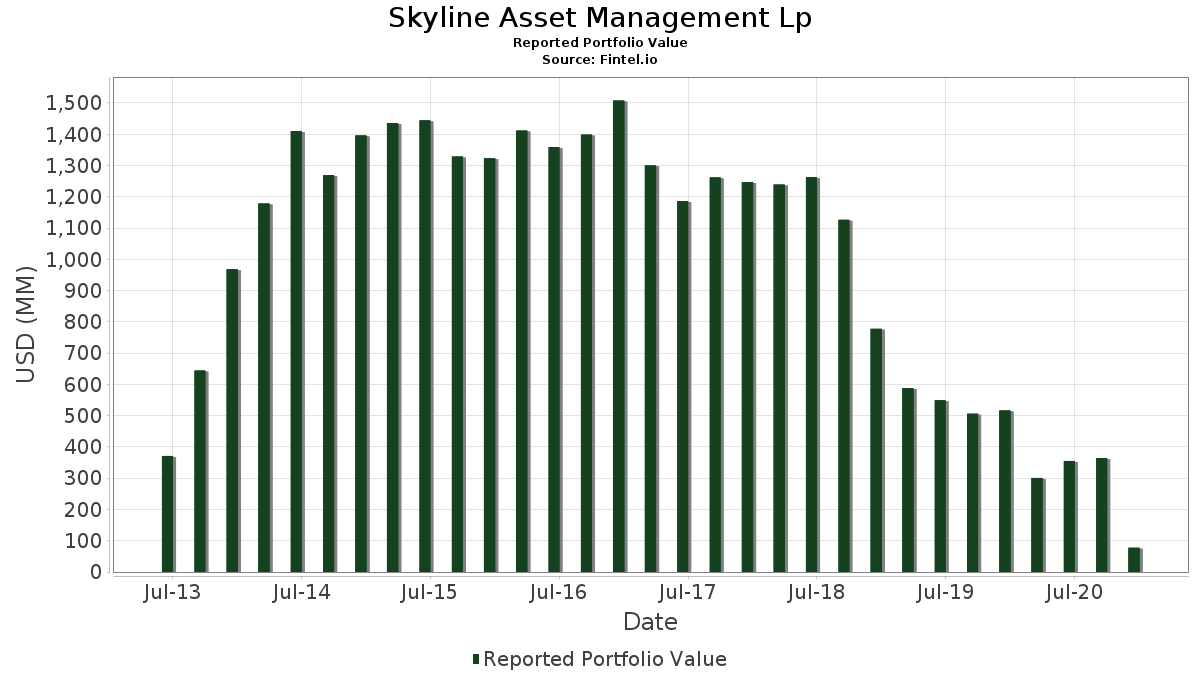
Skyline Asset Management Lp a déclaré un total de 56 positions dans ses derniers dépôts auprès de la SEC. La valeur la plus récente du portefeuille est calculée à 77 501 000 USD. Les actifs sous gestion réels (ASG) sont cette valeur plus les liquidités (qui ne sont pas divulguées). Les principales positions de Skyline Asset Management Lp sont Welbilt Inc (US:WBT) , The Children's Place, Inc. (US:PLCE) , Hillenbrand, Inc. (US:HI) , WSFS Financial Corporation (US:WSFS) , and BMC Stock Holdings, Inc. (US:) . Les nouvelles positions de Skyline Asset Management Lp incluent Bed Bath & Beyond, Inc. (US:BBBY) , Bloomin' Brands, Inc. (US:BLMN) , Masonite International Corporation (US:DOOR) , PROG Holdings, Inc. (US:PRG) , and .
Meilleures augmentations ce trimestre
Nous utilisons la variation de l'allocation du portefeuille car il s'agit de l'indicateur le plus significatif. Les changements peuvent être dus à des transactions ou à des variations de prix des actions.
| Titre | Actions (en millions) |
Valeur ($ en millions) |
% du portefeuille | ΔPortefeuille % |
|---|---|---|---|---|
| 0,03 | 1,30 | 1,6748 | 1,6748 | |
| 0,07 | 1,30 | 1,6722 | 1,6722 | |
| 0,06 | 1,25 | 1,6064 | 1,6064 | |
| 0,02 | 0,97 | 1,2503 | 1,2503 | |
| 0,01 | 0,90 | 1,1548 | 1,1548 | |
| 0,04 | 1,93 | 2,4955 | 1,0364 | |
| 0,01 | 0,68 | 0,8826 | 0,8826 | |
| 0,16 | 2,07 | 2,6658 | 0,8566 | |
| 0,09 | 1,67 | 2,1548 | 0,5456 | |
| 0,04 | 1,89 | 2,4322 | 0,5237 |
Principales baisses ce trimestre
Nous utilisons la variation de l'allocation du portefeuille car il s'agit de l'indicateur le plus significatif. Les changements peuvent être dus à des transactions ou à des variations de prix des actions.
| Titre | Actions (en millions) |
Valeur ($ en millions) |
% du portefeuille | ΔPortefeuille % |
|---|---|---|---|---|
| 0,00 | 0,00 | -2,1376 | ||
| 0,00 | 0,00 | -1,2739 | ||
| 0,00 | 0,00 | -1,1531 | ||
| 0,00 | 0,00 | -0,7590 | ||
| 0,05 | 1,29 | 1,6658 | -0,6371 | |
| 0,02 | 1,25 | 1,6090 | -0,4852 | |
| 0,03 | 1,82 | 2,3548 | -0,4775 | |
| 0,05 | 1,24 | 1,6038 | -0,4511 | |
| 0,03 | 1,44 | 1,8632 | -0,3996 | |
| 0,03 | 1,38 | 1,7845 | -0,3451 |
Déclarations 13F et dépôts de fonds
Ce formulaire a été déposé le 2021-01-26 pour la période de déclaration 2020-12-31. Cliquez sur l'icône du lien pour voir l'historique complet des transactions.
Mettre à niveau pour débloquer les données premium et exporter vers Excel ![]() .
.
| Titre | Type | Prix moyen de l'action | Actions (en millions) |
ΔActions (%) |
ΔActions (%) |
Valeur ($ en millions) |
Portefeuille (%) |
ΔPortefeuille (%) |
|
|---|---|---|---|---|---|---|---|---|---|
| WBT / Welbilt Inc | 0,16 | -85,37 | 2,07 | -68,64 | 2,6658 | 0,8566 | |||
| PLCE / The Children's Place, Inc. | 0,04 | -79,40 | 1,93 | -63,60 | 2,4955 | 1,0364 | |||
| HI / Hillenbrand, Inc. | 0,05 | -83,48 | 1,89 | -76,81 | 2,4348 | 0,2006 | |||
| WSFS / WSFS Financial Corporation | 0,04 | -83,70 | 1,89 | -72,88 | 2,4322 | 0,5237 | |||
| / BMC Stock Holdings, Inc. | 0,03 | -85,88 | 1,82 | -82,31 | 2,3548 | -0,4775 | |||
| OEC / Orion S.A. | 0,10 | -83,49 | 1,78 | -77,38 | 2,2916 | 0,1356 | |||
| DIN / Dine Brands Global, Inc. | 0,03 | -81,30 | 1,77 | -80,13 | 2,2903 | -0,1622 | |||
| ACHC / Acadia Healthcare Company, Inc. | 0,03 | -85,49 | 1,68 | -75,26 | 2,1664 | 0,3029 | |||
| STL / Sterling Bancorp. | 0,09 | -83,32 | 1,67 | -71,50 | 2,1548 | 0,5456 | |||
| ESNT / Essent Group Ltd. | 0,04 | -84,24 | 1,61 | -81,61 | 2,0787 | -0,3274 | |||
| US7846351044 / SPX Corp | 0,03 | -83,81 | 1,59 | -80,96 | 2,0555 | -0,2422 | |||
| BUSE / First Busey Corporation | 0,07 | -83,26 | 1,57 | -77,30 | 2,0245 | 0,1267 | |||
| TRS / TriMas Corporation | 0,05 | -83,66 | 1,57 | -77,30 | 2,0232 | 0,1267 | |||
| FOCS / Focus Financial Partners Inc - Class A | 0,04 | -83,42 | 1,55 | -78,00 | 1,9987 | 0,0654 | |||
| BXS / BancorpSouth Bank | 0,06 | -83,23 | 1,54 | -76,26 | 1,9897 | 0,2058 | |||
| UMPQ / Umpqua Holdings Corp | 0,10 | -83,35 | 1,53 | -76,26 | 1,9780 | 0,2046 | |||
| UMBF / UMB Financial Corporation | 0,02 | -83,42 | 1,48 | -76,67 | 1,9135 | 0,1678 | |||
| MAN / ManpowerGroup Inc. | 0,02 | -81,88 | 1,48 | -77,71 | 1,9084 | 0,0861 | |||
| SANM / Sanmina Corporation | 0,05 | -84,16 | 1,48 | -81,31 | 1,9058 | -0,2647 | |||
| KN / Knowles Corporation | 0,08 | -84,24 | 1,47 | -80,51 | 1,8929 | -0,1738 | |||
| LCII / LCI Industries | 0,01 | -83,50 | 1,45 | -79,87 | 1,8735 | -0,1075 | |||
| MTX / Minerals Technologies Inc. | 0,02 | -84,05 | 1,45 | -80,62 | 1,8671 | -0,1832 | |||
| PRFT / Perficient, Inc. | 0,03 | -84,28 | 1,44 | -82,48 | 1,8632 | -0,3996 | |||
| KLIC / Kulicke and Soffa Industries, Inc. | 0,04 | -83,49 | 1,43 | -76,56 | 1,8426 | 0,1699 | |||
| KFY / Korn Ferry | 0,03 | -81,57 | 1,42 | -72,36 | 1,8348 | 0,4219 | |||
| RGA / Reinsurance Group of America, Incorporated | 0,01 | -84,03 | 1,40 | -80,55 | 1,8090 | -0,1709 | |||
| NBHC / National Bank Holdings Corporation | 0,04 | -83,27 | 1,40 | -79,13 | 1,8051 | -0,0353 | |||
| BC / Brunswick Corporation | 0,02 | -83,96 | 1,40 | -79,25 | 1,8000 | -0,0460 | |||
| TTMI / TTM Technologies, Inc. | 0,10 | -84,18 | 1,38 | -80,87 | 1,7858 | -0,2005 | |||
| BECN / Beacon Roofing Supply, Inc. | 0,03 | -86,22 | 1,38 | -82,17 | 1,7845 | -0,3451 | |||
| FOE / Ferro Corp. | 0,09 | -84,24 | 1,38 | -81,41 | 1,7780 | -0,2579 | |||
| ROCK / Gibraltar Industries, Inc. | 0,02 | -83,39 | 1,37 | -81,66 | 1,7729 | -0,2842 | |||
| RXN / Rexnord Corp | 0,03 | -83,90 | 1,35 | -78,69 | 1,7380 | 0,0022 | |||
| AMWD / American Woodmark Corporation | 0,01 | -84,32 | 1,34 | -81,26 | 1,7316 | -0,2354 | |||
| KMPR / Kemper Corporation | 0,02 | -84,20 | 1,31 | -81,83 | 1,6903 | -0,2899 | |||
| WGO / Winnebago Industries, Inc. | 0,02 | -81,05 | 1,30 | -78,01 | 1,6787 | 0,0541 | |||
| JRVR / James River Group Holdings, Ltd. | 0,03 | -31,07 | 1,30 | -23,87 | 1,6748 | 1,6748 | |||
| BBBY / Bed Bath & Beyond, Inc. | 0,07 | 1,30 | 1,6722 | 1,6722 | |||||
| SHYF / The Shyft Group, Inc. | 0,05 | -89,76 | 1,29 | -84,61 | 1,6658 | -0,6371 | |||
| NCR / NCR Corp. | 0,03 | -83,81 | 1,27 | -72,52 | 1,6438 | 0,3708 | |||
| CMP / Compass Minerals International, Inc. | 0,02 | -84,28 | 1,25 | -83,65 | 1,6090 | -0,4852 | |||
| BLMN / Bloomin' Brands, Inc. | 0,06 | 1,25 | 1,6064 | 1,6064 | |||||
| JELD / JELD-WEN Holding, Inc. | 0,05 | -85,20 | 1,24 | -83,39 | 1,6038 | -0,4511 | |||
| BHE / Benchmark Electronics, Inc. | 0,04 | -84,18 | 1,21 | -78,80 | 1,5626 | -0,0063 | |||
| FMBI / First Midwest Bancorp, Inc. | 0,08 | -84,15 | 1,21 | -76,58 | 1,5600 | 0,1422 | |||
| SIMO / Silicon Motion Technology Corporation - Depositary Receipt (Common Stock) | 0,02 | -83,89 | 1,17 | -79,46 | 1,5097 | -0,0548 | |||
| TPIC / TPI Composites, Inc. | 0,02 | -90,38 | 1,12 | -82,47 | 1,4503 | -0,3105 | |||
| CMCO / Columbus McKinnon Corporation | 0,03 | -84,43 | 1,12 | -81,93 | 1,4477 | -0,2571 | |||
| R / Ryder System, Inc. | 0,02 | -84,11 | 1,10 | -76,77 | 1,4180 | 0,1189 | |||
| WNS / WNS (Holdings) Limited | 0,02 | -84,03 | 1,09 | -82,02 | 1,4129 | -0,2592 | |||
| NPO / Enpro Inc. | 0,01 | -84,39 | 1,08 | -79,10 | 1,3935 | -0,0254 | |||
| THS / TreeHouse Foods, Inc. | 0,02 | -79,27 | 0,97 | -78,26 | 1,2503 | 1,2503 | |||
| DOOR / Masonite International Corporation | 0,01 | 0,90 | 1,1548 | 1,1548 | |||||
| AMN / AMN Healthcare Services, Inc. | 0,01 | -83,84 | 0,87 | -81,14 | 1,1187 | -0,1434 | |||
| PRG / PROG Holdings, Inc. | 0,01 | 0,68 | 0,8826 | 0,8826 | |||||
| PBH / Prestige Consumer Healthcare Inc. | 0,01 | -84,05 | 0,51 | -84,72 | 0,6529 | -0,2563 | |||
| AAN / The Aaron's Company, Inc. | 0,00 | -100,00 | 0,00 | -100,00 | -2,1376 | ||||
| VREX / Varex Imaging Corporation | 0,00 | -100,00 | 0,00 | -100,00 | -0,7590 | ||||
| NP / Neenah Inc | 0,00 | -100,00 | 0,00 | -100,00 | -1,2739 | ||||
| US4989042001 / Knoll Inc | 0,00 | -100,00 | 0,00 | -100,00 | -1,1531 |