Statistiques de base
| Valeur du portefeuille | $ 194 753 441 |
| Positions actuelles | 67 |
Dernières positions, performances, ASG (à partir des dépôts 13F, 13D)
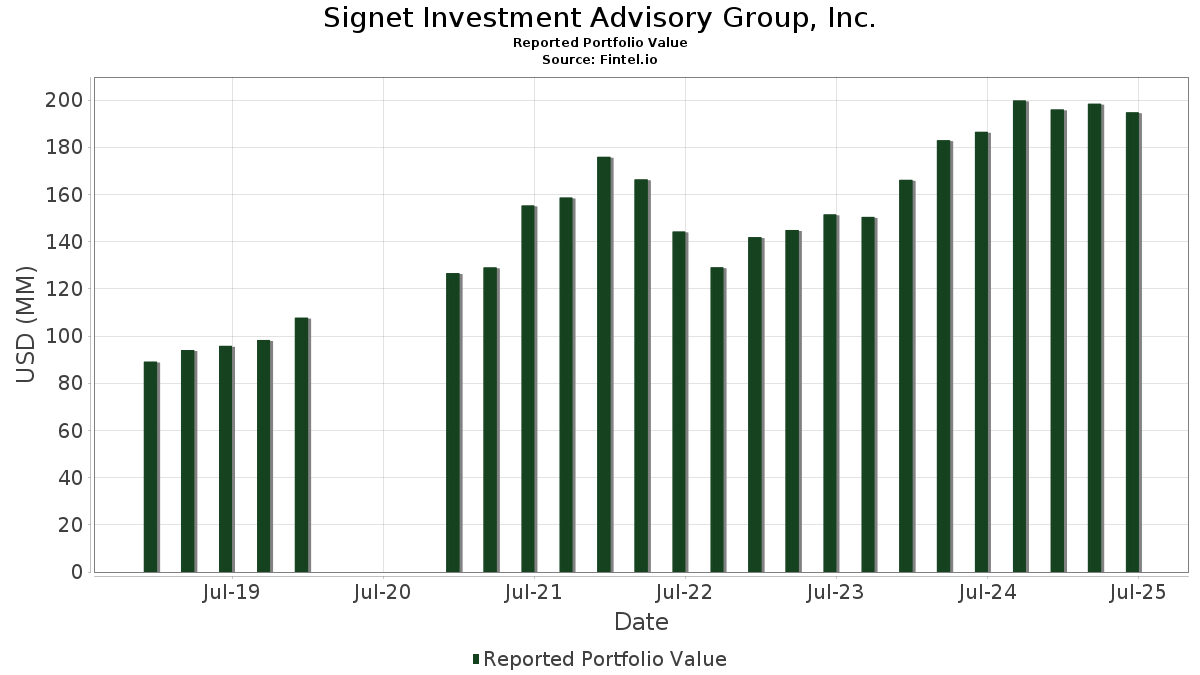
Signet Investment Advisory Group, Inc. a déclaré un total de 67 positions dans ses derniers dépôts auprès de la SEC. La valeur la plus récente du portefeuille est calculée à 194 753 441 USD. Les actifs sous gestion réels (ASG) sont cette valeur plus les liquidités (qui ne sont pas divulguées). Les principales positions de Signet Investment Advisory Group, Inc. sont Schwab Strategic Trust - Schwab International Equity ETF (US:SCHF) , iShares Gold Trust (US:IAU) , Microsoft Corporation (US:MSFT) , Schwab Strategic Trust - Schwab U.S. TIPS ETF (US:SCHP) , and JPMorgan Chase & Co. (US:JPM) . Les nouvelles positions de Signet Investment Advisory Group, Inc. incluent GE Vernova Inc. (US:GEV) , .
Meilleures augmentations ce trimestre
Nous utilisons la variation de l'allocation du portefeuille car il s'agit de l'indicateur le plus significatif. Les changements peuvent être dus à des transactions ou à des variations de prix des actions.
| Titre | Actions (en millions) |
Valeur ($ en millions) |
% du portefeuille | ΔPortefeuille % |
|---|---|---|---|---|
| 0,02 | 8,77 | 4,5033 | 1,1649 | |
| 0,02 | 4,54 | 2,3303 | 0,8552 | |
| 0,52 | 11,47 | 5,8871 | 0,7385 | |
| 0,02 | 6,76 | 3,4725 | 0,5758 | |
| 0,02 | 3,74 | 1,9184 | 0,3726 | |
| 0,08 | 5,60 | 2,8736 | 0,3602 | |
| 0,15 | 4,79 | 2,4586 | 0,3486 | |
| 0,02 | 3,48 | 1,7848 | 0,3314 | |
| 0,02 | 5,80 | 2,9768 | 0,2979 | |
| 0,01 | 2,05 | 1,0551 | 0,2754 |
Principales baisses ce trimestre
Nous utilisons la variation de l'allocation du portefeuille car il s'agit de l'indicateur le plus significatif. Les changements peuvent être dus à des transactions ou à des variations de prix des actions.
| Titre | Actions (en millions) |
Valeur ($ en millions) |
% du portefeuille | ΔPortefeuille % |
|---|---|---|---|---|
| 0,18 | 11,01 | 5,6517 | -1,4360 | |
| 0,01 | 2,32 | 1,1931 | -0,7296 | |
| 0,01 | 6,30 | 3,2323 | -0,2727 | |
| 0,03 | 6,48 | 3,3258 | -0,2463 | |
| 0,02 | 2,16 | 1,1085 | -0,1622 | |
| 0,02 | 2,09 | 1,0710 | -0,1406 | |
| 0,03 | 4,42 | 2,2684 | -0,1349 | |
| 0,07 | 6,61 | 3,3945 | -0,1272 | |
| 0,02 | 2,89 | 1,4819 | -0,1161 | |
| 0,01 | 1,71 | 0,8777 | -0,0931 |
Déclarations 13F et dépôts de fonds
Ce formulaire a été déposé le 2025-08-01 pour la période de déclaration 2025-06-30. Cliquez sur l'icône du lien pour voir l'historique complet des transactions.
Mettre à niveau pour débloquer les données premium et exporter vers Excel ![]() .
.
| Titre | Type | Prix moyen de l'action | Actions (en millions) |
ΔActions (%) |
ΔActions (%) |
Valeur ($ en millions) |
Portefeuille (%) |
ΔPortefeuille (%) |
|
|---|---|---|---|---|---|---|---|---|---|
| SCHF / Schwab Strategic Trust - Schwab International Equity ETF | 0,52 | 0,46 | 11,47 | 12,25 | 5,8871 | 0,7385 | |||
| IAU / iShares Gold Trust | 0,18 | -25,99 | 11,01 | -21,73 | 5,6517 | -1,4360 | |||
| MSFT / Microsoft Corporation | 0,02 | -0,07 | 8,77 | 32,42 | 4,5033 | 1,1649 | |||
| SCHP / Schwab Strategic Trust - Schwab U.S. TIPS ETF | 0,33 | 0,30 | 8,76 | -0,48 | 4,4955 | 0,0613 | |||
| JPM / JPMorgan Chase & Co. | 0,02 | -0,43 | 6,76 | 17,68 | 3,4725 | 0,5758 | |||
| WMT / Walmart Inc. | 0,07 | -15,05 | 6,61 | -5,40 | 3,3945 | -0,1272 | |||
| AAPL / Apple Inc. | 0,03 | -1,05 | 6,48 | -8,59 | 3,3258 | -0,2463 | |||
| BRK.B / Berkshire Hathaway Inc. | 0,01 | -0,75 | 6,30 | -9,46 | 3,2323 | -0,2727 | |||
| V / Visa Inc. | 0,02 | -0,57 | 5,86 | 0,72 | 3,0108 | 0,0767 | |||
| HON / Honeywell International Inc. | 0,02 | -0,82 | 5,80 | 9,09 | 2,9768 | 0,2979 | |||
| CSCO / Cisco Systems, Inc. | 0,08 | -0,18 | 5,60 | 12,23 | 2,8736 | 0,3602 | |||
| ACN / Accenture plc | 0,02 | 1,77 | 5,17 | -2,51 | 2,6538 | -0,0185 | |||
| CSX / CSX Corporation | 0,15 | 3,20 | 4,79 | 14,38 | 2,4586 | 0,3486 | |||
| WM / Waste Management, Inc. | 0,02 | -0,70 | 4,57 | -1,87 | 2,3466 | -0,0004 | |||
| NEE / NextEra Energy, Inc. | 0,07 | 1,75 | 4,56 | -0,35 | 2,3397 | 0,0348 | |||
| ORCL / Oracle Corporation | 0,02 | -0,84 | 4,54 | 55,09 | 2,3303 | 0,8552 | |||
| JNJ / Johnson & Johnson | 0,03 | 0,59 | 4,42 | -7,36 | 2,2684 | -0,1349 | |||
| USB / U.S. Bancorp | 0,09 | 3,68 | 4,21 | 11,11 | 2,1621 | 0,2521 | |||
| PG / The Procter & Gamble Company | 0,02 | 0,58 | 3,86 | -5,96 | 1,9838 | -0,0871 | |||
| ADBE / Adobe Inc. | 0,01 | 3,99 | 3,79 | 4,89 | 1,9486 | 0,1250 | |||
| DLR / Digital Realty Trust, Inc. | 0,02 | 0,14 | 3,74 | 21,85 | 1,9184 | 0,3726 | |||
| GOOG / Alphabet Inc. | 0,02 | 6,17 | 3,48 | 20,53 | 1,7848 | 0,3314 | |||
| PFE / Pfizer Inc. | 0,14 | 2,42 | 3,28 | -2,03 | 1,6842 | -0,0033 | |||
| HD / The Home Depot, Inc. | 0,01 | -0,30 | 3,24 | -0,25 | 1,6642 | 0,0263 | |||
| LLY / Eli Lilly and Company | 0,00 | 0,22 | 3,16 | -5,42 | 1,6219 | -0,0612 | |||
| KO / The Coca-Cola Company | 0,04 | -0,62 | 3,05 | -1,84 | 1,5640 | 0,0001 | |||
| MCD / McDonald's Corporation | 0,01 | 0,54 | 2,99 | -5,95 | 1,5355 | -0,0673 | |||
| AMZN / Amazon.com, Inc. | 0,01 | -9,43 | 2,91 | 4,41 | 1,4946 | 0,0897 | |||
| PEP / PepsiCo, Inc. | 0,02 | 3,37 | 2,89 | -8,96 | 1,4819 | -0,1161 | |||
| NOC / Northrop Grumman Corporation | 0,01 | -1,47 | 2,68 | -3,81 | 1,3755 | -0,0279 | |||
| AXP / American Express Company | 0,01 | -0,24 | 2,63 | 18,28 | 1,3529 | 0,2300 | |||
| UNH / UnitedHealth Group Incorporated | 0,01 | 2,27 | 2,32 | -39,09 | 1,1931 | -0,7296 | |||
| CVS / CVS Health Corporation | 0,03 | -1,15 | 2,18 | 0,65 | 1,1213 | 0,0277 | |||
| MDT / Medtronic plc | 0,02 | 1,79 | 2,16 | -1,28 | 1,1099 | 0,0065 | |||
| CVX / Chevron Corporation | 0,02 | 0,05 | 2,16 | -14,37 | 1,1085 | -0,1622 | |||
| COP / ConocoPhillips | 0,02 | 1,54 | 2,09 | -13,23 | 1,0710 | -0,1406 | |||
| ETN / Eaton Corporation plc | 0,01 | 1,14 | 2,05 | 32,86 | 1,0551 | 0,2754 | |||
| SCHG / Schwab Strategic Trust - Schwab U.S. Large-Cap Growth ETF | 0,07 | -1,81 | 1,99 | 14,53 | 1,0202 | 0,1458 | |||
| AMGN / Amgen Inc. | 0,01 | -0,97 | 1,71 | -11,27 | 0,8777 | -0,0931 | |||
| APD / Air Products and Chemicals, Inc. | 0,01 | 3,07 | 1,61 | -1,47 | 0,8261 | 0,0035 | |||
| LMT / Lockheed Martin Corporation | 0,00 | 18,40 | 1,50 | 22,78 | 0,7726 | 0,1548 | |||
| CMCSA / Comcast Corporation | 0,04 | 0,30 | 1,49 | -2,99 | 0,7667 | -0,0091 | |||
| NVO / Novo Nordisk A/S - Depositary Receipt (Common Stock) | 0,02 | 0,12 | 1,49 | -0,53 | 0,7655 | 0,0104 | |||
| COST / Costco Wholesale Corporation | 0,00 | -0,55 | 1,44 | 4,12 | 0,7401 | 0,0422 | |||
| SCHD / Schwab Strategic Trust - Schwab U.S. Dividend Equity ETF | 0,05 | -0,99 | 1,40 | -6,15 | 0,7205 | -0,0332 | |||
| MRK / Merck & Co., Inc. | 0,02 | 0,91 | 1,37 | -10,96 | 0,7009 | -0,0722 | |||
| SPY / SPDR S&P 500 ETF | 0,00 | -4,84 | 0,96 | 5,15 | 0,4927 | 0,0325 | |||
| MUNI / PIMCO ETF Trust - PIMCO Intermediate Municipal Bond Active Exchange-Traded Fund | 0,02 | 12,29 | 0,94 | 11,93 | 0,4819 | 0,0591 | |||
| SCHZ / Schwab Strategic Trust - Schwab U.S. Aggregate Bond ETF | 0,04 | 7,00 | 0,93 | 7,41 | 0,4768 | 0,0409 | |||
| DE / Deere & Company | 0,00 | -0,71 | 0,93 | 7,54 | 0,4762 | 0,0417 | |||
| GIS / General Mills, Inc. | 0,02 | -2,88 | 0,89 | -15,80 | 0,4571 | -0,0761 | |||
| SPGI / S&P Global Inc. | 0,00 | 0,00 | 0,63 | 3,78 | 0,3249 | 0,0176 | |||
| GD / General Dynamics Corporation | 0,00 | 0,28 | 0,62 | 7,24 | 0,3199 | 0,0272 | |||
| NVDA / NVIDIA Corporation | 0,00 | 20,83 | 0,57 | 76,00 | 0,2941 | 0,1302 | |||
| VOO / Vanguard Index Funds - Vanguard S&P 500 ETF | 0,00 | 0,00 | 0,47 | 10,56 | 0,2421 | 0,0271 | |||
| SCHO / Schwab Strategic Trust - Schwab Short-Term U.S. Treasury ETF | 0,02 | 1,80 | 0,45 | 2,05 | 0,2306 | 0,0086 | |||
| DIS / The Walt Disney Company | 0,00 | -0,28 | 0,44 | 25,43 | 0,2258 | 0,0489 | |||
| VTI / Vanguard Index Funds - Vanguard Total Stock Market ETF | 0,00 | 0,00 | 0,31 | 10,51 | 0,1570 | 0,0176 | |||
| FSS / Federal Signal Corporation | 0,00 | 0,00 | 0,29 | 44,55 | 0,1503 | 0,0483 | |||
| IJR / iShares Trust - iShares Core S&P Small-Cap ETF | 0,00 | 0,00 | 0,29 | 4,38 | 0,1473 | 0,0090 | |||
| GE / General Electric Company | 0,00 | 0,00 | 0,29 | 28,38 | 0,1467 | 0,0347 | |||
| BMY / Bristol-Myers Squibb Company | 0,01 | -1,22 | 0,28 | -25,07 | 0,1461 | -0,0452 | |||
| BAC / Bank of America Corporation | 0,01 | -1,36 | 0,26 | 11,79 | 0,1318 | 0,0161 | |||
| ADP / Automatic Data Processing, Inc. | 0,00 | -3,25 | 0,23 | -2,14 | 0,1178 | -0,0006 | |||
| GEV / GE Vernova Inc. | 0,00 | 0,22 | 0,1136 | 0,1136 | |||||
| BND / Vanguard Bond Index Funds - Vanguard Total Bond Market ETF | 0,00 | 0,00 | 0,22 | 0,00 | 0,1134 | 0,0024 | |||
| VZ / Verizon Communications Inc. | 0,01 | -23,76 | 0,22 | -27,27 | 0,1111 | -0,0388 | |||
| RTX / RTX Corporation | 0,00 | -100,00 | 0,00 | 0,0000 | |||||
| SBUX / Starbucks Corporation | 0,00 | -100,00 | 0,00 | 0,0000 | |||||
| IBM / International Business Machines Corporation | 0,00 | -100,00 | 0,00 | 0,0000 |