Statistiques de base
| Valeur du portefeuille | $ 100 316 909 |
| Positions actuelles | 42 |
Dernières positions, performances, ASG (à partir des dépôts 13F, 13D)
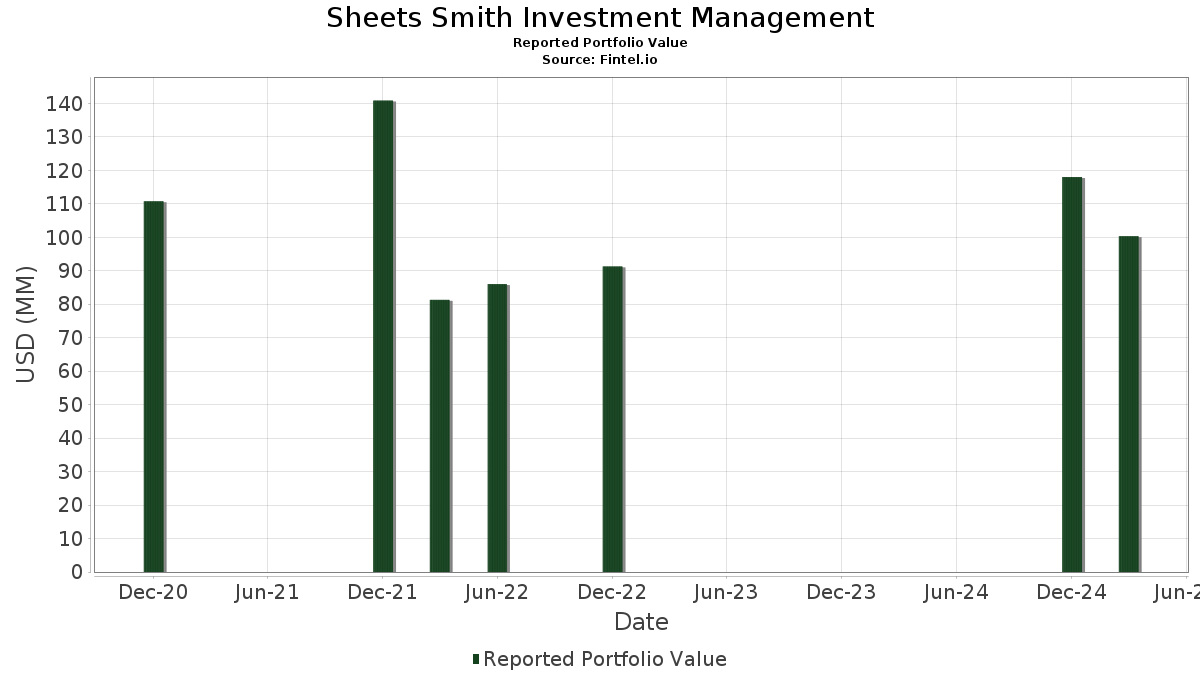
Sheets Smith Investment Management a déclaré un total de 42 positions dans ses derniers dépôts auprès de la SEC. La valeur la plus récente du portefeuille est calculée à 100 316 909 USD. Les actifs sous gestion réels (ASG) sont cette valeur plus les liquidités (qui ne sont pas divulguées). Les principales positions de Sheets Smith Investment Management sont Goldman Sachs ETF Trust - Goldman Sachs Access Treasury 0-1 Year ETF (US:GBIL) , Vanguard Scottsdale Funds - Vanguard Short-Term Corporate Bond ETF (US:VSTB.X) , Invesco Exchange-Traded Fund Trust - Invesco S&P 500 Equal Weight ETF (US:RSP) , Vanguard Scottsdale Funds - Vanguard Intermediate-Term Corporate Bond ETF (US:VCIT) , and NVIDIA Corporation (US:NVDA) . Les nouvelles positions de Sheets Smith Investment Management incluent Sea Limited - Depositary Receipt (Common Stock) (US:SE) , Nutanix, Inc. (US:NTNX) , General Electric Company (US:GE) , Penumbra, Inc. (US:PEN) , and ProShares Trust - ProShares Short QQQ (US:PSQ) .
Meilleures augmentations ce trimestre
Nous utilisons la variation de l'allocation du portefeuille car il s'agit de l'indicateur le plus significatif. Les changements peuvent être dus à des transactions ou à des variations de prix des actions.
| Titre | Actions (en millions) |
Valeur ($ en millions) |
% du portefeuille | ΔPortefeuille % |
|---|---|---|---|---|
| 0,34 | 34,17 | 34,0604 | 27,6154 | |
| 0,14 | 10,82 | 10,7884 | 1,8597 | |
| 0,00 | 1,32 | 1,3166 | 1,3166 | |
| 0,01 | 1,05 | 1,0493 | 1,0493 | |
| 0,01 | 0,98 | 0,9780 | 0,9780 | |
| 0,00 | 0,96 | 0,9545 | 0,9545 | |
| 0,04 | 6,13 | 6,1107 | 0,8472 | |
| 0,00 | 0,77 | 0,7701 | 0,7701 | |
| 0,02 | 2,11 | 2,1055 | 0,7252 | |
| 0,05 | 4,47 | 4,4563 | 0,6897 |
Principales baisses ce trimestre
Nous utilisons la variation de l'allocation du portefeuille car il s'agit de l'indicateur le plus significatif. Les changements peuvent être dus à des transactions ou à des variations de prix des actions.
| Titre | Actions (en millions) |
Valeur ($ en millions) |
% du portefeuille | ΔPortefeuille % |
|---|---|---|---|---|
| 0,00 | 0,33 | 0,3306 | -4,4483 | |
| 0,00 | 0,00 | -3,0797 | ||
| 0,00 | 0,00 | -2,1090 | ||
| 0,01 | 1,48 | 1,4781 | -1,2868 | |
| 0,00 | 1,33 | 1,3249 | -0,8993 | |
| 0,01 | 1,26 | 1,2527 | -0,6568 | |
| 0,01 | 1,07 | 1,0670 | -0,3383 | |
| 0,03 | 1,09 | 1,0888 | -0,2547 | |
| 0,02 | 2,43 | 2,4273 | -0,1345 | |
| 0,01 | 1,14 | 1,1338 | -0,1330 |
Déclarations 13F et dépôts de fonds
Ce formulaire a été déposé le 2025-06-12 pour la période de déclaration 2025-03-31. Cliquez sur l'icône du lien pour voir l'historique complet des transactions.
Mettre à niveau pour débloquer les données premium et exporter vers Excel ![]() .
.
| Titre | Type | Prix moyen de l'action | Actions (en millions) |
ΔActions (%) |
ΔActions (%) |
Valeur ($ en millions) |
Portefeuille (%) |
ΔPortefeuille (%) |
|
|---|---|---|---|---|---|---|---|---|---|
| GBIL / Goldman Sachs ETF Trust - Goldman Sachs Access Treasury 0-1 Year ETF | 0,34 | 348,16 | 34,17 | 349,34 | 34,0604 | 27,6154 | |||
| VSTB.X / Vanguard Scottsdale Funds - Vanguard Short-Term Corporate Bond ETF | 0,14 | 1,52 | 10,82 | 2,73 | 10,7884 | 1,8597 | |||
| RSP / Invesco Exchange-Traded Fund Trust - Invesco S&P 500 Equal Weight ETF | 0,04 | -0,15 | 6,13 | -1,29 | 6,1107 | 0,8472 | |||
| VCIT / Vanguard Scottsdale Funds - Vanguard Intermediate-Term Corporate Bond ETF | 0,05 | -1,24 | 4,47 | 0,59 | 4,4563 | 0,6897 | |||
| NVDA / NVIDIA Corporation | 0,02 | -0,18 | 2,43 | -19,46 | 2,4273 | -0,1345 | |||
| AMZN / Amazon.com, Inc. | 0,01 | 2,98 | 2,35 | -10,70 | 2,3470 | 0,1126 | |||
| PLMR / Palomar Holdings, Inc. | 0,02 | -0,10 | 2,11 | 29,73 | 2,1055 | 0,7252 | |||
| TMUS / T-Mobile US, Inc. | 0,01 | -0,08 | 2,02 | 20,71 | 2,0116 | 0,5950 | |||
| HWM / Howmet Aerospace Inc. | 0,02 | -0,16 | 1,97 | 18,44 | 1,9664 | 0,5547 | |||
| CRS / Carpenter Technology Corporation | 0,01 | -0,24 | 1,89 | 6,55 | 1,8823 | 0,3796 | |||
| EXLS / ExlService Holdings, Inc. | 0,04 | 0,08 | 1,72 | 6,45 | 1,7122 | 0,3448 | |||
| USFD / US Foods Holding Corp. | 0,03 | 23,30 | 1,64 | 19,65 | 1,6397 | 0,4745 | |||
| FI / Fiserv, Inc. | 0,01 | 0,13 | 1,54 | 7,69 | 1,5363 | 0,3228 | |||
| APP / AppLovin Corporation | 0,01 | -44,45 | 1,48 | -54,57 | 1,4781 | -1,2868 | |||
| AVPT / AvePoint, Inc. | 0,10 | -0,30 | 1,47 | -12,85 | 1,4683 | 0,0367 | |||
| WTW / Willis Towers Watson Public Limited Company | 0,00 | -0,36 | 1,42 | 7,52 | 1,4109 | 0,2950 | |||
| SYK / Stryker Corporation | 0,00 | 0,43 | 1,39 | 3,88 | 1,3878 | 0,2514 | |||
| GEV / GE Vernova Inc. | 0,00 | -0,22 | 1,37 | -7,38 | 1,3642 | 0,1117 | |||
| META / Meta Platforms, Inc. | 0,00 | -48,55 | 1,33 | -49,35 | 1,3249 | -0,8993 | |||
| MELI / MercadoLibre, Inc. | 0,00 | 1,32 | 1,3166 | 1,3166 | |||||
| PLTR / Palantir Technologies Inc. | 0,01 | -50,02 | 1,26 | -44,23 | 1,2527 | -0,6568 | |||
| TBBK / The Bancorp, Inc. | 0,02 | -0,37 | 1,25 | 0,00 | 1,2478 | 0,1872 | |||
| PODD / Insulet Corporation | 0,00 | 48,18 | 1,22 | 49,08 | 1,2149 | 0,5219 | |||
| GOOG / Alphabet Inc. | 0,01 | 1,57 | 1,21 | -16,64 | 1,2085 | -0,0246 | |||
| FTNT / Fortinet, Inc. | 0,01 | -25,31 | 1,14 | -23,90 | 1,1338 | -0,1330 | |||
| TOST / Toast, Inc. | 0,03 | -24,28 | 1,09 | -31,10 | 1,0888 | -0,2547 | |||
| ALL / The Allstate Corporation | 0,01 | -39,90 | 1,07 | -35,43 | 1,0670 | -0,3383 | |||
| SE / Sea Limited - Depositary Receipt (Common Stock) | 0,01 | 1,05 | 1,0493 | 1,0493 | |||||
| NFLX / Netflix, Inc. | 0,00 | -22,81 | 1,04 | -19,26 | 1,0411 | -0,0550 | |||
| NTNX / Nutanix, Inc. | 0,01 | 0,98 | 0,9780 | 0,9780 | |||||
| ADP / Automatic Data Processing, Inc. | 0,00 | -27,44 | 0,96 | -24,27 | 0,9618 | -0,1179 | |||
| GE / General Electric Company | 0,00 | 0,96 | 0,9545 | 0,9545 | |||||
| GTLS / Chart Industries, Inc. | 0,01 | 0,10 | 0,87 | -24,35 | 0,8680 | -0,1066 | |||
| SKWD / Skyward Specialty Insurance Group, Inc. | 0,02 | 0,01 | 0,85 | 4,67 | 0,8489 | 0,1597 | |||
| PEN / Penumbra, Inc. | 0,00 | 0,77 | 0,7701 | 0,7701 | |||||
| PSQ / ProShares Trust - ProShares Short QQQ | 0,01 | 0,44 | 0,4432 | 0,4432 | |||||
| XMTR / Xometry, Inc. | 0,01 | 0,35 | 0,3459 | 0,3459 | |||||
| IWV / iShares Trust - iShares Russell 3000 ETF | 0,00 | -93,81 | 0,33 | -94,13 | 0,3306 | -4,4483 | |||
| SH / ProShares Trust - ProShares Short S&P500 | 0,01 | 0,30 | 0,2957 | 0,2957 | |||||
| ARDX / Ardelyx, Inc. | 0,01 | 0,00 | 0,06 | -3,51 | 0,0558 | 0,0068 | |||
| MREO / Mereo BioPharma Group plc - Depositary Receipt (Common Stock) | 0,02 | 0,00 | 0,04 | -35,59 | 0,0379 | -0,0122 | |||
| VERU / Veru Inc. | 0,02 | 0,00 | 0,01 | -28,57 | 0,0109 | -0,0014 | |||
| PANW / Palo Alto Networks, Inc. | 0,00 | -100,00 | 0,00 | 0,0000 | |||||
| BVS / Bioventus Inc. | 0,00 | -100,00 | 0,00 | 0,0000 | |||||
| VERX / Vertex, Inc. | 0,00 | -100,00 | 0,00 | 0,0000 | |||||
| KGS / Kodiak Gas Services, Inc. | 0,00 | -100,00 | 0,00 | 0,0000 | |||||
| AGG / iShares Trust - iShares Core U.S. Aggregate Bond ETF | 0,00 | -100,00 | 0,00 | 0,0000 | |||||
| CWAN / Clearwater Analytics Holdings, Inc. | 0,00 | -100,00 | 0,00 | 0,0000 | |||||
| SHOP / Shopify Inc. | 0,00 | -100,00 | 0,00 | 0,0000 | |||||
| TMHC / Taylor Morrison Home Corporation | 0,00 | -100,00 | 0,00 | 0,0000 | |||||
| BURL / Burlington Stores, Inc. | 0,00 | -100,00 | 0,00 | 0,0000 | |||||
| AAPL / Apple Inc. | 0,00 | -100,00 | 0,00 | -100,00 | -2,1090 | ||||
| MSFT / Microsoft Corporation | 0,00 | -100,00 | 0,00 | -100,00 | -3,0797 | ||||
| TEAM / Atlassian Corporation | 0,00 | -100,00 | 0,00 | 0,0000 | |||||
| FTI / TechnipFMC plc | 0,00 | -100,00 | 0,00 | 0,0000 | |||||
| OII / Oceaneering International, Inc. | 0,00 | -100,00 | 0,00 | 0,0000 | |||||
| EFIV / SPDR Series Trust - SPDR S&P 500 ESG ETF | 0,00 | -100,00 | 0,00 | 0,0000 | |||||
| ROAD / Construction Partners, Inc. | 0,00 | -100,00 | 0,00 | 0,0000 | |||||
| MCY / Mercury General Corporation | 0,00 | -100,00 | 0,00 | 0,0000 | |||||
| NOW / ServiceNow, Inc. | 0,00 | -100,00 | 0,00 | 0,0000 | |||||
| ALSN / Allison Transmission Holdings, Inc. | 0,00 | -100,00 | 0,00 | 0,0000 | |||||
| DSGX / The Descartes Systems Group Inc. | 0,00 | -100,00 | 0,00 | 0,0000 | |||||
| ACA / Arcosa, Inc. | 0,00 | -100,00 | 0,00 | 0,0000 | |||||
| HUBS / HubSpot, Inc. | 0,00 | -100,00 | 0,00 | 0,0000 | |||||
| VRT / Vertiv Holdings Co | 0,00 | -100,00 | 0,00 | 0,0000 |