Statistiques de base
| Valeur du portefeuille | $ 142 453 646 |
| Positions actuelles | 87 |
Dernières positions, performances, ASG (à partir des dépôts 13F, 13D)
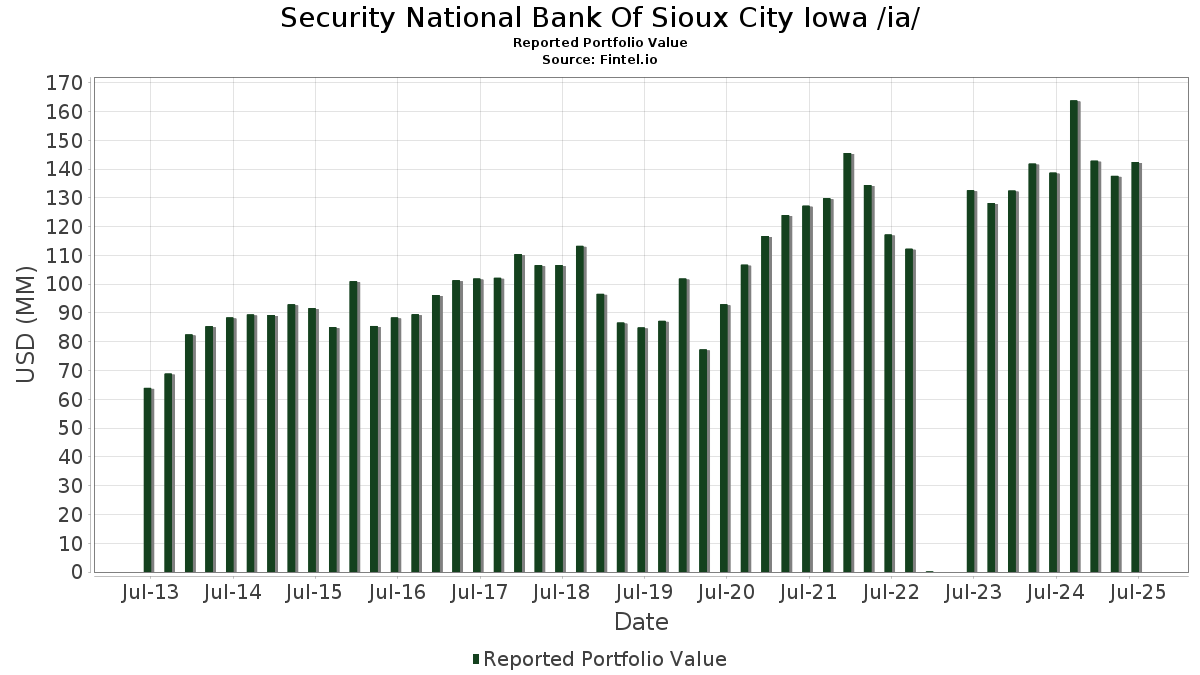
Security National Bank Of Sioux City Iowa /ia/ a déclaré un total de 87 positions dans ses derniers dépôts auprès de la SEC. La valeur la plus récente du portefeuille est calculée à 142 453 646 USD. Les actifs sous gestion réels (ASG) sont cette valeur plus les liquidités (qui ne sont pas divulguées). Les principales positions de Security National Bank Of Sioux City Iowa /ia/ sont Microsoft Corporation (US:MSFT) , Apple Inc. (US:AAPL) , Berkshire Hathaway Inc. (US:BRK.B) , Oracle Corporation (US:ORCL) , and Berkshire Hathaway Inc. (US:BRK.A) . Les nouvelles positions de Security National Bank Of Sioux City Iowa /ia/ incluent Alliant Energy Corporation (US:LNT) , .
Meilleures augmentations ce trimestre
Nous utilisons la variation de l'allocation du portefeuille car il s'agit de l'indicateur le plus significatif. Les changements peuvent être dus à des transactions ou à des variations de prix des actions.
| Titre | Actions (en millions) |
Valeur ($ en millions) |
% du portefeuille | ΔPortefeuille % |
|---|---|---|---|---|
| 0,01 | 1,21 | 0,4575 | 0,4575 | |
| 0,01 | 0,43 | 0,3007 | 0,3007 | |
| 0,02 | 1,34 | 0,5069 | 0,0981 | |
| 0,01 | 1,94 | 1,3636 | 0,0588 | |
| 0,01 | 3,35 | 1,2626 | 0,0097 |
Principales baisses ce trimestre
Nous utilisons la variation de l'allocation du portefeuille car il s'agit de l'indicateur le plus significatif. Les changements peuvent être dus à des transactions ou à des variations de prix des actions.
| Titre | Actions (en millions) |
Valeur ($ en millions) |
% du portefeuille | ΔPortefeuille % |
|---|---|---|---|---|
| 0,01 | 6,05 | 2,2817 | -2,7689 | |
| 0,00 | 5,10 | 1,9238 | -2,1374 | |
| 0,01 | 2,66 | 1,0013 | -1,3587 | |
| 0,03 | 3,42 | 1,2891 | -1,3416 | |
| 0,02 | 8,02 | 3,0259 | -1,2754 | |
| 0,03 | 2,99 | 1,1294 | -1,2123 | |
| 0,02 | 4,17 | 1,5730 | -1,0709 | |
| 0,01 | 2,86 | 1,0775 | -0,9772 | |
| 0,02 | 3,08 | 1,1602 | -0,9714 | |
| 0,02 | 2,85 | 1,0735 | -0,9649 |
Déclarations 13F et dépôts de fonds
Ce formulaire a été déposé le 2025-08-15 pour la période de déclaration 2025-06-30. Cliquez sur l'icône du lien pour voir l'historique complet des transactions.
Mettre à niveau pour débloquer les données premium et exporter vers Excel ![]() .
.
| Titre | Type | Prix moyen de l'action | Actions (en millions) |
ΔActions (%) |
ΔActions (%) |
Valeur ($ en millions) |
Portefeuille (%) |
ΔPortefeuille (%) |
|
|---|---|---|---|---|---|---|---|---|---|
| MSFT / Microsoft Corporation | 0,02 | 2,30 | 8,02 | 35,56 | 3,0259 | -1,2754 | |||
| AAPL / Apple Inc. | 0,03 | -0,07 | 6,43 | -7,70 | 4,5168 | -0,5488 | |||
| BRK.B / Berkshire Hathaway Inc. | 0,01 | -4,56 | 6,05 | -12,95 | 2,2817 | -2,7689 | |||
| ORCL / Oracle Corporation | 0,02 | 0,18 | 5,14 | 56,64 | 1,9390 | -0,4460 | |||
| BRK.A / Berkshire Hathaway Inc. | 0,00 | 0,00 | 5,10 | -8,73 | 1,9238 | -2,1374 | |||
| GOOGL / Alphabet Inc. | 0,02 | 0,60 | 4,17 | 14,65 | 1,5730 | -1,0709 | |||
| WMT / Walmart Inc. | 0,04 | 1,03 | 3,53 | 12,55 | 1,3293 | -0,9469 | |||
| AFL / Aflac Incorporated | 0,03 | -0,45 | 3,42 | -5,58 | 1,2891 | -1,3416 | |||
| JPM / JPMorgan Chase & Co. | 0,01 | 64,31 | 3,35 | 94,20 | 1,2626 | 0,0097 | |||
| QCOM / QUALCOMM Incorporated | 0,02 | 1,16 | 3,08 | 4,88 | 1,1602 | -0,9714 | |||
| XOM / Exxon Mobil Corporation | 0,03 | 2,53 | 2,99 | -7,08 | 1,1294 | -1,2123 | |||
| ADP / Automatic Data Processing, Inc. | 0,01 | 0,11 | 2,86 | 1,06 | 1,0775 | -0,9772 | |||
| ABBV / AbbVie Inc. | 0,02 | 14,55 | 2,85 | 1,46 | 1,0735 | -0,9649 | |||
| LDOS / Leidos Holdings, Inc. | 0,02 | -0,67 | 2,70 | 16,13 | 1,0185 | -0,6714 | |||
| TMO / Thermo Fisher Scientific Inc. | 0,01 | 0,34 | 2,66 | -18,23 | 1,0013 | -1,3587 | |||
| ABT / Abbott Laboratories | 0,02 | 8,88 | 2,54 | 11,68 | 0,9594 | -0,6966 | |||
| DLR / Digital Realty Trust, Inc. | 0,01 | 0,14 | 2,49 | 21,84 | 0,9384 | -0,5458 | |||
| TEL / TE Connectivity plc | 0,01 | 0,66 | 2,45 | 20,15 | 0,9245 | -0,5583 | |||
| HD / The Home Depot, Inc. | 0,01 | 0,27 | 2,32 | 0,30 | 0,8741 | -0,8050 | |||
| NKE / NIKE, Inc. | 0,03 | 4,91 | 2,25 | 17,41 | 0,8495 | -0,5447 | |||
| STT / State Street Corporation | 0,02 | -0,15 | 2,20 | 18,58 | 0,8306 | -0,5190 | |||
| JNJ / Johnson & Johnson | 0,01 | -0,10 | 2,20 | -8,00 | 0,8288 | -0,9069 | |||
| BAH / Booz Allen Hamilton Holding Corporation | 0,02 | 0,22 | 2,12 | -0,19 | 0,7984 | -0,7433 | |||
| CMI / Cummins Inc. | 0,01 | -0,16 | 2,10 | 4,33 | 0,7909 | -0,6699 | |||
| O / Realty Income Corporation | 0,04 | 0,20 | 2,06 | -0,48 | 0,7781 | -0,7287 | |||
| VZ / Verizon Communications Inc. | 0,05 | 2,35 | 2,06 | -2,37 | 0,7763 | -0,7559 | |||
| VEA / Vanguard Tax-Managed Funds - Vanguard FTSE Developed Markets ETF | 0,04 | -3,30 | 2,00 | 8,47 | 0,7537 | -0,5854 | |||
| UNP / Union Pacific Corporation | 0,01 | -0,05 | 1,96 | -2,63 | 0,7389 | -0,7237 | |||
| J / Jacobs Solutions Inc. | 0,01 | -0,51 | 1,94 | 8,19 | 1,3636 | 0,0588 | |||
| CTSH / Cognizant Technology Solutions Corporation | 0,02 | 0,18 | 1,93 | 2,22 | 0,7279 | -0,6447 | |||
| LIN / Linde plc | 0,00 | -0,81 | 1,90 | -0,05 | 0,7174 | -0,6657 | |||
| GIS / General Mills, Inc. | 0,04 | 0,84 | 1,90 | -12,61 | 0,7163 | -0,8633 | |||
| NUE / Nucor Corporation | 0,01 | -0,28 | 1,82 | 7,31 | 0,6867 | -0,5460 | |||
| DHR / Danaher Corporation | 0,01 | 0,01 | 1,77 | -3,59 | 0,6686 | -0,6683 | |||
| RTX / RTX Corporation | 0,01 | -1,11 | 1,74 | 9,00 | 0,6580 | -0,5050 | |||
| WAB / Westinghouse Air Brake Technologies Corporation | 0,01 | -0,67 | 1,73 | 14,62 | 0,6508 | -0,4429 | |||
| CMCSA / Comcast Corporation | 0,05 | 1,29 | 1,67 | -2,06 | 0,6290 | -0,6081 | |||
| VLTO / Veralto Corporation | 0,02 | -0,21 | 1,58 | 3,40 | 0,5966 | -0,5155 | |||
| PYPL / PayPal Holdings, Inc. | 0,02 | 7,60 | 1,57 | 22,52 | 0,5911 | -0,3383 | |||
| TROW / T. Rowe Price Group, Inc. | 0,02 | 2,92 | 1,56 | 8,10 | 0,5893 | -0,4610 | |||
| EA / Electronic Arts Inc. | 0,01 | -0,27 | 1,50 | 10,22 | 0,5654 | -0,4232 | |||
| CL / Colgate-Palmolive Company | 0,02 | -0,25 | 1,46 | -3,24 | 0,5523 | -0,5474 | |||
| LRCX / Lam Research Corporation | 0,01 | 20,02 | 1,37 | 60,75 | 0,5161 | -0,1028 | |||
| JEPI / J.P. Morgan Exchange-Traded Fund Trust - JPMorgan Equity Premium Income ETF | 0,02 | 140,17 | 1,34 | 139,15 | 0,5069 | 0,0981 | |||
| PRU / Prudential Financial, Inc. | 0,01 | 0,23 | 1,31 | -3,60 | 0,4947 | -0,4939 | |||
| IBB / iShares Trust - iShares Biotechnology ETF | 0,01 | 0,52 | 1,23 | -0,57 | 0,4632 | -0,4345 | |||
| SNA / Snap-on Incorporated | 0,00 | -0,08 | 1,21 | -7,76 | 0,4576 | -0,4981 | |||
| AMZN / Amazon.com, Inc. | 0,01 | 1,21 | 0,4575 | 0,4575 | |||||
| PEP / PepsiCo, Inc. | 0,01 | -0,54 | 1,21 | -12,44 | 0,4568 | -0,5482 | |||
| ITW / Illinois Tool Works Inc. | 0,00 | 0,23 | 1,20 | -0,08 | 0,4516 | -0,4193 | |||
| TKR / The Timken Company | 0,02 | -0,65 | 1,10 | 0,27 | 0,4157 | -0,3830 | |||
| SLB / Schlumberger Limited | 0,03 | 0,45 | 1,10 | -18,77 | 0,4131 | -0,5670 | |||
| MINT / PIMCO ETF Trust - PIMCO Enhanced Short Maturity Active Exchange-Traded Fund | 0,01 | 0,00 | 1,05 | -0,10 | 0,3942 | -0,3660 | |||
| KO / The Coca-Cola Company | 0,01 | -13,43 | 0,99 | -14,52 | 0,3732 | -0,4677 | |||
| IP / International Paper Company | 0,02 | 0,24 | 0,97 | -12,06 | 0,3661 | -0,4356 | |||
| KMB / Kimberly-Clark Corporation | 0,01 | 0,14 | 0,93 | -9,16 | 0,3515 | -0,3946 | |||
| BND / Vanguard Bond Index Funds - Vanguard Total Bond Market ETF | 0,01 | -1,45 | 0,75 | -1,18 | 0,2832 | -0,2692 | |||
| ET / Energy Transfer LP - Limited Partnership | 0,03 | 0,00 | 0,60 | -2,46 | 0,2244 | -0,2190 | |||
| FTV / Fortive Corporation | 0,01 | -0,62 | 0,56 | -29,22 | 0,2103 | -0,3622 | |||
| NVDA / NVIDIA Corporation | 0,00 | -56,61 | 0,54 | -36,74 | 0,3787 | -0,2410 | |||
| VUG / Vanguard Index Funds - Vanguard Growth ETF | 0,00 | -0,41 | 0,54 | 17,72 | 0,2030 | -0,1292 | |||
| LMT / Lockheed Martin Corporation | 0,00 | 0,00 | 0,52 | 3,78 | 0,1967 | -0,1688 | |||
| META / Meta Platforms, Inc. | 0,00 | 0,00 | 0,48 | 28,30 | 0,1795 | -0,0906 | |||
| AMTM / Amentum Holdings, Inc. | 0,02 | 12,91 | 0,46 | 46,77 | 0,1716 | -0,0541 | |||
| LNT / Alliant Energy Corporation | 0,01 | 0,43 | 0,3007 | 0,3007 | |||||
| CAT / Caterpillar Inc. | 0,00 | 23,15 | 0,41 | 45,42 | 0,1558 | -0,0513 | |||
| SUN / Sunoco LP - Limited Partnership | 0,01 | 0,00 | 0,38 | -7,64 | 0,1415 | -0,1539 | |||
| VTV / Vanguard Index Funds - Vanguard Value ETF | 0,00 | -0,71 | 0,37 | 1,64 | 0,1402 | -0,1257 | |||
| TSN / Tyson Foods, Inc. | 0,01 | -71,41 | 0,36 | -74,98 | 0,1369 | -0,9152 | |||
| ORI / Old Republic International Corporation | 0,01 | 0,00 | 0,36 | -1,93 | 0,1343 | -0,1297 | |||
| SPY / SPDR S&P 500 ETF | 0,00 | 0,00 | 0,33 | 10,47 | 0,1235 | -0,0919 | |||
| EPD / Enterprise Products Partners L.P. - Limited Partnership | 0,01 | -8,77 | 0,31 | -17,07 | 0,1155 | -0,1531 | |||
| JNK / SPDR Series Trust - SPDR Bloomberg High Yield Bond ETF | 0,00 | -5,47 | 0,30 | -3,49 | 0,1148 | -0,1145 | |||
| SCHD / Schwab Strategic Trust - Schwab U.S. Dividend Equity ETF | 0,01 | 0,00 | 0,29 | -5,18 | 0,1106 | -0,1143 | |||
| FI / Fiserv, Inc. | 0,00 | -1,16 | 0,29 | -22,69 | 0,1105 | -0,1655 | |||
| DVY / iShares Trust - iShares Select Dividend ETF | 0,00 | -15,26 | 0,29 | -16,33 | 0,1084 | -0,1409 | |||
| VWO / Vanguard International Equity Index Funds - Vanguard FTSE Emerging Markets ETF | 0,01 | -0,79 | 0,27 | 8,40 | 0,1025 | -0,0797 | |||
| V / Visa Inc. | 0,00 | 0,00 | 0,27 | 1,50 | 0,1019 | -0,0919 | |||
| MRK / Merck & Co., Inc. | 0,00 | 13,87 | 0,26 | 0,39 | 0,0980 | -0,0900 | |||
| NNI / Nelnet, Inc. | 0,00 | 0,00 | 0,25 | 9,48 | 0,0959 | -0,0734 | |||
| XLK / The Select Sector SPDR Trust - The Technology Select Sector SPDR Fund | 0,00 | 0,00 | 0,25 | 22,82 | 0,0955 | -0,0545 | |||
| VOO / Vanguard Index Funds - Vanguard S&P 500 ETF | 0,00 | -1,62 | 0,24 | 8,60 | 0,0908 | -0,0701 | |||
| PAA / Plains All American Pipeline, L.P. - Limited Partnership | 0,01 | 0,00 | 0,23 | -8,47 | 0,0857 | -0,0945 | |||
| VB / Vanguard Index Funds - Vanguard Small-Cap ETF | 0,00 | -0,43 | 0,22 | 6,25 | 0,0836 | -0,0678 | |||
| VNQ / Vanguard Specialized Funds - Vanguard Real Estate ETF | 0,00 | -0,26 | 0,20 | -1,93 | 0,0767 | -0,0740 | |||
| DE / Deere & Company | 0,00 | -9,63 | 0,20 | -1,96 | 0,0755 | -0,0731 | |||
| NGL / NGL Energy Partners LP - Limited Partnership | 0,02 | 0,00 | 0,09 | -5,26 | 0,0340 | -0,0356 | |||
| TGT / Target Corporation | 0,00 | -100,00 | 0,00 | 0,0000 | |||||
| OXY / Occidental Petroleum Corporation | 0,00 | -100,00 | 0,00 | 0,0000 | |||||
| PG / The Procter & Gamble Company | 0,00 | -100,00 | 0,00 | 0,0000 |