Statistiques de base
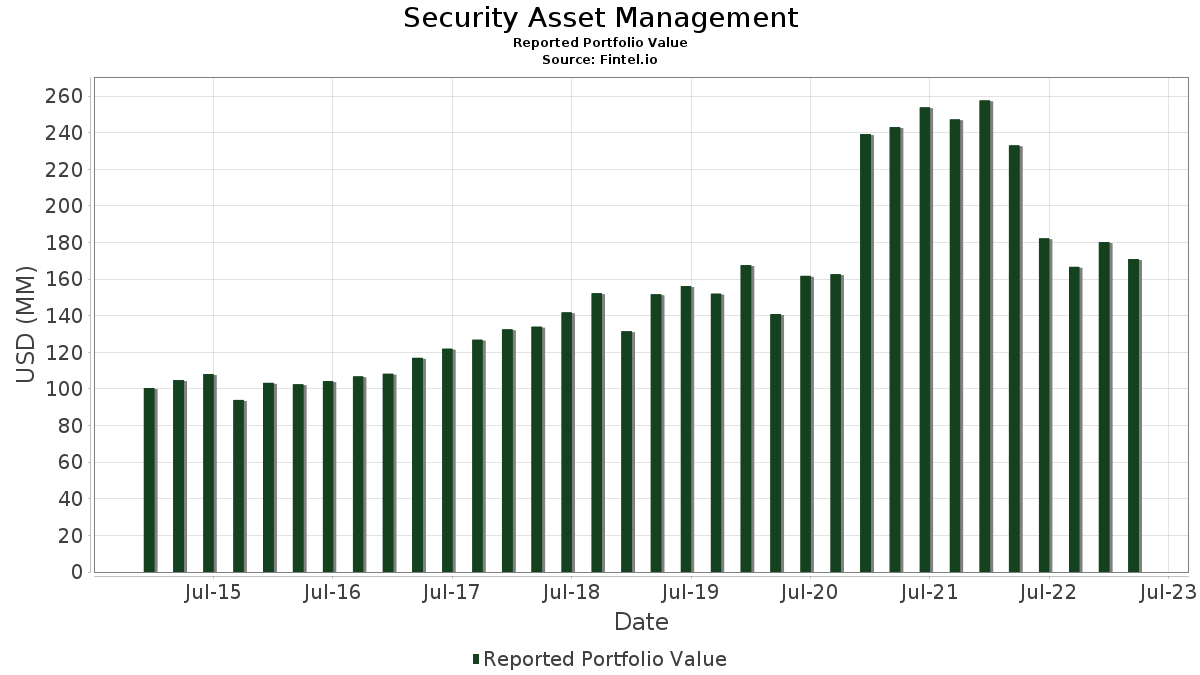
| Valeur du portefeuille | $ 170 929 770 |
| Positions actuelles | 76 |
Dernières positions, performances, ASG (à partir des dépôts 13F, 13D)
Security Asset Management a déclaré un total de 76 positions dans ses derniers dépôts auprès de la SEC. La valeur la plus récente du portefeuille est calculée à 170 929 770 USD. Les actifs sous gestion réels (ASG) sont cette valeur plus les liquidités (qui ne sont pas divulguées). Les principales positions de Security Asset Management sont Apple Inc. (US:AAPL) , JPMorgan Chase & Co. (US:JPM) , Danaher Corporation (US:DHR) , Microsoft Corporation (US:MSFT) , and Mastercard Incorporated (US:MA) . Les nouvelles positions de Security Asset Management incluent Vanguard Bond Index Funds - Vanguard Bond Index Fund Total Bond Market Index Fund (US:VBMFX) , BlackRock Innovation and Growth Term Trust (US:BIGZ) , iShares Trust - iShares 3-7 Year Treasury Bond ETF (US:IEI) , Vanguard Scottsdale Funds - Vanguard Mortgage-Backed Securities ETF (US:VMBS) , and iShares Trust - iShares 7-10 Year Treasury Bond ETF (US:IEF) .
Meilleures augmentations ce trimestre
Nous utilisons la variation de l'allocation du portefeuille car il s'agit de l'indicateur le plus significatif. Les changements peuvent être dus à des transactions ou à des variations de prix des actions.
| Titre | Actions (en millions) |
Valeur ($ en millions) |
% du portefeuille | ΔPortefeuille % |
|---|---|---|---|---|
| 0,11 | 18,57 | 10,8651 | 2,6503 | |
| 0,02 | 1,64 | 0,9610 | 0,9610 | |
| 0,02 | 1,88 | 1,0974 | 0,8655 | |
| 1,29 | 0,7531 | 0,7531 | ||
| 1,24 | 0,7265 | 0,7265 | ||
| 0,02 | 5,95 | 3,4790 | 0,5482 | |
| 0,11 | 0,86 | 0,5042 | 0,5042 | |
| 0,01 | 4,04 | 2,3652 | 0,4723 | |
| 0,05 | 4,73 | 2,7679 | 0,3905 | |
| 0,01 | 0,62 | 0,3614 | 0,3614 |
Principales baisses ce trimestre
Nous utilisons la variation de l'allocation du portefeuille car il s'agit de l'indicateur le plus significatif. Les changements peuvent être dus à des transactions ou à des variations de prix des actions.
| Titre | Actions (en millions) |
Valeur ($ en millions) |
% du portefeuille | ΔPortefeuille % |
|---|---|---|---|---|
| 0,00 | 0,00 | -1,7399 | ||
| 0,00 | 0,00 | -0,8364 | ||
| 0,03 | 6,85 | 4,0098 | -0,7228 | |
| 0,00 | 0,00 | -0,6629 | ||
| 0,02 | 2,86 | 1,6714 | -0,6396 | |
| 0,00 | 0,00 | -0,4881 | ||
| 0,02 | 5,65 | 3,3041 | -0,4400 | |
| 0,02 | 3,14 | 1,8374 | -0,4329 | |
| 0,02 | 3,47 | 2,0319 | -0,4296 | |
| 0,01 | 4,93 | 2,8837 | -0,4147 |
Déclarations 13F et dépôts de fonds
Ce formulaire a été déposé le 2023-05-12 pour la période de déclaration 2023-03-31. Cliquez sur l'icône du lien pour voir l'historique complet des transactions.
Mettre à niveau pour débloquer les données premium et exporter vers Excel ![]() .
.
| Titre | Type | Prix moyen de l'action | Actions (en millions) |
ΔActions (%) |
ΔActions (%) |
Valeur ($ en millions) |
Portefeuille (%) |
ΔPortefeuille (%) |
|
|---|---|---|---|---|---|---|---|---|---|
| AAPL / Apple Inc. | 0,11 | -1,15 | 18,57 | 25,45 | 10,8651 | 2,6503 | |||
| JPM / JPMorgan Chase & Co. | 0,06 | -9,14 | 7,29 | -11,70 | 4,2644 | -0,3169 | |||
| DHR / Danaher Corporation | 0,03 | -15,36 | 6,85 | -19,64 | 4,0098 | -0,7228 | |||
| MSFT / Microsoft Corporation | 0,02 | -6,33 | 5,95 | 12,59 | 3,4790 | 0,5482 | |||
| MA / Mastercard Incorporated | 0,02 | -19,90 | 5,65 | -16,29 | 3,3041 | -0,4400 | |||
| ROP / Roper Technologies, Inc. | 0,01 | -12,15 | 5,21 | -10,40 | 3,0491 | -0,1790 | |||
| C.WSA / Citigroup, Inc. | 0,01 | -12,17 | 4,93 | -17,06 | 2,8837 | -0,4147 | |||
| AMZN / Amazon.com, Inc. | 0,05 | -10,19 | 4,73 | 10,43 | 2,7679 | 0,3905 | |||
| GOOGL / Alphabet Inc. | 0,04 | -16,05 | 4,68 | -1,62 | 2,7367 | 0,0985 | |||
| DOV / Dover Corporation | 0,03 | -22,32 | 4,07 | -12,85 | 2,3813 | -0,2103 | |||
| CME / CME Group Inc. | 0,02 | -18,80 | 4,07 | -7,52 | 2,3800 | -0,0613 | |||
| WST / West Pharmaceutical Services, Inc. | 0,01 | -19,49 | 4,04 | 18,53 | 2,3652 | 0,4723 | |||
| BRK.B / Berkshire Hathaway Inc. | 0,01 | -10,82 | 3,99 | -10,86 | 2,3342 | -0,1497 | |||
| GOOGL / Alphabet Inc. | 0,04 | -5,77 | 3,79 | 10,78 | 2,2187 | 0,3189 | |||
| MKL / Markel Group Inc. | 0,00 | -1,45 | 3,65 | -4,45 | 2,1359 | 0,0156 | |||
| MSCI / MSCI Inc. | 0,01 | -18,11 | 3,59 | -1,45 | 2,1016 | 0,0786 | |||
| JNJ / Johnson & Johnson | 0,02 | 2,05 | 3,51 | -10,47 | 2,0557 | -0,1219 | |||
| V / Visa Inc. | 0,02 | -22,08 | 3,48 | -15,44 | 2,0374 | -0,2480 | |||
| AMT / American Tower Corporation | 0,02 | -18,82 | 3,47 | -21,69 | 2,0319 | -0,4296 | |||
| ZTS / Zoetis Inc. | 0,02 | -19,25 | 3,44 | -8,29 | 2,0123 | -0,0691 | |||
| HEI / HEICO Corporation | 0,02 | -15,25 | 3,17 | -5,65 | 1,8568 | -0,0100 | |||
| AME / AMETEK, Inc. | 0,02 | -26,20 | 3,14 | -23,25 | 1,8374 | -0,4329 | |||
| IDXX / IDEXX Laboratories, Inc. | 0,01 | -29,94 | 3,09 | -14,12 | 1,8075 | -0,1889 | |||
| CPRT / Copart, Inc. | 0,04 | -19,31 | 2,91 | -0,34 | 1,7011 | 0,0822 | |||
| AWK / American Water Works Company, Inc. | 0,02 | -28,62 | 2,86 | -31,41 | 1,6714 | -0,6396 | |||
| TMO / Thermo Fisher Scientific Inc. | 0,00 | -16,23 | 2,84 | -12,34 | 1,6590 | -0,1358 | |||
| ABBV / AbbVie Inc. | 0,02 | 0,22 | 2,43 | -1,14 | 1,4211 | 0,0572 | |||
| PAYC / Paycom Software, Inc. | 0,01 | -19,30 | 2,41 | -20,94 | 1,4095 | -0,2815 | |||
| ECL / Ecolab Inc. | 0,01 | -26,21 | 2,40 | -16,07 | 1,4025 | -0,1828 | |||
| TYL / Tyler Technologies, Inc. | 0,01 | -27,25 | 2,34 | -19,99 | 1,3675 | -0,2535 | |||
| HD / The Home Depot, Inc. | 0,01 | -10,09 | 2,26 | -16,01 | 1,3201 | -0,1705 | |||
| TDY / Teledyne Technologies Incorporated | 0,01 | -21,38 | 2,25 | -12,06 | 1,3138 | -0,1032 | |||
| ABT / Abbott Laboratories | 0,02 | -6,33 | 2,12 | -13,61 | 1,2405 | -0,1216 | |||
| TW / Tradeweb Markets Inc. | 0,02 | 268,77 | 1,88 | 349,64 | 1,0974 | 0,8655 | |||
| VEEV / Veeva Systems Inc. | 0,01 | -17,97 | 1,77 | -6,56 | 1,0333 | -0,0159 | |||
| VBMFX / Vanguard Bond Index Funds - Vanguard Bond Index Fund Total Bond Market Index Fund | 0,02 | 1,64 | 0,9610 | 0,9610 | |||||
| BX / Blackstone Inc. | 0,02 | -29,39 | 1,57 | -16,42 | 0,9176 | -0,1236 | |||
| INTU / Intuit Inc. | 0,00 | -32,34 | 1,38 | -22,52 | 0,8076 | -0,1808 | |||
| XOM / Exxon Mobil Corporation | 0,01 | 12,63 | 1,30 | 12,05 | 0,7618 | 0,1165 | |||
| IBDP / iShares Trust - iShares iBonds Dec 2024 Term Corporate ETF | 1,29 | 0,7531 | 0,7531 | ||||||
| IBDO / iShares Trust - iShares iBonds Dec 2023 Term Corporate ETF | 1,24 | 0,7265 | 0,7265 | ||||||
| CDNS / Cadence Design Systems, Inc. | 0,01 | 15,93 | 1,24 | 51,53 | 0,7247 | 0,2713 | |||
| NVDA / NVIDIA Corporation | 0,00 | -39,60 | 1,18 | 14,83 | 0,6890 | 0,1197 | |||
| PG / The Procter & Gamble Company | 0,01 | -21,66 | 1,08 | -23,15 | 0,6333 | -0,1483 | |||
| MRK / Merck & Co., Inc. | 0,01 | -27,03 | 0,94 | -29,99 | 0,5517 | -0,1962 | |||
| CVX / Chevron Corporation | 0,01 | 21,06 | 0,93 | 10,07 | 0,5438 | 0,0751 | |||
| ISRG / Intuitive Surgical, Inc. | 0,00 | 5,54 | 0,90 | 1,58 | 0,5268 | 0,0350 | |||
| BIGZ / BlackRock Innovation and Growth Term Trust | 0,11 | 0,86 | 0,5042 | 0,5042 | |||||
| PFE / Pfizer Inc. | 0,02 | -7,49 | 0,73 | -26,36 | 0,4267 | -0,1228 | |||
| AMGN / Amgen Inc. | 0,00 | -1,15 | 0,73 | -8,92 | 0,4243 | -0,0180 | |||
| GPC / Genuine Parts Company | 0,00 | 0,00 | 0,64 | -3,59 | 0,3772 | 0,0061 | |||
| BMY / Bristol-Myers Squibb Company | 0,01 | 20,31 | 0,64 | 15,76 | 0,3743 | 0,0679 | |||
| COST / Costco Wholesale Corporation | 0,00 | -50,80 | 0,63 | -46,49 | 0,3660 | -0,2823 | |||
| IEI / iShares Trust - iShares 3-7 Year Treasury Bond ETF | 0,01 | 0,62 | 0,3614 | 0,3614 | |||||
| VMBS / Vanguard Scottsdale Funds - Vanguard Mortgage-Backed Securities ETF | 0,01 | 0,60 | 0,3513 | 0,3513 | |||||
| IEF / iShares Trust - iShares 7-10 Year Treasury Bond ETF | 0,01 | 0,58 | 0,3392 | 0,3392 | |||||
| BKNG / Booking Holdings Inc. | 0,00 | 42,00 | 0,56 | 86,75 | 0,3305 | 0,1628 | |||
| MDT / Medtronic plc | 0,01 | 0,00 | 0,53 | 12,92 | 0,3119 | 0,0499 | |||
| TGT / Target Corporation | 0,00 | -17,56 | 0,51 | -8,48 | 0,2971 | -0,0105 | |||
| NVS / Novartis AG - Depositary Receipt (Common Stock) | 0,01 | 0,00 | 0,48 | 1,26 | 0,2819 | 0,0182 | |||
| BRK.A / Berkshire Hathaway Inc. | 0,00 | 0,00 | 0,47 | -0,64 | 0,2724 | 0,0123 | |||
| LIN / Linde plc | 0,00 | 0,00 | 0,44 | 9,14 | 0,2587 | 0,0335 | |||
| VZ / Verizon Communications Inc. | 0,01 | -2,47 | 0,44 | -3,52 | 0,2563 | 0,0038 | |||
| ADX / Adams Diversified Equity Fund, Inc. | 0,03 | 0,42 | 0,2472 | 0,2472 | |||||
| GS.PRK / The Goldman Sachs Group, Inc. - Preferred Stock | 0,00 | 11,57 | 0,38 | 6,18 | 0,2215 | 0,0239 | |||
| AMAT / Applied Materials, Inc. | 0,00 | 0,00 | 0,36 | 26,04 | 0,2126 | 0,0527 | |||
| KO / The Coca-Cola Company | 0,01 | 0,00 | 0,36 | -2,45 | 0,2096 | 0,0057 | |||
| CSCO / Cisco Systems, Inc. | 0,01 | 0,08 | 0,33 | 9,90 | 0,1950 | 0,0266 | |||
| HON / Honeywell International Inc. | 0,00 | 0,12 | 0,33 | -10,68 | 0,1908 | -0,0120 | |||
| PM / Philip Morris International Inc. | 0,00 | 35,11 | 0,32 | 29,80 | 0,1866 | 0,0502 | |||
| SBAC / SBA Communications Corporation | 0,00 | 12,79 | 0,28 | 5,20 | 0,1657 | 0,0160 | |||
| AES / The AES Corporation | 0,01 | 0,00 | 0,26 | -16,29 | 0,1507 | -0,0200 | |||
| TROW / T. Rowe Price Group, Inc. | 0,00 | 0,00 | 0,25 | 3,28 | 0,1480 | 0,0123 | |||
| WFC / Wells Fargo & Company | 0,01 | 0,00 | 0,25 | -9,56 | 0,1443 | -0,0069 | |||
| EMR / Emerson Electric Co. | 0,00 | -17,24 | 0,21 | -24,82 | 0,1224 | -0,0322 | |||
| UL / Unilever PLC - Depositary Receipt (Common Stock) | 0,00 | 0,21 | 0,1221 | 0,1221 | |||||
| ILMN / Illumina, Inc. | 0,00 | -100,00 | 0,00 | -100,00 | -0,4881 | ||||
| BAC.PRB / Bank of America Corporation - Preferred Stock | 0,00 | -100,00 | 0,00 | -100,00 | -0,1645 | ||||
| FRC / First Republic Bank | 0,00 | -100,00 | 0,00 | -100,00 | -0,6629 | ||||
| STE / STERIS plc | 0,00 | -100,00 | 0,00 | -100,00 | -0,8364 | ||||
| PEP / PepsiCo, Inc. | 0,00 | -100,00 | 0,00 | -100,00 | -0,1585 | ||||
| EQIX / Equinix, Inc. | 0,00 | -100,00 | 0,00 | -100,00 | -1,7399 |