Statistiques de base
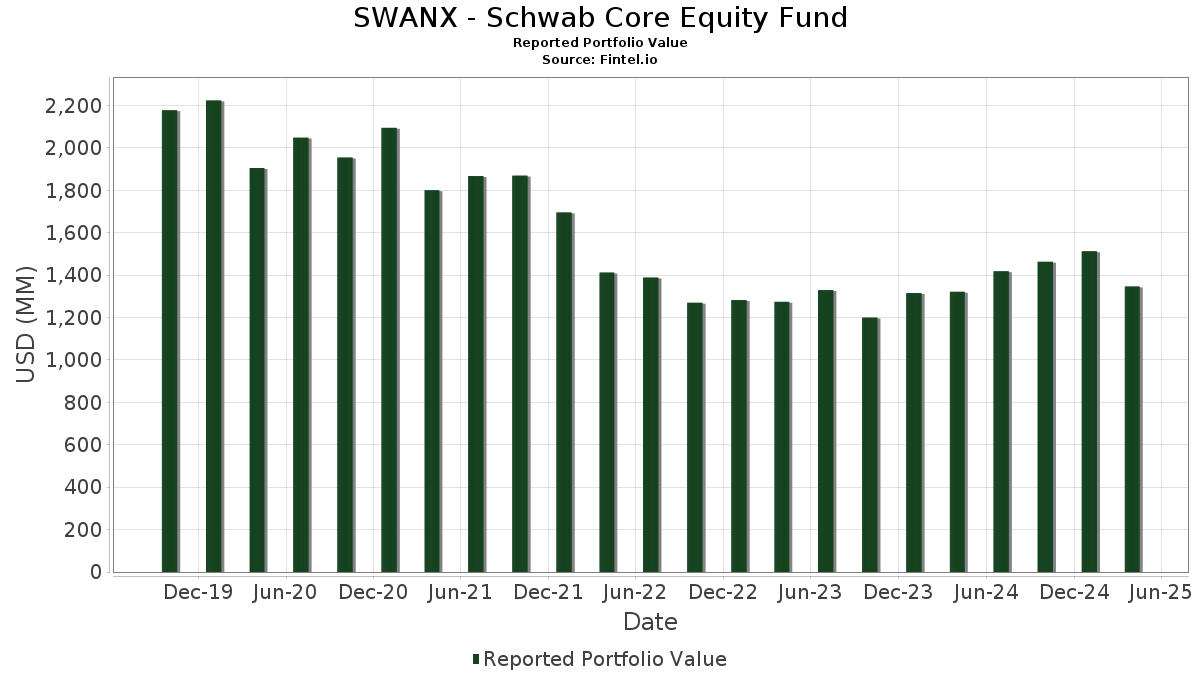
| Valeur du portefeuille | $ 1 346 171 761 |
| Positions actuelles | 53 |
Dernières positions, performances, ASG (à partir des dépôts 13F, 13D)
SWANX - Schwab Core Equity Fund a déclaré un total de 53 positions dans ses derniers dépôts auprès de la SEC. La valeur la plus récente du portefeuille est calculée à 1 346 171 761 USD. Les actifs sous gestion réels (ASG) sont cette valeur plus les liquidités (qui ne sont pas divulguées). Les principales positions de SWANX - Schwab Core Equity Fund sont Microsoft Corporation (US:MSFT) , NVIDIA Corporation (US:NVDA) , Apple Inc. (US:AAPL) , Alphabet Inc. (US:GOOGL) , and Amazon.com, Inc. (US:AMZN) . Les nouvelles positions de SWANX - Schwab Core Equity Fund incluent BlackRock, Inc. (US:BLK) , Manhattan Associates, Inc. (US:MANH) , .
Meilleures augmentations ce trimestre
Nous utilisons la variation de l'allocation du portefeuille car il s'agit de l'indicateur le plus significatif. Les changements peuvent être dus à des transactions ou à des variations de prix des actions.
| Titre | Actions (en millions) |
Valeur ($ en millions) |
% du portefeuille | ΔPortefeuille % |
|---|---|---|---|---|
| 0,07 | 30,29 | 2,2511 | 1,7737 | |
| 0,21 | 14,28 | 1,0615 | 1,0615 | |
| 0,01 | 10,80 | 0,8027 | 0,8027 | |
| 0,11 | 20,57 | 1,5290 | 0,7584 | |
| 0,32 | 124,72 | 9,2698 | 0,5595 | |
| 0,04 | 38,39 | 2,8531 | 0,5497 | |
| 0,04 | 7,13 | 0,5298 | 0,5298 | |
| 0,02 | 9,64 | 0,7168 | 0,5157 | |
| 0,11 | 31,42 | 2,3355 | 0,5075 | |
| 0,24 | 25,81 | 1,9186 | 0,3626 |
Principales baisses ce trimestre
Nous utilisons la variation de l'allocation du portefeuille car il s'agit de l'indicateur le plus significatif. Les changements peuvent être dus à des transactions ou à des variations de prix des actions.
| Titre | Actions (en millions) |
Valeur ($ en millions) |
% du portefeuille | ΔPortefeuille % |
|---|---|---|---|---|
| 0,32 | 59,48 | 4,4210 | -1,8101 | |
| 0,04 | 20,99 | 1,5600 | -1,1610 | |
| 0,40 | 63,08 | 4,6886 | -0,7015 | |
| 0,56 | 37,13 | 2,7594 | -0,5626 | |
| 0,11 | 58,93 | 4,3801 | -0,5400 | |
| 0,13 | 20,00 | 1,4866 | -0,4165 | |
| 0,02 | 7,16 | 0,5323 | -0,4074 | |
| 0,05 | 10,93 | 0,8120 | -0,3643 | |
| 0,05 | 19,71 | 1,4651 | -0,3616 | |
| 0,08 | 14,71 | 1,0932 | -0,2671 |
Déclarations 13F et dépôts de fonds
Ce formulaire a été déposé le 2025-06-24 pour la période de déclaration 2025-04-30. Cliquez sur l'icône du lien pour voir l'historique complet des transactions.
Mettre à niveau pour débloquer les données premium et exporter vers Excel ![]() .
.
| Titre | Type | Prix moyen de l'action | Actions (en millions) |
ΔActions (%) |
ΔActions (%) |
Valeur ($ en millions) |
Portefeuille (%) |
ΔPortefeuille (%) |
|
|---|---|---|---|---|---|---|---|---|---|
| MSFT / Microsoft Corporation | 0,32 | 0,00 | 124,72 | -4,77 | 9,2698 | 0,5595 | |||
| NVDA / NVIDIA Corporation | 0,81 | 0,00 | 88,59 | -9,29 | 6,5849 | 0,0894 | |||
| AAPL / Apple Inc. | 0,39 | 0,00 | 82,41 | -9,96 | 6,1255 | 0,0381 | |||
| GOOGL / Alphabet Inc. | 0,40 | 0,00 | 63,08 | -22,16 | 4,6886 | -0,7015 | |||
| AMZN / Amazon.com, Inc. | 0,32 | -18,18 | 59,48 | -36,51 | 4,4210 | -1,8101 | |||
| META / Meta Platforms, Inc. | 0,11 | 0,00 | 58,93 | -20,34 | 4,3801 | -0,5400 | |||
| FIS / Fidelity National Information Services, Inc. | 0,63 | 0,00 | 49,77 | -3,18 | 3,6994 | 0,2804 | |||
| AVGO / Broadcom Inc. | 0,23 | 0,00 | 43,50 | -13,02 | 3,2331 | -0,0928 | |||
| XOM / Exxon Mobil Corporation | 0,38 | 0,00 | 39,87 | -1,12 | 2,9631 | 0,2815 | |||
| V / Visa Inc. | 0,11 | -15,15 | 39,48 | -14,23 | 2,9345 | -0,1270 | |||
| LLY / Eli Lilly and Company | 0,04 | 0,00 | 38,39 | 10,84 | 2,8531 | 0,5497 | |||
| PYPL / PayPal Holdings, Inc. | 0,56 | 0,00 | 37,13 | -25,67 | 2,7594 | -0,5626 | |||
| PGR / The Progressive Corporation | 0,11 | 0,00 | 31,42 | 14,32 | 2,3355 | 0,5075 | |||
| UNH / UnitedHealth Group Incorporated | 0,07 | 494,98 | 30,29 | 333,71 | 2,2511 | 1,7737 | |||
| WEC / WEC Energy Group, Inc. | 0,24 | 0,00 | 25,81 | 10,34 | 1,9186 | 0,3626 | |||
| TJX / The TJX Companies, Inc. | 0,20 | 0,00 | 25,55 | 3,12 | 1,8988 | 0,2511 | |||
| CRM / Salesforce, Inc. | 0,09 | 0,00 | 24,32 | -21,36 | 1,8074 | -0,2492 | |||
| WMT / Walmart Inc. | 0,22 | 0,00 | 21,23 | -0,93 | 1,5777 | 0,1527 | |||
| ISRG / Intuitive Surgical, Inc. | 0,04 | -43,12 | 20,99 | -48,70 | 1,5600 | -1,1610 | |||
| STZ / Constellation Brands, Inc. | 0,11 | 71,16 | 20,57 | 77,54 | 1,5290 | 0,7584 | |||
| RSG / Republic Services, Inc. | 0,08 | 0,00 | 20,20 | 15,62 | 1,5011 | 0,3394 | |||
| JNJ / Johnson & Johnson | 0,13 | -31,96 | 20,00 | -30,10 | 1,4866 | -0,4165 | |||
| TMO / Thermo Fisher Scientific Inc. | 0,05 | 0,00 | 19,71 | -28,23 | 1,4651 | -0,3616 | |||
| BSX / Boston Scientific Corporation | 0,19 | 0,00 | 19,06 | 0,50 | 1,4170 | 0,1553 | |||
| KVUE / Kenvue Inc. | 0,79 | 0,00 | 18,74 | 10,85 | 1,3928 | 0,2685 | |||
| EOG / EOG Resources, Inc. | 0,16 | 0,00 | 17,86 | -12,29 | 1,3272 | -0,0268 | |||
| LIN / Linde plc | 0,04 | 0,00 | 17,39 | 1,59 | 1,2929 | 0,1541 | |||
| CAT / Caterpillar Inc. | 0,05 | 0,00 | 16,26 | -16,74 | 1,2083 | -0,0903 | |||
| PANW / Palo Alto Networks, Inc. | 0,08 | -29,05 | 14,71 | -28,09 | 1,0932 | -0,2671 | |||
| UBER / Uber Technologies, Inc. | 0,18 | -32,41 | 14,66 | -18,09 | 1,0896 | -0,1008 | |||
| NEE / NextEra Energy, Inc. | 0,21 | 14,28 | 1,0615 | 1,0615 | |||||
| MS / Morgan Stanley | 0,12 | 0,00 | 14,26 | -16,62 | 1,0603 | -0,0776 | |||
| DXCM / DexCom, Inc. | 0,20 | 0,00 | 14,07 | -17,79 | 1,0460 | -0,0926 | |||
| ASML / ASML Holding N.V. - Depositary Receipt (Common Stock) | 0,02 | 0,00 | 13,86 | -9,63 | 1,0304 | 0,0101 | |||
| ROL / Rollins, Inc. | 0,24 | -28,90 | 13,61 | -17,94 | 1,0113 | -0,0915 | |||
| AOS / A. O. Smith Corporation | 0,19 | 0,00 | 12,86 | 0,83 | 0,9555 | 0,1076 | |||
| LRLCY / L'Oréal S.A. - Depositary Receipt (Common Stock) | 0,14 | 0,00 | 12,39 | 18,84 | 0,9207 | 0,2275 | |||
| ROK / Rockwell Automation, Inc. | 0,05 | 0,00 | 12,36 | -11,04 | 0,9188 | -0,0054 | |||
| CME / CME Group Inc. | 0,04 | 0,00 | 11,50 | 17,15 | 0,8546 | 0,2018 | |||
| ACN / Accenture plc | 0,04 | 0,00 | 11,11 | -22,29 | 0,8261 | -0,1251 | |||
| BDX / Becton, Dickinson and Company | 0,05 | -26,15 | 10,93 | -38,23 | 0,8120 | -0,3643 | |||
| BLK / BlackRock, Inc. | 0,01 | 10,80 | 0,8027 | 0,8027 | |||||
| FAST / Fastenal Company | 0,12 | 0,00 | 9,96 | 10,55 | 0,7401 | 0,1411 | |||
| ZTS / Zoetis Inc. | 0,06 | 0,00 | 9,68 | -8,49 | 0,7194 | 0,0160 | |||
| MSI / Motorola Solutions, Inc. | 0,02 | 30,55 | 9,64 | 156,74 | 0,7168 | 0,5157 | |||
| VRSN / VeriSign, Inc. | 0,03 | -33,51 | 9,23 | 4,98 | 0,6864 | 0,0638 | |||
| PSA / Public Storage | 0,03 | 0,00 | 8,08 | 0,65 | 0,6008 | 0,0667 | |||
| MMC / Marsh & McLennan Companies, Inc. | 0,03 | 0,00 | 7,83 | 3,97 | 0,5817 | 0,0810 | |||
| CNH / CNH Industrial N.V. | 0,67 | 0,00 | 7,75 | -10,17 | 0,5763 | 0,0022 | |||
| PH / Parker-Hannifin Corporation | 0,01 | 0,00 | 7,46 | -14,42 | 0,5548 | -0,0253 | |||
| IT / Gartner, Inc. | 0,02 | -74,35 | 7,16 | -59,21 | 0,5323 | -0,4074 | |||
| MANH / Manhattan Associates, Inc. | 0,04 | 7,13 | 0,5298 | 0,5298 | |||||
| GVMXX / State Street Institutional Investment Trust - State Street Institutional US Govt Money Market Fnd Premier Cls | 6,11 | -29,57 | 6,11 | -29,57 | 0,4541 | -0,1228 |