Statistiques de base
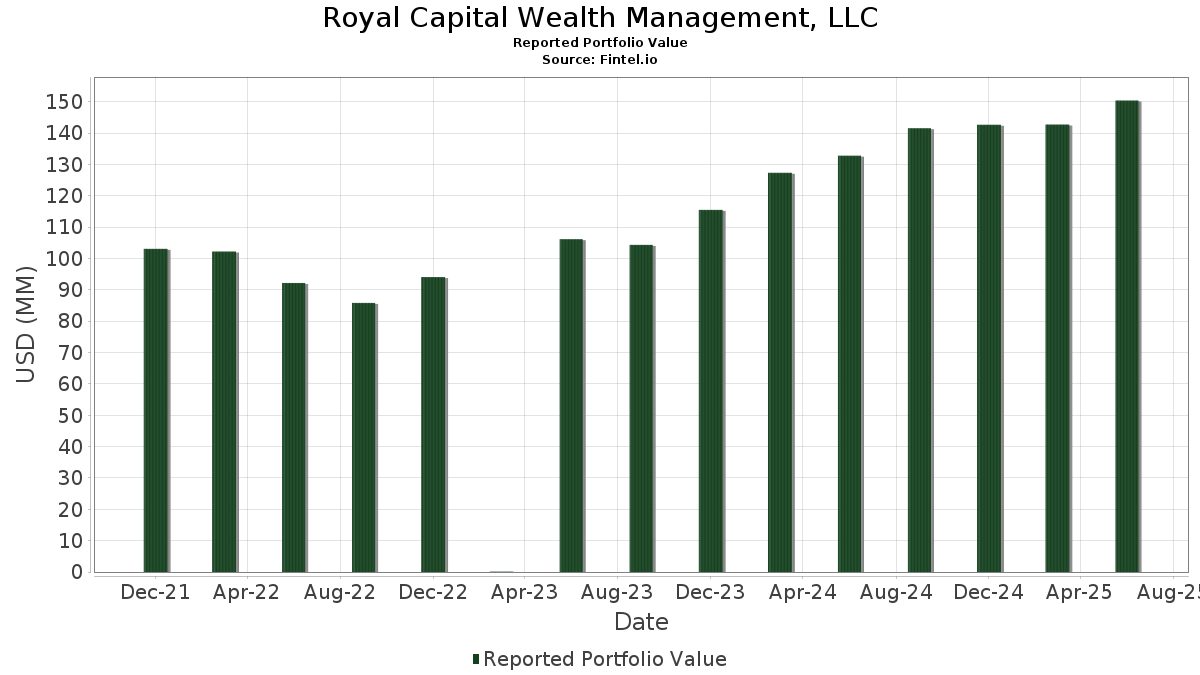
| Valeur du portefeuille | $ 150 361 959 |
| Positions actuelles | 86 |
Dernières positions, performances, ASG (à partir des dépôts 13F, 13D)
Royal Capital Wealth Management, LLC a déclaré un total de 86 positions dans ses derniers dépôts auprès de la SEC. La valeur la plus récente du portefeuille est calculée à 150 361 959 USD. Les actifs sous gestion réels (ASG) sont cette valeur plus les liquidités (qui ne sont pas divulguées). Les principales positions de Royal Capital Wealth Management, LLC sont SPDR S&P 500 ETF (US:SPY) , Mastercard Incorporated (US:MA) , Microsoft Corporation (US:MSFT) , Berkshire Hathaway Inc. (US:BRK.B) , and NVIDIA Corporation (US:NVDA) . Les nouvelles positions de Royal Capital Wealth Management, LLC incluent iShares Trust - iShares U.S. Financial Services ETF (US:IYG) , .
Meilleures augmentations ce trimestre
Nous utilisons la variation de l'allocation du portefeuille car il s'agit de l'indicateur le plus significatif. Les changements peuvent être dus à des transactions ou à des variations de prix des actions.
| Titre | Actions (en millions) |
Valeur ($ en millions) |
% du portefeuille | ΔPortefeuille % |
|---|---|---|---|---|
| 0,06 | 8,86 | 5,8914 | 1,7167 | |
| 0,02 | 10,14 | 6,7439 | 1,3849 | |
| 0,03 | 19,50 | 12,9707 | 0,6341 | |
| 0,02 | 6,36 | 4,2314 | 0,4604 | |
| 0,01 | 4,90 | 3,2590 | 0,3325 | |
| 0,02 | 4,90 | 3,2605 | 0,2811 | |
| 0,00 | 0,72 | 0,4821 | 0,1736 | |
| 0,00 | 1,23 | 0,8203 | 0,1454 | |
| 0,00 | 0,21 | 0,1366 | 0,1366 | |
| 0,00 | 0,20 | 0,1334 | 0,1334 |
Principales baisses ce trimestre
Nous utilisons la variation de l'allocation du portefeuille car il s'agit de l'indicateur le plus significatif. Les changements peuvent être dus à des transactions ou à des variations de prix des actions.
| Titre | Actions (en millions) |
Valeur ($ en millions) |
% du portefeuille | ΔPortefeuille % |
|---|---|---|---|---|
| 0,01 | 2,01 | 1,3384 | -1,0214 | |
| 0,02 | 4,15 | 2,7617 | -0,9649 | |
| 0,02 | 8,99 | 5,9777 | -0,9278 | |
| 0,03 | 2,81 | 1,8668 | -0,3017 | |
| 0,00 | 2,19 | 1,4541 | -0,2245 | |
| 0,01 | 1,79 | 1,1894 | -0,2233 | |
| 0,00 | 2,83 | 1,8840 | -0,2192 | |
| 0,02 | 11,34 | 7,5423 | -0,2092 | |
| 0,01 | 1,88 | 1,2501 | -0,1643 | |
| 0,02 | 6,15 | 4,0917 | -0,1616 |
Déclarations 13F et dépôts de fonds
Ce formulaire a été déposé le 2025-08-14 pour la période de déclaration 2025-06-30. Cliquez sur l'icône du lien pour voir l'historique complet des transactions.
Mettre à niveau pour débloquer les données premium et exporter vers Excel ![]() .
.
| Titre | Type | Prix moyen de l'action | Actions (en millions) |
ΔActions (%) |
ΔActions (%) |
Valeur ($ en millions) |
Portefeuille (%) |
ΔPortefeuille (%) |
|
|---|---|---|---|---|---|---|---|---|---|
| SPY / SPDR S&P 500 ETF | 0,03 | 0,30 | 19,50 | 10,79 | 12,9707 | 0,6341 | |||
| MA / Mastercard Incorporated | 0,02 | 0,00 | 11,34 | 2,52 | 7,5423 | -0,2092 | |||
| MSFT / Microsoft Corporation | 0,02 | 0,07 | 10,14 | 32,60 | 6,7439 | 1,3849 | |||
| BRK.B / Berkshire Hathaway Inc. | 0,02 | 0,00 | 8,99 | -8,79 | 5,9777 | -0,9278 | |||
| NVDA / NVIDIA Corporation | 0,06 | 2,01 | 8,86 | 48,70 | 5,8914 | 1,7167 | |||
| JPM / JPMorgan Chase & Co. | 0,02 | 0,04 | 6,36 | 18,23 | 4,2314 | 0,4604 | |||
| V / Visa Inc. | 0,02 | 0,05 | 6,15 | 1,37 | 4,0917 | -0,1616 | |||
| AMZN / Amazon.com, Inc. | 0,02 | 0,00 | 4,90 | 15,31 | 3,2605 | 0,2811 | |||
| QQQ / Invesco QQQ Trust, Series 1 | 0,01 | -0,26 | 4,90 | 17,34 | 3,2590 | 0,3325 | |||
| GOOGL / Alphabet Inc. | 0,03 | -5,69 | 4,46 | 7,47 | 2,9651 | 0,0582 | |||
| AAPL / Apple Inc. | 0,02 | -15,46 | 4,15 | -21,91 | 2,7617 | -0,9649 | |||
| LLY / Eli Lilly and Company | 0,00 | 0,00 | 2,83 | -5,63 | 1,8840 | -0,2192 | |||
| XOM / Exxon Mobil Corporation | 0,03 | 0,07 | 2,81 | -9,31 | 1,8668 | -0,3017 | |||
| BX / Blackstone Inc. | 0,02 | 0,06 | 2,64 | 7,10 | 1,7551 | 0,0279 | |||
| NOBL / ProShares Trust - ProShares S&P 500 Dividend Aristocrats ETF | 0,03 | 0,02 | 2,56 | -1,43 | 1,7014 | -0,1173 | |||
| GOOG / Alphabet Inc. | 0,01 | 0,00 | 2,48 | 13,55 | 1,6501 | 0,1189 | |||
| WMT / Walmart Inc. | 0,02 | 0,19 | 2,21 | 11,56 | 1,4704 | 0,0821 | |||
| BRK.A / Berkshire Hathaway Inc. | 0,00 | 0,00 | 2,19 | -8,73 | 1,4541 | -0,2245 | |||
| BINC / BlackRock ETF Trust II - iShares Flexible Income Active ETF | 0,04 | 0,23 | 2,13 | 1,09 | 1,4190 | -0,0598 | |||
| UNH / UnitedHealth Group Incorporated | 0,01 | 0,33 | 2,01 | -40,24 | 1,3384 | -1,0214 | |||
| MCD / McDonald's Corporation | 0,01 | -0,42 | 1,88 | -6,89 | 1,2501 | -0,1643 | |||
| ABBV / AbbVie Inc. | 0,01 | 0,14 | 1,79 | -11,31 | 1,1894 | -0,2233 | |||
| ADP / Automatic Data Processing, Inc. | 0,01 | 0,00 | 1,71 | 0,95 | 1,1358 | -0,0497 | |||
| CME / CME Group Inc. | 0,01 | 0,00 | 1,46 | 3,92 | 0,9707 | -0,0138 | |||
| REGL / ProShares Trust - ProShares S&P Midcap 400 Dividend Aristocrats ETF | 0,02 | 0,05 | 1,36 | 1,12 | 0,9016 | -0,0376 | |||
| JNJ / Johnson & Johnson | 0,01 | 0,05 | 1,27 | -7,85 | 0,8432 | -0,1210 | |||
| SCHD / Schwab Strategic Trust - Schwab U.S. Dividend Equity ETF | 0,05 | 0,20 | 1,26 | -4,99 | 0,8361 | -0,0915 | |||
| META / Meta Platforms, Inc. | 0,00 | 0,00 | 1,23 | 28,04 | 0,8203 | 0,1454 | |||
| PG / The Procter & Gamble Company | 0,01 | 0,10 | 1,15 | -6,37 | 0,7623 | -0,0960 | |||
| KO / The Coca-Cola Company | 0,02 | 0,05 | 1,07 | -1,20 | 0,7108 | -0,0470 | |||
| LOW / Lowe's Companies, Inc. | 0,00 | 0,13 | 1,06 | -4,77 | 0,7039 | -0,0749 | |||
| WFC / Wells Fargo & Company | 0,01 | 0,16 | 1,05 | 11,83 | 0,6977 | 0,0400 | |||
| AMGN / Amgen Inc. | 0,00 | 0,00 | 0,82 | -10,33 | 0,5428 | -0,0953 | |||
| SMDV / ProShares Trust - ProShares Russell 2000 Dividend Growers ETF | 0,01 | 0,11 | 0,81 | -0,62 | 0,5375 | -0,0328 | |||
| LNG / Cheniere Energy, Inc. | 0,00 | 0,03 | 0,79 | 5,33 | 0,5264 | -0,0005 | |||
| NEE / NextEra Energy, Inc. | 0,01 | 0,00 | 0,78 | -2,00 | 0,5214 | -0,0396 | |||
| PEP / PepsiCo, Inc. | 0,01 | 0,82 | 0,74 | -11,23 | 0,4944 | -0,0924 | |||
| AVGO / Broadcom Inc. | 0,00 | 0,00 | 0,72 | 64,55 | 0,4821 | 0,1736 | |||
| EMR / Emerson Electric Co. | 0,01 | 0,00 | 0,72 | 21,59 | 0,4798 | 0,0641 | |||
| COST / Costco Wholesale Corporation | 0,00 | 0,00 | 0,71 | 4,55 | 0,4748 | -0,0031 | |||
| SPGI / S&P Global Inc. | 0,00 | 0,00 | 0,69 | 3,79 | 0,4559 | -0,0070 | |||
| PM / Philip Morris International Inc. | 0,00 | -1,38 | 0,65 | 13,09 | 0,4316 | 0,0297 | |||
| GE / General Electric Company | 0,00 | 0,04 | 0,61 | 28,84 | 0,4070 | 0,0736 | |||
| KVUE / Kenvue Inc. | 0,03 | -1,26 | 0,60 | -13,89 | 0,3963 | -0,0882 | |||
| CMG / Chipotle Mexican Grill, Inc. | 0,01 | -1,44 | 0,58 | 10,15 | 0,3828 | 0,0168 | |||
| DIS / The Walt Disney Company | 0,00 | 0,00 | 0,54 | 25,70 | 0,3580 | 0,0578 | |||
| CSCO / Cisco Systems, Inc. | 0,01 | 0,00 | 0,51 | 12,31 | 0,3404 | 0,0214 | |||
| ABT / Abbott Laboratories | 0,00 | 0,08 | 0,50 | 2,66 | 0,3333 | -0,0090 | |||
| QCOM / QUALCOMM Incorporated | 0,00 | 0,13 | 0,49 | 3,79 | 0,3283 | -0,0050 | |||
| XLF / The Select Sector SPDR Trust - The Financial Select Sector SPDR Fund | 0,01 | 0,02 | 0,49 | 5,19 | 0,3237 | -0,0006 | |||
| HD / The Home Depot, Inc. | 0,00 | 0,23 | 0,48 | 0,21 | 0,3209 | -0,0164 | |||
| NUE / Nucor Corporation | 0,00 | 0,17 | 0,45 | 7,95 | 0,2981 | 0,0068 | |||
| TXN / Texas Instruments Incorporated | 0,00 | 0,00 | 0,44 | 15,71 | 0,2941 | 0,0259 | |||
| SCHB / Schwab Strategic Trust - Schwab U.S. Broad Market ETF | 0,02 | 0,03 | 0,43 | 10,54 | 0,2865 | 0,0138 | |||
| CAT / Caterpillar Inc. | 0,00 | 0,00 | 0,43 | 17,96 | 0,2840 | 0,0298 | |||
| EUDV / ProShares Trust - ProShares MSCI Europe Dividend Growers ETF | 0,01 | 0,00 | 0,42 | 9,95 | 0,2800 | 0,0119 | |||
| ORCL / Oracle Corporation | 0,00 | 0,00 | 0,42 | 56,77 | 0,2774 | 0,0905 | |||
| PLTR / Palantir Technologies Inc. | 0,00 | -6,82 | 0,40 | 50,56 | 0,2675 | 0,0802 | |||
| ACN / Accenture plc | 0,00 | 0,00 | 0,38 | -4,30 | 0,2521 | -0,0252 | |||
| KMI / Kinder Morgan, Inc. | 0,01 | 0,67 | 0,35 | 3,85 | 0,2335 | -0,0037 | |||
| CVX / Chevron Corporation | 0,00 | 0,60 | 0,34 | -13,85 | 0,2235 | -0,0500 | |||
| POWW / Outdoor Holding Company | 0,25 | 0,00 | 0,32 | -7,16 | 0,2159 | -0,0294 | |||
| CAH / Cardinal Health, Inc. | 0,00 | -6,92 | 0,32 | 13,83 | 0,2135 | 0,0153 | |||
| MMM / 3M Company | 0,00 | -0,83 | 0,31 | 3,00 | 0,2056 | -0,0052 | |||
| MPC / Marathon Petroleum Corporation | 0,00 | 0,00 | 0,31 | 14,07 | 0,2055 | 0,0156 | |||
| DUK / Duke Energy Corporation | 0,00 | -1,91 | 0,30 | -5,02 | 0,2015 | -0,0222 | |||
| BAC / Bank of America Corporation | 0,01 | 0,11 | 0,29 | 13,28 | 0,1934 | 0,0139 | |||
| SEIC / SEI Investments Company | 0,00 | 0,03 | 0,29 | 15,73 | 0,1913 | 0,0172 | |||
| NTES / NetEase, Inc. - Depositary Receipt (Common Stock) | 0,00 | 0,00 | 0,27 | 31,22 | 0,1790 | 0,0348 | |||
| CRH / CRH plc | 0,00 | 0,00 | 0,27 | 4,31 | 0,1771 | -0,0017 | |||
| FANG / Diamondback Energy, Inc. | 0,00 | 15,62 | 0,25 | -0,39 | 0,1691 | -0,0102 | |||
| SLV / iShares Silver Trust | 0,01 | 0,00 | 0,25 | 5,86 | 0,1688 | 0,0008 | |||
| UPS / United Parcel Service, Inc. | 0,00 | -4,66 | 0,25 | -12,50 | 0,1677 | -0,0343 | |||
| GM / General Motors Company | 0,01 | 0,14 | 0,25 | 4,62 | 0,1660 | -0,0009 | |||
| IBM / International Business Machines Corporation | 0,00 | 0,00 | 0,25 | 18,57 | 0,1657 | 0,0184 | |||
| IYF / iShares Trust - iShares U.S. Financials ETF | 0,00 | 0,00 | 0,24 | 7,11 | 0,1609 | 0,0028 | |||
| AFL / Aflac Incorporated | 0,00 | 0,09 | 0,24 | -5,14 | 0,1602 | -0,0176 | |||
| NSC / Norfolk Southern Corporation | 0,00 | 0,00 | 0,23 | 8,33 | 0,1559 | 0,0039 | |||
| VV / Vanguard Index Funds - Vanguard Large-Cap ETF | 0,00 | 0,00 | 0,23 | 10,95 | 0,1552 | 0,0079 | |||
| COP / ConocoPhillips | 0,00 | 0,12 | 0,22 | -14,73 | 0,1470 | -0,0340 | |||
| MDT / Medtronic plc | 0,00 | 0,00 | 0,22 | -3,14 | 0,1443 | -0,0124 | |||
| IYG / iShares Trust - iShares U.S. Financial Services ETF | 0,00 | 0,21 | 0,1366 | 0,1366 | |||||
| GHI / Greystone Housing Impact Investors LP | 0,02 | -13,59 | 0,20 | -20,70 | 0,1355 | -0,0445 | |||
| DOV / Dover Corporation | 0,00 | 0,20 | 0,1334 | 0,1334 | |||||
| CDE / Coeur Mining, Inc. | 0,02 | 0,00 | 0,16 | 49,04 | 0,1037 | 0,0307 | |||
| WRAP / Wrap Technologies, Inc. | 0,05 | 0,00 | 0,09 | -8,60 | 0,0567 | -0,0088 | |||
| OKE / ONEOK, Inc. | 0,00 | -100,00 | 0,00 | 0,0000 | |||||
| T / AT&T Inc. | 0,00 | -100,00 | 0,00 | 0,0000 | |||||
| CB / Chubb Limited | 0,00 | -100,00 | 0,00 | 0,0000 | |||||
| BMY / Bristol-Myers Squibb Company | 0,00 | -100,00 | 0,00 | 0,0000 |