Statistiques de base
| Valeur du portefeuille | $ 1 674 963 251 |
| Positions actuelles | 74 |
Dernières positions, performances, ASG (à partir des dépôts 13F, 13D)
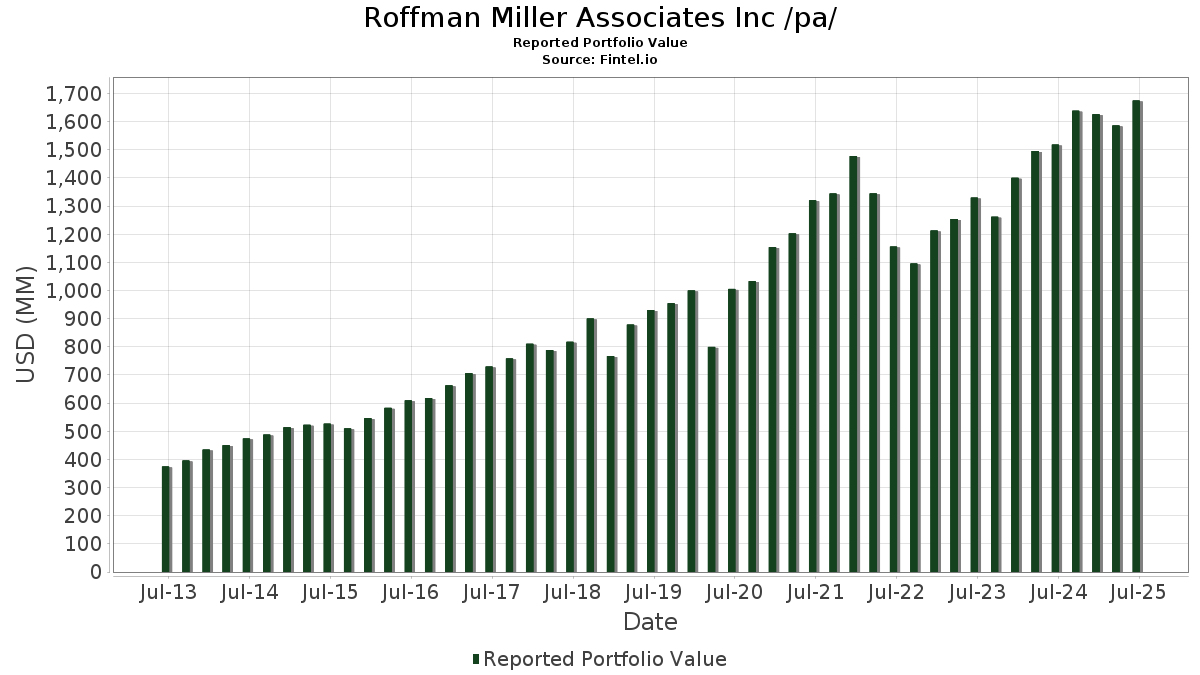
Roffman Miller Associates Inc /pa/ a déclaré un total de 74 positions dans ses derniers dépôts auprès de la SEC. La valeur la plus récente du portefeuille est calculée à 1 674 963 251 USD. Les actifs sous gestion réels (ASG) sont cette valeur plus les liquidités (qui ne sont pas divulguées). Les principales positions de Roffman Miller Associates Inc /pa/ sont Microsoft Corporation (US:MSFT) , Apple Inc. (US:AAPL) , JPMorgan Chase & Co. (US:JPM) , Alphabet Inc. (US:GOOGL) , and Amazon.com, Inc. (US:AMZN) .
Meilleures augmentations ce trimestre
Nous utilisons la variation de l'allocation du portefeuille car il s'agit de l'indicateur le plus significatif. Les changements peuvent être dus à des transactions ou à des variations de prix des actions.
| Titre | Actions (en millions) |
Valeur ($ en millions) |
% du portefeuille | ΔPortefeuille % |
|---|---|---|---|---|
| 0,25 | 125,34 | 7,4829 | 1,4862 | |
| 0,51 | 50,60 | 3,0209 | 0,8827 | |
| 0,26 | 74,57 | 4,4522 | 0,4390 | |
| 0,27 | 60,01 | 3,5830 | 0,4053 | |
| 0,42 | 74,36 | 4,4393 | 0,3950 | |
| 0,17 | 54,40 | 3,2478 | 0,3483 | |
| 0,23 | 29,14 | 1,7398 | 0,2922 | |
| 0,03 | 25,17 | 1,5027 | 0,2216 | |
| 0,25 | 51,00 | 3,0451 | 0,2158 | |
| 0,08 | 24,29 | 1,4502 | 0,0995 |
Principales baisses ce trimestre
Nous utilisons la variation de l'allocation du portefeuille car il s'agit de l'indicateur le plus significatif. Les changements peuvent être dus à des transactions ou à des variations de prix des actions.
| Titre | Actions (en millions) |
Valeur ($ en millions) |
% du portefeuille | ΔPortefeuille % |
|---|---|---|---|---|
| 0,46 | 93,80 | 5,5998 | -1,1176 | |
| 0,16 | 45,36 | 2,7080 | -0,3467 | |
| 0,27 | 40,69 | 2,4292 | -0,3246 | |
| 0,28 | 27,34 | 1,6324 | -0,2956 | |
| 0,38 | 39,91 | 2,3829 | -0,2757 | |
| 0,26 | 34,26 | 2,0455 | -0,2595 | |
| 0,39 | 43,21 | 2,5800 | -0,2459 | |
| 0,38 | 28,68 | 1,7124 | -0,2431 | |
| 0,04 | 15,79 | 0,9429 | -0,2303 | |
| 0,13 | 39,05 | 2,3311 | -0,1956 |
Déclarations 13F et dépôts de fonds
Ce formulaire a été déposé le 2025-08-05 pour la période de déclaration 2025-06-30. Cliquez sur l'icône du lien pour voir l'historique complet des transactions.
Mettre à niveau pour débloquer les données premium et exporter vers Excel ![]() .
.
| Titre | Type | Prix moyen de l'action | Actions (en millions) |
ΔActions (%) |
ΔActions (%) |
Valeur ($ en millions) |
Portefeuille (%) |
ΔPortefeuille (%) |
|
|---|---|---|---|---|---|---|---|---|---|
| MSFT / Microsoft Corporation | 0,25 | -0,57 | 125,34 | 31,76 | 7,4829 | 1,4862 | |||
| AAPL / Apple Inc. | 0,46 | -4,70 | 93,80 | -11,98 | 5,5998 | -1,1176 | |||
| JPM / JPMorgan Chase & Co. | 0,26 | -0,89 | 74,57 | 17,14 | 4,4522 | 0,4390 | |||
| GOOGL / Alphabet Inc. | 0,42 | 1,70 | 74,36 | 15,90 | 4,4393 | 0,3950 | |||
| AMZN / Amazon.com, Inc. | 0,27 | 3,25 | 60,01 | 19,05 | 3,5830 | 0,4053 | |||
| AXP / American Express Company | 0,17 | -0,24 | 54,40 | 18,27 | 3,2478 | 0,3483 | |||
| ADP / Automatic Data Processing, Inc. | 0,18 | 0,24 | 54,00 | 1,18 | 3,2238 | -0,1404 | |||
| SYK / Stryker Corporation | 0,13 | 0,13 | 51,32 | 6,42 | 3,0639 | 0,0240 | |||
| TXN / Texas Instruments Incorporated | 0,25 | -1,64 | 51,00 | 13,64 | 3,0451 | 0,2158 | |||
| APH / Amphenol Corporation | 0,51 | -0,92 | 50,60 | 49,17 | 3,0209 | 0,8827 | |||
| HD / The Home Depot, Inc. | 0,14 | 1,40 | 50,47 | 1,44 | 3,0133 | -0,1230 | |||
| MCD / McDonald's Corporation | 0,16 | 0,07 | 45,36 | -6,40 | 2,7080 | -0,3467 | |||
| V / Visa Inc. | 0,13 | -0,16 | 44,80 | 1,15 | 2,6748 | -0,1174 | |||
| RPM / RPM International Inc. | 0,39 | 1,52 | 43,21 | -3,60 | 2,5800 | -0,2459 | |||
| JNJ / Johnson & Johnson | 0,27 | 1,12 | 40,69 | -6,86 | 2,4292 | -0,3246 | |||
| HON / Honeywell International Inc. | 0,17 | -1,90 | 39,96 | 7,89 | 2,3856 | 0,0508 | |||
| AFL / Aflac Incorporated | 0,38 | -0,22 | 39,91 | -5,37 | 2,3829 | -0,2757 | |||
| CB / Chubb Limited | 0,13 | 1,54 | 39,05 | -2,59 | 2,3311 | -0,1956 | |||
| PEP / PepsiCo, Inc. | 0,26 | 6,40 | 34,26 | -6,30 | 2,0455 | -0,2595 | |||
| NDSN / Nordson Corporation | 0,15 | 1,26 | 33,01 | 7,61 | 1,9710 | 0,0371 | |||
| DIS / The Walt Disney Company | 0,23 | 1,00 | 29,14 | 26,90 | 1,7398 | 0,2922 | |||
| MKC / McCormick & Company, Incorporated | 0,38 | 0,38 | 28,68 | -7,54 | 1,7124 | -0,2431 | |||
| CHD / Church & Dwight Co., Inc. | 0,28 | 2,40 | 27,34 | -10,61 | 1,6324 | -0,2956 | |||
| AME / AMETEK, Inc. | 0,14 | 3,80 | 26,15 | 9,12 | 1,5612 | 0,0505 | |||
| BAC / Bank of America Corporation | 0,55 | -14,79 | 25,86 | -3,37 | 1,5440 | -0,1431 | |||
| ASML / ASML Holding N.V. - Depositary Receipt (Common Stock) | 0,03 | 2,41 | 25,17 | 23,85 | 1,5027 | 0,2216 | |||
| GD / General Dynamics Corporation | 0,08 | 5,95 | 24,29 | 13,36 | 1,4502 | 0,0995 | |||
| JCI / Johnson Controls International plc | 0,23 | -28,78 | 24,19 | -6,11 | 1,4444 | -0,1798 | |||
| EXPO / Exponent, Inc. | 0,31 | 0,65 | 23,37 | -7,24 | 1,3952 | -0,1928 | |||
| ACN / Accenture plc | 0,08 | 3,04 | 22,64 | -1,30 | 1,3516 | -0,0944 | |||
| ICE / Intercontinental Exchange, Inc. | 0,12 | 4,30 | 22,30 | 10,93 | 1,3313 | 0,0641 | |||
| CI / The Cigna Group | 0,07 | 7,17 | 21,57 | 7,68 | 1,2876 | 0,0251 | |||
| TJX / The TJX Companies, Inc. | 0,17 | 1,64 | 21,51 | 3,05 | 1,2842 | -0,0316 | |||
| CRM / Salesforce, Inc. | 0,08 | 11,43 | 20,98 | 13,23 | 1,2526 | 0,0845 | |||
| COST / Costco Wholesale Corporation | 0,02 | 4,39 | 19,95 | 9,25 | 1,1912 | 0,0400 | |||
| ADBE / Adobe Inc. | 0,05 | 5,23 | 17,95 | 6,16 | 1,0714 | 0,0057 | |||
| VZ / Verizon Communications Inc. | 0,39 | 0,37 | 17,07 | -4,25 | 1,0189 | -0,1047 | |||
| APD / Air Products and Chemicals, Inc. | 0,06 | -3,82 | 17,05 | -8,02 | 1,0181 | -0,1506 | |||
| XOM / Exxon Mobil Corporation | 0,15 | 20,93 | 16,68 | 9,61 | 0,9958 | 0,0365 | |||
| MRK / Merck & Co., Inc. | 0,21 | 2,61 | 16,25 | -9,50 | 0,9699 | -0,1618 | |||
| TMO / Thermo Fisher Scientific Inc. | 0,04 | 4,15 | 15,79 | -15,14 | 0,9429 | -0,2303 | |||
| PPL / PPL Corporation | 0,30 | 12,39 | 10,13 | 5,48 | 0,6048 | -0,0006 | |||
| DEO / Diageo plc - Depositary Receipt (Common Stock) | 0,09 | -8,51 | 9,23 | -11,96 | 0,5508 | -0,1098 | |||
| UGI / UGI Corporation | 0,25 | 14,21 | 8,99 | 25,78 | 0,5365 | 0,0861 | |||
| BA / The Boeing Company | 0,04 | -8,32 | 7,40 | 12,62 | 0,4417 | 0,0276 | |||
| ORCL / Oracle Corporation | 0,03 | -24,35 | 6,96 | 18,30 | 0,4157 | 0,0447 | |||
| DHR / Danaher Corporation | 0,03 | -6,97 | 6,68 | -10,36 | 0,3987 | -0,0709 | |||
| T / AT&T Inc. | 0,21 | 0,20 | 6,20 | 2,55 | 0,3701 | -0,0110 | |||
| META / Meta Platforms, Inc. | 0,01 | 0,20 | 5,27 | 28,34 | 0,3147 | 0,0558 | |||
| GOOG / Alphabet Inc. | 0,03 | -2,94 | 5,09 | 10,20 | 0,3039 | 0,0127 | |||
| STZ / Constellation Brands, Inc. | 0,03 | -7,45 | 4,48 | -17,96 | 0,2673 | -0,0767 | |||
| SPY / SPDR S&P 500 ETF | 0,01 | 3,36 | 4,18 | 14,18 | 0,2494 | 0,0187 | |||
| VONG / Vanguard Scottsdale Funds - Vanguard Russell 1000 Growth ETF | 0,04 | 0,12 | 3,91 | 17,83 | 0,2336 | 0,0243 | |||
| MMM / 3M Company | 0,02 | -8,35 | 3,79 | -5,02 | 0,2262 | -0,0252 | |||
| ARTNA / Artesian Resources Corporation | 0,11 | 17,50 | 3,60 | 20,81 | 0,2149 | 0,0270 | |||
| FDX / FedEx Corporation | 0,02 | -7,49 | 3,44 | -13,75 | 0,2052 | -0,0460 | |||
| CL / Colgate-Palmolive Company | 0,02 | -1,39 | 2,18 | -4,34 | 0,1304 | -0,0135 | |||
| LGLV / SPDR Series Trust - SPDR SSGA US Large Cap Low Volatility Index ETF | 0,01 | 0,40 | 2,11 | 0,72 | 0,1261 | -0,0061 | |||
| VTI / Vanguard Index Funds - Vanguard Total Stock Market ETF | 0,01 | -9,63 | 2,09 | -0,10 | 0,1246 | -0,0071 | |||
| IBM / International Business Machines Corporation | 0,01 | 0,90 | 2,05 | 19,64 | 0,1223 | 0,0143 | |||
| ALB / Albemarle Corporation | 0,03 | -30,98 | 1,88 | -39,94 | 0,1123 | -0,0851 | |||
| VIVA.X / Vanguard Index Funds - Vanguard Value ETF | 0,01 | 0,00 | 1,61 | 2,29 | 0,0961 | -0,0031 | |||
| MDT / Medtronic plc | 0,02 | -20,41 | 1,33 | -22,80 | 0,0797 | -0,0293 | |||
| KMB / Kimberly-Clark Corporation | 0,01 | -6,90 | 1,30 | -15,58 | 0,0773 | -0,0194 | |||
| VONV / Vanguard Scottsdale Funds - Vanguard Russell 1000 Value ETF | 0,01 | 0,42 | 1,24 | 3,59 | 0,0741 | -0,0014 | |||
| VEA / Vanguard Tax-Managed Funds - Vanguard FTSE Developed Markets ETF | 0,02 | 0,90 | 1,20 | 13,17 | 0,0718 | 0,0048 | |||
| NEE / NextEra Energy, Inc. | 0,02 | 1,53 | 1,04 | -0,57 | 0,0623 | -0,0039 | |||
| SCHG / Schwab Strategic Trust - Schwab U.S. Large-Cap Growth ETF | 0,03 | -0,78 | 0,98 | 15,67 | 0,0587 | 0,0051 | |||
| PFE / Pfizer Inc. | 0,03 | 22,10 | 0,63 | 16,88 | 0,0376 | 0,0036 | |||
| VBR / Vanguard Index Funds - Vanguard Small-Cap Value ETF | 0,00 | -3,69 | 0,52 | 0,78 | 0,0310 | -0,0015 | |||
| VTWG / Vanguard Scottsdale Funds - Vanguard Russell 2000 Growth ETF | 0,00 | 0,19 | 0,45 | 11,97 | 0,0268 | 0,0016 | |||
| SMLV / SPDR Series Trust - SPDR SSGA US Small Cap Low Volatility Index ETF | 0,00 | 0,55 | 0,37 | 2,23 | 0,0219 | -0,0007 | |||
| IWO / iShares Trust - iShares Russell 2000 Growth ETF | 0,00 | 1,49 | 0,35 | 13,59 | 0,0210 | 0,0015 | |||
| IWM / iShares Trust - iShares Russell 2000 ETF | 0,00 | 0,00 | 0,24 | 8,48 | 0,0145 | 0,0003 | |||
| DFS / Discover Financial Services | 0,00 | -100,00 | 0,00 | 0,0000 |