Statistiques de base
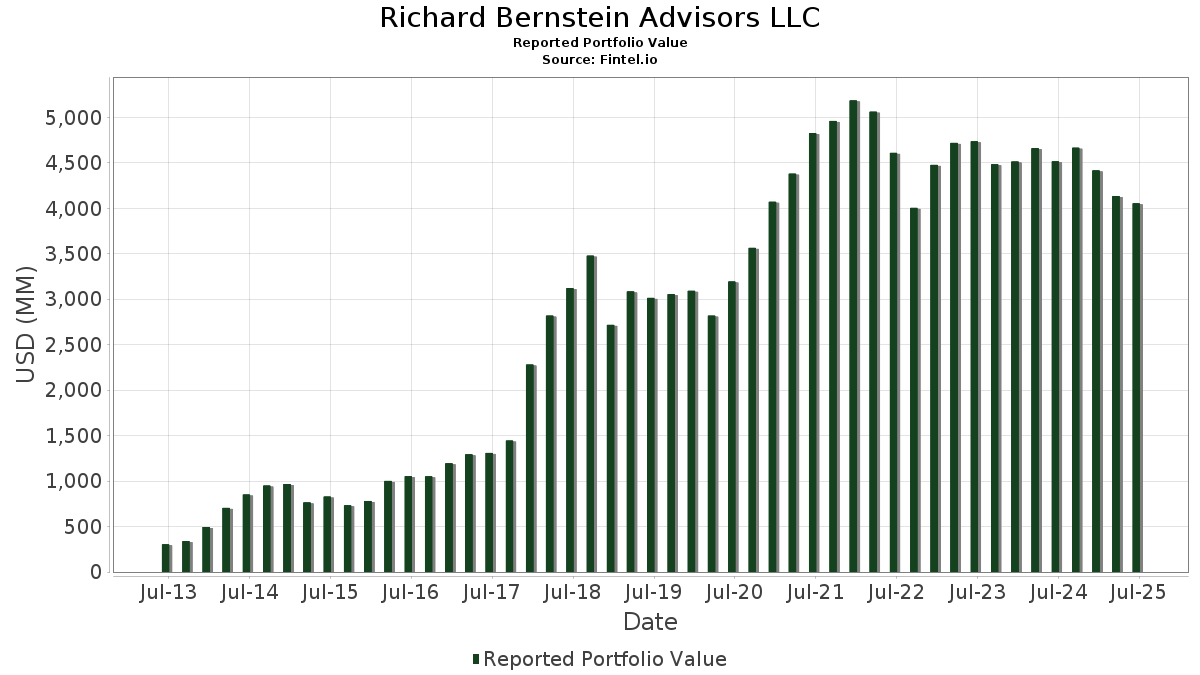
| Valeur du portefeuille | $ 4 052 455 858 |
| Positions actuelles | 212 |
Dernières positions, performances, ASG (à partir des dépôts 13F, 13D)
Richard Bernstein Advisors LLC a déclaré un total de 212 positions dans ses derniers dépôts auprès de la SEC. La valeur la plus récente du portefeuille est calculée à 4 052 455 858 USD. Les actifs sous gestion réels (ASG) sont cette valeur plus les liquidités (qui ne sont pas divulguées). Les principales positions de Richard Bernstein Advisors LLC sont Janus Detroit Street Trust - Janus Henderson Mortgage-Backed Securities ETF (US:JMBS) , iShares Trust - iShares MSCI Intl Quality Factor ETF (US:IQLT) , Vanguard Index Funds - Vanguard Value ETF (US:VTV) , Fidelity Covington Trust - Fidelity MSCI Information Technology Index ETF (US:FTEC) , and SPDR Series Trust - SPDR Portfolio Intermediate Term Treasury ETF (US:SPTI) . Les nouvelles positions de Richard Bernstein Advisors LLC incluent SPDR Series Trust - SPDR Portfolio Intermediate Term Treasury ETF (US:SPTI) , Kenvue Inc. (US:KVUE) , Arch Capital Group Ltd. (US:ACGL) , Ralliant Corporation (US:RAL) , and .
Meilleures augmentations ce trimestre
Nous utilisons la variation de l'allocation du portefeuille car il s'agit de l'indicateur le plus significatif. Les changements peuvent être dus à des transactions ou à des variations de prix des actions.
| Titre | Actions (en millions) |
Valeur ($ en millions) |
% du portefeuille | ΔPortefeuille % |
|---|---|---|---|---|
| 8,25 | 237,30 | 5,8557 | 5,8557 | |
| 9,13 | 394,78 | 9,7417 | 3,0184 | |
| 0,74 | 60,31 | 1,4882 | 1,4882 | |
| 0,56 | 45,53 | 1,1234 | 1,1234 | |
| 1,41 | 277,39 | 6,8450 | 1,0339 | |
| 10,27 | 462,89 | 11,4224 | 0,9511 | |
| 0,42 | 66,48 | 1,6405 | 0,4465 | |
| 0,71 | 77,17 | 1,9043 | 0,3041 | |
| 0,12 | 60,63 | 1,4960 | 0,2811 | |
| 1,35 | 116,15 | 2,8662 | 0,1808 |
Principales baisses ce trimestre
Nous utilisons la variation de l'allocation du portefeuille car il s'agit de l'indicateur le plus significatif. Les changements peuvent être dus à des transactions ou à des variations de prix des actions.
| Titre | Actions (en millions) |
Valeur ($ en millions) |
% du portefeuille | ΔPortefeuille % |
|---|---|---|---|---|
| 7,28 | 213,31 | 5,2638 | -3,6285 | |
| 2,90 | 182,82 | 4,5114 | -2,4183 | |
| 0,01 | 0,31 | 0,0075 | -1,6575 | |
| 0,00 | 0,01 | 0,0002 | -1,4736 | |
| 2,09 | 109,57 | 2,7037 | -1,0632 | |
| 0,51 | 47,62 | 1,1751 | -0,7401 | |
| 0,44 | 72,76 | 1,7953 | -0,3975 | |
| 0,38 | 21,77 | 0,5373 | -0,3862 | |
| 0,43 | 23,89 | 0,5894 | -0,3769 | |
| 0,26 | 52,85 | 1,3042 | -0,2218 |
Déclarations 13F et dépôts de fonds
Ce formulaire a été déposé le 2025-08-06 pour la période de déclaration 2025-06-30. Cliquez sur l'icône du lien pour voir l'historique complet des transactions.
Mettre à niveau pour débloquer les données premium et exporter vers Excel ![]() .
.
| Titre | Type | Prix moyen de l'action | Actions (en millions) |
ΔActions (%) |
ΔActions (%) |
Valeur ($ en millions) |
Portefeuille (%) |
ΔPortefeuille (%) |
|
|---|---|---|---|---|---|---|---|---|---|
| JMBS / Janus Detroit Street Trust - Janus Henderson Mortgage-Backed Securities ETF | 10,27 | 7,32 | 462,89 | 6,96 | 11,4224 | 0,9511 | |||
| IQLT / iShares Trust - iShares MSCI Intl Quality Factor ETF | 9,13 | 30,48 | 394,78 | 42,08 | 9,7417 | 3,0184 | |||
| VTV / Vanguard Index Funds - Vanguard Value ETF | 1,75 | -4,06 | 308,90 | -1,83 | 7,6227 | 0,0085 | |||
| FTEC / Fidelity Covington Trust - Fidelity MSCI Information Technology Index ETF | 1,41 | -5,55 | 277,39 | 15,50 | 6,8450 | 1,0339 | |||
| SPTI / SPDR Series Trust - SPDR Portfolio Intermediate Term Treasury ETF | 8,25 | 237,30 | 5,8557 | 5,8557 | |||||
| SPTS / SPDR Series Trust - SPDR Portfolio Short Term Treasury ETF | 7,28 | -42,05 | 213,31 | -41,95 | 5,2638 | -3,6285 | |||
| EMXC / iShares, Inc. - iShares MSCI Emerging Markets ex China ETF | 2,90 | -44,30 | 182,82 | -36,16 | 4,5114 | -2,4183 | |||
| TLH / iShares Trust - iShares 10-20 Year Treasury Bond ETF | 1,71 | -3,38 | 173,48 | -5,38 | 4,2809 | -0,1556 | |||
| SDY / SPDR Series Trust - SPDR S&P Dividend ETF | 1,08 | -7,21 | 145,96 | -7,17 | 3,6017 | -0,2030 | |||
| IXJ / iShares Trust - iShares Global Healthcare ETF | 1,35 | 10,87 | 116,15 | 4,66 | 2,8662 | 0,1808 | |||
| XLF / The Select Sector SPDR Trust - The Financial Select Sector SPDR Fund | 2,09 | -33,06 | 109,57 | -29,62 | 2,7037 | -1,0632 | |||
| BAR / GraniteShares Gold Trust | 2,70 | -7,92 | 88,24 | -2,54 | 2,1774 | -0,0134 | |||
| XLC / The Select Sector SPDR Trust - The Communication Services Select Sector SPDR Fund | 0,71 | 3,70 | 77,17 | 16,69 | 1,9043 | 0,3041 | |||
| EXI / iShares Trust - iShares Global Industrials ETF | 0,44 | -29,43 | 72,76 | -19,72 | 1,7953 | -0,3975 | |||
| NVDD / Direxion Shares ETF Trust - Direxion Daily NVDA Bear 1X Shares | 0,42 | -7,58 | 66,48 | 34,73 | 1,6405 | 0,4465 | |||
| MSFT / Microsoft Corporation | 0,12 | -8,88 | 60,63 | 20,74 | 1,4960 | 0,2811 | |||
| XLP / The Select Sector SPDR Trust - The Consumer Staples Select Sector SPDR Fund | 0,74 | 60,31 | 1,4882 | 1,4882 | |||||
| AAPL / Apple Inc. | 0,26 | -9,27 | 52,85 | -16,20 | 1,3042 | -0,2218 | |||
| FDIS / Fidelity Covington Trust - Fidelity MSCI Consumer Discretionary Index ETF | 0,51 | -45,95 | 47,62 | -39,84 | 1,1751 | -0,7401 | |||
| XLU / The Select Sector SPDR Trust - The Utilities Select Sector SPDR Fund | 0,56 | 45,53 | 1,1234 | 1,1234 | |||||
| AMZN / Amazon.com, Inc. | 0,16 | -8,20 | 35,29 | 5,85 | 0,8708 | 0,0641 | |||
| META / Meta Platforms, Inc. | 0,04 | -9,20 | 27,29 | 16,28 | 0,6733 | 0,1055 | |||
| INDA / iShares Trust - iShares MSCI India ETF | 0,43 | -44,70 | 23,89 | -40,18 | 0,5894 | -0,3769 | |||
| EWT / iShares, Inc. - iShares MSCI Taiwan ETF | 0,38 | -52,81 | 21,77 | -42,95 | 0,5373 | -0,3862 | |||
| AVGO / Broadcom Inc. | 0,08 | -8,99 | 20,81 | 49,83 | 0,5135 | 0,1775 | |||
| GOOGL / Alphabet Inc. | 0,10 | -8,96 | 17,19 | 3,76 | 0,4241 | 0,0233 | |||
| TSLA / Tesla, Inc. | 0,05 | -6,45 | 15,31 | 14,67 | 0,3778 | 0,0547 | |||
| GOOG / Alphabet Inc. | 0,08 | -9,71 | 14,66 | 2,52 | 0,3617 | 0,0157 | |||
| JPM / JPMorgan Chase & Co. | 0,05 | -16,67 | 13,66 | -1,51 | 0,3370 | 0,0015 | |||
| QUAL / iShares Trust - iShares MSCI USA Quality Factor ETF | 0,07 | -1,51 | 12,41 | 5,37 | 0,3062 | 0,0213 | |||
| EWY / iShares, Inc. - iShares MSCI South Korea ETF | 0,17 | -54,01 | 12,20 | -38,91 | 0,3011 | -0,1822 | |||
| LLY / Eli Lilly and Company | 0,02 | -4,48 | 11,73 | -9,84 | 0,2894 | -0,0254 | |||
| BRK.A / Berkshire Hathaway Inc. | 0,02 | -11,80 | 11,48 | -19,55 | 0,2833 | -0,0620 | |||
| WMT / Walmart Inc. | 0,11 | -0,07 | 11,23 | 11,30 | 0,2772 | 0,0330 | |||
| BSX / Boston Scientific Corporation | 0,09 | -4,27 | 10,08 | 1,92 | 0,2489 | 0,0094 | |||
| GE / General Electric Company | 0,03 | -8,48 | 8,57 | 17,70 | 0,2114 | 0,0353 | |||
| PM / Philip Morris International Inc. | 0,05 | 74,83 | 8,44 | 100,62 | 0,2082 | 0,1064 | |||
| SPGI / S&P Global Inc. | 0,02 | -5,16 | 8,38 | -1,57 | 0,2067 | 0,0008 | |||
| ABT / Abbott Laboratories | 0,06 | 0,00 | 7,69 | 2,53 | 0,1898 | 0,0083 | |||
| KO / The Coca-Cola Company | 0,11 | -8,38 | 7,69 | -9,50 | 0,1897 | -0,0158 | |||
| JNJ / Johnson & Johnson | 0,05 | 78,22 | 7,64 | 64,18 | 0,1886 | 0,0760 | |||
| CEG / Constellation Energy Corporation | 0,02 | 0,00 | 7,21 | 60,06 | 0,1780 | 0,0690 | |||
| MKL / Markel Group Inc. | 0,00 | 0,00 | 7,02 | 6,83 | 0,1732 | 0,0142 | |||
| ETN / Eaton Corporation plc | 0,02 | 0,00 | 6,92 | 31,32 | 0,1708 | 0,0433 | |||
| COR / Cencora, Inc. | 0,02 | -0,04 | 6,49 | 7,79 | 0,1602 | 0,0145 | |||
| VICI / VICI Properties Inc. | 0,20 | 0,00 | 6,39 | -0,06 | 0,1576 | 0,0030 | |||
| MO / Altria Group, Inc. | 0,11 | 6,38 | 0,1574 | 0,1574 | |||||
| AIG / American International Group, Inc. | 0,07 | -6,34 | 6,30 | -7,80 | 0,1554 | -0,0099 | |||
| UNH / UnitedHealth Group Incorporated | 0,02 | -0,07 | 6,29 | -40,48 | 0,1552 | -0,1005 | |||
| CL / Colgate-Palmolive Company | 0,07 | 6,16 | 0,1521 | 0,1521 | |||||
| ABBV / AbbVie Inc. | 0,03 | -0,11 | 6,06 | -11,50 | 0,1497 | -0,0162 | |||
| HWM / Howmet Aerospace Inc. | 0,03 | -23,65 | 5,82 | 9,54 | 0,1437 | 0,0151 | |||
| MCK / McKesson Corporation | 0,01 | 0,00 | 5,71 | 8,89 | 0,1408 | 0,0140 | |||
| BAC / Bank of America Corporation | 0,12 | -9,62 | 5,66 | 2,48 | 0,1396 | 0,0060 | |||
| PEP / PepsiCo, Inc. | 0,04 | 119,34 | 5,63 | 93,13 | 0,1389 | 0,0684 | |||
| GILD / Gilead Sciences, Inc. | 0,05 | 82,67 | 5,59 | 80,78 | 0,1379 | 0,0631 | |||
| WFC / Wells Fargo & Company | 0,07 | -0,10 | 5,54 | 11,49 | 0,1368 | 0,0165 | |||
| GD / General Dynamics Corporation | 0,02 | 0,00 | 5,52 | 6,99 | 0,1363 | 0,0114 | |||
| KMB / Kimberly-Clark Corporation | 0,04 | 5,47 | 0,1351 | 0,1351 | |||||
| UBER / Uber Technologies, Inc. | 0,06 | -8,65 | 5,41 | 16,98 | 0,1334 | 0,0216 | |||
| PG / The Procter & Gamble Company | 0,03 | 133,01 | 5,38 | 117,85 | 0,1328 | 0,0730 | |||
| CCEP / Coca-Cola Europacific Partners PLC | 0,06 | 5,36 | 0,1323 | 0,1323 | |||||
| MA / Mastercard Incorporated | 0,01 | 0,00 | 5,31 | 2,51 | 0,1310 | 0,0057 | |||
| EXC / Exelon Corporation | 0,12 | 0,00 | 5,28 | -5,78 | 0,1304 | -0,0053 | |||
| CAT / Caterpillar Inc. | 0,01 | -7,71 | 5,19 | 8,65 | 0,1281 | 0,0125 | |||
| IBM / International Business Machines Corporation | 0,02 | -9,70 | 5,18 | 7,05 | 0,1279 | 0,0107 | |||
| KVUE / Kenvue Inc. | 0,24 | 5,10 | 0,1257 | 0,1257 | |||||
| BKNG / Booking Holdings Inc. | 0,00 | -8,35 | 5,08 | 15,16 | 0,1254 | 0,0186 | |||
| ITA / iShares Trust - iShares U.S. Aerospace & Defense ETF | 0,03 | -44,50 | 4,94 | -31,62 | 0,1219 | -0,0529 | |||
| EQH / Equitable Holdings, Inc. | 0,09 | -8,93 | 4,90 | -1,92 | 0,1209 | 0,0000 | |||
| FE / FirstEnergy Corp. | 0,12 | 0,00 | 4,78 | -0,40 | 0,1180 | 0,0018 | |||
| PPL / PPL Corporation | 0,14 | 4,78 | 0,1180 | 0,1180 | |||||
| GEHC / GE HealthCare Technologies Inc. | 0,06 | 0,00 | 4,67 | -8,23 | 0,1153 | -0,0079 | |||
| MDLZ / Mondelez International, Inc. | 0,07 | 4,65 | 0,1147 | 0,1147 | |||||
| ISRG / Intuitive Surgical, Inc. | 0,01 | -11,13 | 4,63 | -2,49 | 0,1142 | -0,0006 | |||
| MDT / Medtronic plc | 0,05 | 0,00 | 4,60 | -3,00 | 0,1135 | -0,0012 | |||
| CARR / Carrier Global Corporation | 0,06 | 0,00 | 4,57 | 15,44 | 0,1127 | 0,0170 | |||
| STZ / Constellation Brands, Inc. | 0,03 | 4,45 | 0,1098 | 0,1098 | |||||
| CRBG / Corebridge Financial, Inc. | 0,12 | -7,67 | 4,42 | 3,83 | 0,1091 | 0,0061 | |||
| GEV / GE Vernova Inc. | 0,01 | -9,53 | 4,39 | 56,83 | 0,1082 | 0,0405 | |||
| PCG / PG&E Corporation | 0,31 | 0,00 | 4,37 | -18,86 | 0,1078 | -0,0225 | |||
| LIN / Linde plc | 0,01 | -0,12 | 4,35 | 0,62 | 0,1074 | 0,0028 | |||
| HCA / HCA Healthcare, Inc. | 0,01 | 0,00 | 4,34 | 10,85 | 0,1072 | 0,0124 | |||
| NOC / Northrop Grumman Corporation | 0,01 | 0,00 | 4,33 | -2,35 | 0,1068 | -0,0004 | |||
| AM / Antero Midstream Corporation | 0,23 | 0,00 | 4,30 | 5,26 | 0,1062 | 0,0073 | |||
| SYK / Stryker Corporation | 0,01 | 0,00 | 4,24 | 6,29 | 0,1047 | 0,0081 | |||
| HLI / Houlihan Lokey, Inc. | 0,02 | -8,26 | 4,19 | 2,22 | 0,1034 | 0,0042 | |||
| PCAR / PACCAR Inc | 0,04 | -9,50 | 4,11 | -11,65 | 0,1015 | -0,0112 | |||
| JCI / Johnson Controls International plc | 0,04 | -0,08 | 4,11 | 31,74 | 0,1013 | 0,0259 | |||
| CAH / Cardinal Health, Inc. | 0,02 | 0,00 | 4,10 | 21,95 | 0,1012 | 0,0198 | |||
| ETR / Entergy Corporation | 0,05 | 0,00 | 4,09 | -2,78 | 0,1010 | -0,0009 | |||
| T / AT&T Inc. | 0,14 | -7,92 | 4,08 | -5,78 | 0,1007 | -0,0041 | |||
| CNC / Centene Corporation | 0,08 | 0,00 | 4,07 | -10,60 | 0,1005 | -0,0097 | |||
| DE / Deere & Company | 0,01 | -9,11 | 3,94 | -1,53 | 0,0972 | 0,0004 | |||
| FOX / Fox Corporation | 0,08 | -11,29 | 3,92 | -13,11 | 0,0967 | -0,0124 | |||
| CTVA / Corteva, Inc. | 0,05 | 0,00 | 3,90 | 18,46 | 0,0961 | 0,0165 | |||
| CSCO / Cisco Systems, Inc. | 0,06 | 0,00 | 3,88 | 12,41 | 0,0957 | 0,0122 | |||
| HLNE / Hamilton Lane Incorporated | 0,03 | -7,66 | 3,87 | -11,74 | 0,0955 | -0,0106 | |||
| CVX / Chevron Corporation | 0,03 | 0,00 | 3,86 | -14,41 | 0,0953 | -0,0139 | |||
| C / Citigroup Inc. | 0,04 | -7,51 | 3,81 | 10,89 | 0,0940 | 0,0109 | |||
| VST / Vistra Corp. | 0,02 | 0,00 | 3,80 | 65,03 | 0,0939 | 0,0381 | |||
| AXP / American Express Company | 0,01 | -9,73 | 3,79 | 7,01 | 0,0934 | 0,0078 | |||
| WM / Waste Management, Inc. | 0,02 | -8,80 | 3,76 | -9,87 | 0,0929 | -0,0082 | |||
| HIG / The Hartford Insurance Group, Inc. | 0,03 | -9,27 | 3,74 | -6,96 | 0,0924 | -0,0050 | |||
| KKR / KKR & Co. Inc. | 0,03 | -8,16 | 3,73 | 5,66 | 0,0921 | 0,0066 | |||
| CME / CME Group Inc. | 0,01 | -0,08 | 3,72 | 3,82 | 0,0919 | 0,0051 | |||
| AMGN / Amgen Inc. | 0,01 | 0,00 | 3,72 | -10,38 | 0,0918 | -0,0086 | |||
| RTX / RTX Corporation | 0,03 | -0,18 | 3,69 | 10,04 | 0,0912 | 0,0099 | |||
| TT / Trane Technologies plc | 0,01 | 0,00 | 3,64 | 29,84 | 0,0899 | 0,0220 | |||
| FIS / Fidelity National Information Services, Inc. | 0,04 | 0,00 | 3,61 | 9,02 | 0,0892 | 0,0090 | |||
| CRM / Salesforce, Inc. | 0,01 | 0,00 | 3,60 | 1,64 | 0,0888 | 0,0031 | |||
| AMD / Advanced Micro Devices, Inc. | 0,03 | -21,13 | 3,58 | 8,93 | 0,0882 | 0,0088 | |||
| HD / The Home Depot, Inc. | 0,01 | -14,40 | 3,55 | -14,38 | 0,0876 | -0,0127 | |||
| XOM / Exxon Mobil Corporation | 0,03 | -0,17 | 3,54 | -9,52 | 0,0873 | -0,0073 | |||
| OTIS / Otis Worldwide Corporation | 0,04 | 0,00 | 3,50 | -4,06 | 0,0864 | -0,0019 | |||
| SO / The Southern Company | 0,04 | 3,48 | 0,0859 | 0,0859 | |||||
| APO / Apollo Global Management, Inc. | 0,02 | -10,00 | 3,47 | -6,77 | 0,0857 | -0,0044 | |||
| VRTX / Vertex Pharmaceuticals Incorporated | 0,01 | -9,93 | 3,45 | -17,31 | 0,0852 | -0,0158 | |||
| ANET / Arista Networks Inc | 0,03 | 0,00 | 3,39 | 32,09 | 0,0836 | 0,0215 | |||
| APG / APi Group Corporation | 0,07 | -36,38 | 3,39 | -9,17 | 0,0836 | -0,0067 | |||
| NWS / News Corporation | 0,10 | -10,76 | 3,36 | 0,81 | 0,0830 | 0,0023 | |||
| DUK / Duke Energy Corporation | 0,03 | 3,35 | 0,0827 | 0,0827 | |||||
| TW / Tradeweb Markets Inc. | 0,02 | -10,46 | 3,34 | -11,71 | 0,0825 | -0,0091 | |||
| ACT / Enact Holdings, Inc. | 0,09 | -49,21 | 3,34 | -45,71 | 0,0824 | -0,0664 | |||
| GSCE / GS Connect S&P GSCI Enhanced Commodity Total Return ETN | 0,00 | -6,04 | 3,25 | 21,72 | 0,0802 | 0,0156 | |||
| ALL / The Allstate Corporation | 0,02 | -0,11 | 3,24 | -2,90 | 0,0801 | -0,0008 | |||
| NVT / nVent Electric plc | 0,04 | 0,00 | 3,24 | 39,77 | 0,0801 | 0,0239 | |||
| COF / Capital One Financial Corporation | 0,02 | 0,00 | 3,23 | 18,68 | 0,0796 | 0,0138 | |||
| TPG / TPG Inc. | 0,06 | 0,00 | 3,22 | 10,60 | 0,0795 | 0,0090 | |||
| ITW / Illinois Tool Works Inc. | 0,01 | 0,00 | 3,21 | -0,31 | 0,0792 | 0,0013 | |||
| DAL / Delta Air Lines, Inc. | 0,07 | -7,57 | 3,20 | 4,23 | 0,0790 | 0,0047 | |||
| PYPL / PayPal Holdings, Inc. | 0,04 | -6,40 | 3,17 | 6,64 | 0,0781 | 0,0063 | |||
| V / Visa Inc. | 0,01 | -10,56 | 3,15 | -9,38 | 0,0777 | -0,0064 | |||
| BMY / Bristol-Myers Squibb Company | 0,07 | -11,54 | 3,09 | -32,87 | 0,0763 | -0,0351 | |||
| LMT / Lockheed Martin Corporation | 0,01 | -0,04 | 3,09 | 3,62 | 0,0763 | 0,0041 | |||
| MRK / Merck & Co., Inc. | 0,04 | 0,00 | 3,09 | -11,83 | 0,0762 | -0,0085 | |||
| ZBH / Zimmer Biomet Holdings, Inc. | 0,03 | 0,00 | 3,07 | -19,42 | 0,0759 | -0,0164 | |||
| ADP / Automatic Data Processing, Inc. | 0,01 | 0,00 | 3,05 | 0,96 | 0,0753 | 0,0022 | |||
| LHX / L3Harris Technologies, Inc. | 0,01 | 0,00 | 3,01 | 19,85 | 0,0744 | 0,0135 | |||
| XYZ / Block, Inc. | 0,04 | 0,00 | 3,01 | 25,00 | 0,0743 | 0,0160 | |||
| FTV / Fortive Corporation | 0,06 | 0,00 | 2,99 | -28,77 | 0,0738 | -0,0278 | |||
| D / Dominion Energy, Inc. | 0,05 | 2,98 | 0,0734 | 0,0734 | |||||
| URI / United Rentals, Inc. | 0,00 | 0,00 | 2,95 | 20,23 | 0,0729 | 0,0134 | |||
| HON / Honeywell International Inc. | 0,01 | -10,17 | 2,95 | -1,20 | 0,0729 | 0,0005 | |||
| MU / Micron Technology, Inc. | 0,02 | 0,00 | 2,92 | 41,87 | 0,0722 | 0,0223 | |||
| ARES / Ares Management Corporation | 0,02 | -11,45 | 2,92 | 4,62 | 0,0721 | 0,0045 | |||
| GLW / Corning Incorporated | 0,05 | 0,00 | 2,89 | 14,87 | 0,0713 | 0,0104 | |||
| PFE / Pfizer Inc. | 0,12 | 0,00 | 2,86 | -4,36 | 0,0705 | -0,0018 | |||
| EQIX / Equinix, Inc. | 0,00 | 0,00 | 2,79 | -2,45 | 0,0689 | -0,0004 | |||
| EIX / Edison International | 0,05 | 0,00 | 2,76 | -12,41 | 0,0681 | -0,0082 | |||
| SYY / Sysco Corporation | 0,04 | 2,73 | 0,0674 | 0,0674 | |||||
| UHALB / U-Haul Holding Company - Series N | 0,05 | 0,00 | 2,71 | -8,12 | 0,0670 | -0,0045 | |||
| TEAM / Atlassian Corporation | 0,01 | -6,50 | 2,71 | -10,52 | 0,0669 | -0,0064 | |||
| TRGP / Targa Resources Corp. | 0,02 | 0,00 | 2,70 | -13,19 | 0,0666 | -0,0086 | |||
| UNP / Union Pacific Corporation | 0,01 | 0,00 | 2,68 | -2,62 | 0,0661 | -0,0005 | |||
| PEG / Public Service Enterprise Group Incorporated | 0,03 | 2,67 | 0,0658 | 0,0658 | |||||
| CVS / CVS Health Corporation | 0,04 | 2,62 | 0,0646 | 0,0646 | |||||
| OWL / Blue Owl Capital Inc. | 0,14 | 0,00 | 2,61 | -4,12 | 0,0644 | -0,0015 | |||
| NEE / NextEra Energy, Inc. | 0,04 | 2,61 | 0,0643 | 0,0643 | |||||
| PRU / Prudential Financial, Inc. | 0,02 | -6,92 | 2,60 | -10,46 | 0,0642 | -0,0061 | |||
| TSN / Tyson Foods, Inc. | 0,05 | 2,55 | 0,0630 | 0,0630 | |||||
| CSX / CSX Corporation | 0,08 | -8,19 | 2,55 | 1,80 | 0,0628 | 0,0023 | |||
| SRE / Sempra | 0,03 | 2,54 | 0,0626 | 0,0626 | |||||
| DOW / Dow Inc. | 0,10 | 0,00 | 2,53 | -24,17 | 0,0625 | -0,0183 | |||
| CB / Chubb Limited | 0,01 | 2,53 | 0,0624 | 0,0624 | |||||
| ABNB / Airbnb, Inc. | 0,02 | 0,00 | 2,53 | 10,78 | 0,0624 | 0,0072 | |||
| F / Ford Motor Company | 0,23 | 0,00 | 2,52 | 8,15 | 0,0622 | 0,0058 | |||
| WDC / Western Digital Corporation | 0,04 | 0,00 | 2,51 | 58,31 | 0,0620 | 0,0236 | |||
| CI / The Cigna Group | 0,01 | 2,50 | 0,0618 | 0,0618 | |||||
| IR / Ingersoll Rand Inc. | 0,03 | -7,27 | 2,50 | -3,63 | 0,0617 | -0,0011 | |||
| KR / The Kroger Co. | 0,03 | 2,48 | 0,0613 | 0,0613 | |||||
| ACGL / Arch Capital Group Ltd. | 0,03 | 2,46 | 0,0606 | 0,0606 | |||||
| PGR / The Progressive Corporation | 0,01 | 2,41 | 0,0595 | 0,0595 | |||||
| MRVL / Marvell Technology, Inc. | 0,03 | -9,47 | 2,40 | 13,78 | 0,0593 | 0,0082 | |||
| CNP / CenterPoint Energy, Inc. | 0,06 | 2,38 | 0,0587 | 0,0587 | |||||
| SNDR / Schneider National, Inc. | 0,10 | 0,00 | 2,34 | 5,65 | 0,0577 | 0,0042 | |||
| BDX / Becton, Dickinson and Company | 0,01 | 0,00 | 2,27 | -24,81 | 0,0560 | -0,0170 | |||
| PLD / Prologis, Inc. | 0,02 | -0,11 | 2,12 | -6,04 | 0,0522 | -0,0023 | |||
| REGN / Regeneron Pharmaceuticals, Inc. | 0,00 | 0,00 | 1,98 | -17,23 | 0,0488 | -0,0090 | |||
| IQV / IQVIA Holdings Inc. | 0,01 | 0,00 | 1,93 | -10,61 | 0,0476 | -0,0046 | |||
| ADBE / Adobe Inc. | 0,00 | 0,00 | 1,91 | 0,85 | 0,0471 | 0,0013 | |||
| O / Realty Income Corporation | 0,03 | 0,00 | 1,87 | -0,64 | 0,0461 | 0,0006 | |||
| HPQ / HP Inc. | 0,07 | 0,00 | 1,73 | -11,67 | 0,0428 | -0,0047 | |||
| FDX / FedEx Corporation | 0,01 | 0,00 | 1,71 | -6,76 | 0,0422 | -0,0022 | |||
| GFS / GLOBALFOUNDRIES Inc. | 0,04 | -16,01 | 1,55 | -13,08 | 0,0382 | -0,0049 | |||
| UPS / United Parcel Service, Inc. | 0,01 | 0,00 | 1,43 | -8,29 | 0,0353 | -0,0024 | |||
| GLDM / World Gold Trust - SPDR Gold MiniShares Trust | 0,02 | -7,08 | 1,39 | -1,63 | 0,0342 | 0,0001 | |||
| AGG / iShares Trust - iShares Core U.S. Aggregate Bond ETF | 0,01 | 91,82 | 0,93 | 92,32 | 0,0229 | 0,0112 | |||
| RAL / Ralliant Corporation | 0,02 | 0,93 | 0,0229 | 0,0229 | |||||
| AOR / iShares Trust - iShares Core 60/40 Balanced Allocation ETF | 0,01 | -90,86 | 0,61 | -90,23 | 0,0151 | -0,1360 | |||
| VT / Vanguard International Equity Index Funds - Vanguard Total World Stock ETF | 0,00 | -82,17 | 0,58 | -80,26 | 0,0144 | -0,0570 | |||
| RSPT / Invesco Exchange-Traded Fund Trust - Invesco S&P 500 Equal Weight Technology ETF | 0,01 | -39,54 | 0,45 | -27,97 | 0,0111 | -0,0040 | |||
| SPSM / SPDR Series Trust - SPDR Portfolio S&P 600 Small Cap ETF | 0,01 | -99,58 | 0,31 | -99,56 | 0,0075 | -1,6575 | |||
| VGK / Vanguard International Equity Index Funds - Vanguard FTSE Europe ETF | 0,00 | -28,18 | 0,18 | -20,80 | 0,0044 | -0,0010 | |||
| EAOR / iShares Trust - iShares ESG Aware 60/40 Balanced Allocation ETF | 0,00 | 124,84 | 0,15 | 139,68 | 0,0037 | 0,0022 | |||
| EZU / iShares, Inc. - iShares MSCI Eurozone ETF | 0,00 | -64,00 | 0,14 | -59,88 | 0,0034 | -0,0049 | |||
| ACWI / iShares Trust - iShares MSCI ACWI ETF | 0,00 | 51,47 | 0,09 | 66,67 | 0,0021 | 0,0009 | |||
| MCHI / iShares Trust - iShares MSCI China ETF | 0,00 | -73,08 | 0,06 | -72,96 | 0,0016 | -0,0041 | |||
| KXI / iShares Trust - iShares Global Consumer Staples ETF | 0,00 | -60,39 | 0,05 | -59,69 | 0,0013 | -0,0018 | |||
| BBCA / J.P. Morgan Exchange-Traded Fund Trust - JPMorgan BetaBuilders Canada ETF | 0,00 | -62,48 | 0,05 | -57,63 | 0,0012 | -0,0016 | |||
| RSPD / Invesco Exchange-Traded Fund Trust - Invesco S&P 500 Equal Weight Consumer Discretionary ETF | 0,00 | -50,89 | 0,04 | -48,19 | 0,0011 | -0,0009 | |||
| XLK / The Select Sector SPDR Trust - The Technology Select Sector SPDR Fund | 0,00 | -42,55 | 0,02 | -31,03 | 0,0005 | -0,0002 | |||
| ACWV / iShares, Inc. - iShares MSCI Global Min Vol Factor ETF | 0,00 | 97,44 | 0,02 | 100,00 | 0,0005 | 0,0002 | |||
| BBJP / J.P. Morgan Exchange-Traded Fund Trust - JPMorgan BetaBuilders Japan ETF | 0,00 | -38,70 | 0,02 | -30,77 | 0,0004 | -0,0002 | |||
| JAAA / Janus Detroit Street Trust - Janus Henderson AAA CLO ETF | 0,00 | -91,68 | 0,01 | -92,05 | 0,0004 | -0,0039 | |||
| XLE / The Select Sector SPDR Trust - The Energy Select Sector SPDR Fund | 0,00 | -94,69 | 0,01 | -95,63 | 0,0002 | -0,0042 | |||
| IVOL / KraneShares Trust - Quadratic Interest Rate Volatility and Inflation Hedge ETF | 0,00 | -99,99 | 0,01 | -99,99 | 0,0002 | -1,4736 | |||
| AOM / iShares Trust - iShares Core 40/60 Moderate Allocation ETF | 0,00 | 1 325,00 | 0,00 | 0,0001 | 0,0001 | ||||
| BIL / SPDR Series Trust - SPDR Bloomberg 1-3 Month T-Bill ETF | 0,00 | -98,18 | 0,00 | -98,67 | 0,0000 | -0,0018 | |||
| MBB / iShares Trust - iShares MBS ETF | 0,00 | -9,09 | 0,00 | 0,00 | 0,0000 | 0,0000 | |||
| XLV / The Select Sector SPDR Trust - The Health Care Select Sector SPDR Fund | 0,00 | -87,50 | 0,00 | -100,00 | 0,0000 | -0,0002 | |||
| IXG / iShares Trust - iShares Global Financials ETF | 0,00 | 0,00 | 0,00 | 0,0000 | 0,0000 | ||||
| ALRM / Alarm.com Holdings, Inc. | 0,00 | -100,00 | 0,00 | 0,0000 | |||||
| DTM / DT Midstream, Inc. | 0,00 | -100,00 | 0,00 | 0,0000 | |||||
| BHF / Brighthouse Financial, Inc. | 0,00 | -100,00 | 0,00 | 0,0000 | |||||
| ASIX / AdvanSix Inc. | 0,00 | -100,00 | 0,00 | 0,0000 | |||||
| STEL / Stellar Bancorp, Inc. | 0,00 | -100,00 | 0,00 | -100,00 | -0,0764 | ||||
| FCPT / Four Corners Property Trust, Inc. | 0,00 | -100,00 | 0,00 | 0,0000 | |||||
| AAMI / Acadian Asset Management Inc. | 0,00 | -100,00 | 0,00 | 0,0000 | |||||
| JBBB / Janus Detroit Street Trust - Janus Henderson B-BBB CLO ETF | 0,00 | -100,00 | 0,00 | 0,0000 | |||||
| KN / Knowles Corporation | 0,00 | -100,00 | 0,00 | 0,0000 | |||||
| PSN / Parsons Corporation | 0,00 | -100,00 | 0,00 | 0,0000 | |||||
| TPH / Tri Pointe Homes, Inc. | 0,00 | -100,00 | 0,00 | 0,0000 | |||||
| VBTX / Veritex Holdings, Inc. | 0,00 | -100,00 | 0,00 | 0,0000 | |||||
| JEF / Jefferies Financial Group Inc. | 0,00 | -100,00 | 0,00 | 0,0000 | |||||
| MCHP / Microchip Technology Incorporated | 0,00 | -100,00 | 0,00 | 0,0000 | |||||
| TOST / Toast, Inc. | 0,00 | -100,00 | 0,00 | 0,0000 | |||||
| IBP / Installed Building Products, Inc. | 0,00 | -100,00 | 0,00 | 0,0000 | |||||
| RYAN / Ryan Specialty Holdings, Inc. | 0,00 | -100,00 | 0,00 | 0,0000 | |||||
| JXN / Jackson Financial Inc. | 0,00 | -100,00 | 0,00 | 0,0000 | |||||
| SLM / SLM Corporation | 0,00 | -100,00 | 0,00 | 0,0000 | |||||
| SYF / Synchrony Financial | 0,00 | -100,00 | 0,00 | 0,0000 | |||||
| CSWI / CSW Industrials, Inc. | 0,00 | -100,00 | 0,00 | 0,0000 | |||||
| MGY / Magnolia Oil & Gas Corporation | 0,00 | -100,00 | 0,00 | 0,0000 | |||||
| MC / Moelis & Company | 0,00 | -100,00 | 0,00 | 0,0000 | |||||
| CFG / Citizens Financial Group, Inc. | 0,00 | -100,00 | 0,00 | 0,0000 | |||||
| VRRM / Verra Mobility Corporation | 0,00 | -100,00 | 0,00 | 0,0000 | |||||
| HPE / Hewlett Packard Enterprise Company | 0,00 | -100,00 | 0,00 | 0,0000 | |||||
| PSTG / Pure Storage, Inc. | 0,00 | -100,00 | 0,00 | 0,0000 | |||||
| GMS / GMS Inc. | 0,00 | -100,00 | 0,00 | 0,0000 | |||||
| NTAP / NetApp, Inc. | 0,00 | -100,00 | 0,00 | 0,0000 | |||||
| SAIC / Science Applications International Corporation | 0,00 | -100,00 | 0,00 | 0,0000 | |||||
| FHB / First Hawaiian, Inc. | 0,00 | -100,00 | 0,00 | 0,0000 | |||||
| AXS / AXIS Capital Holdings Limited | 0,00 | -100,00 | 0,00 | 0,0000 | |||||
| FBK / FB Financial Corporation | 0,00 | -100,00 | 0,00 | 0,0000 | |||||
| VIRT / Virtu Financial, Inc. | 0,00 | -100,00 | 0,00 | 0,0000 | |||||
| PJT / PJT Partners Inc. | 0,00 | -100,00 | 0,00 | 0,0000 | |||||
| EBC / Eastern Bankshares, Inc. | 0,00 | -100,00 | 0,00 | 0,0000 | |||||
| VCTR / Victory Capital Holdings, Inc. | 0,00 | -100,00 | 0,00 | 0,0000 | |||||
| REZI / Resideo Technologies, Inc. | 0,00 | -100,00 | 0,00 | 0,0000 |