Statistiques de base
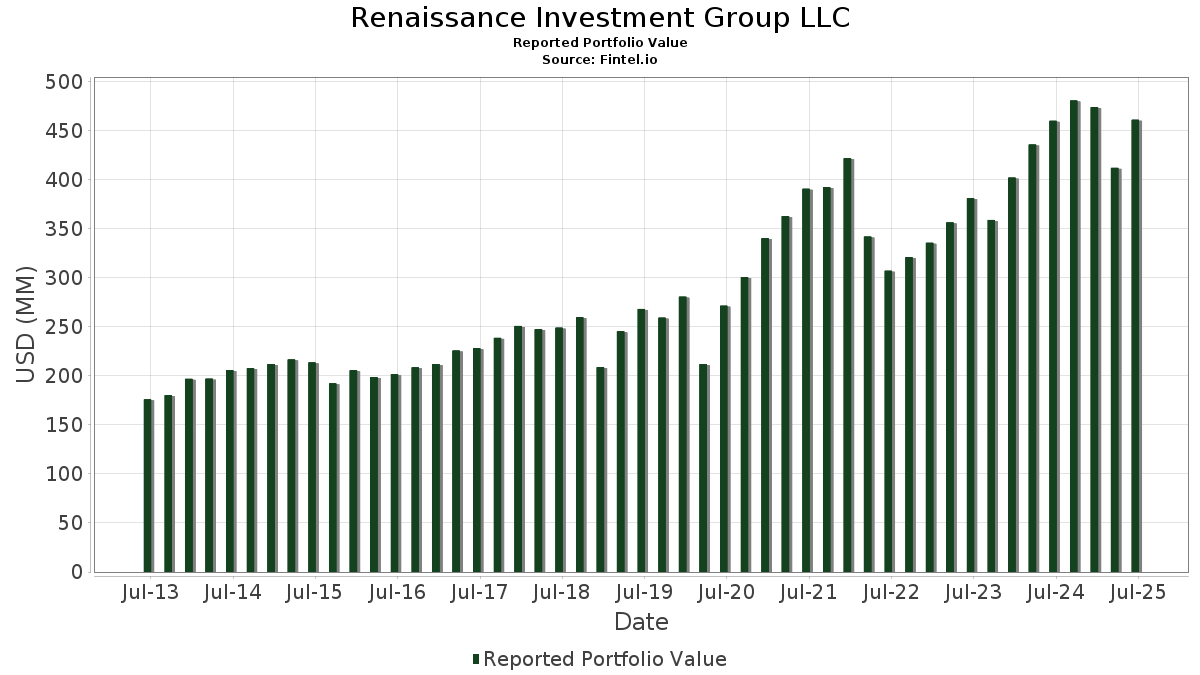
| Valeur du portefeuille | $ 460 880 286 |
| Positions actuelles | 78 |
Dernières positions, performances, ASG (à partir des dépôts 13F, 13D)
Renaissance Investment Group LLC a déclaré un total de 78 positions dans ses derniers dépôts auprès de la SEC. La valeur la plus récente du portefeuille est calculée à 460 880 286 USD. Les actifs sous gestion réels (ASG) sont cette valeur plus les liquidités (qui ne sont pas divulguées). Les principales positions de Renaissance Investment Group LLC sont Broadcom Inc. (US:AVGO) , Microsoft Corporation (US:MSFT) , Costco Wholesale Corporation (US:COST) , The TJX Companies, Inc. (US:TJX) , and Alphabet Inc. (US:GOOGL) . Les nouvelles positions de Renaissance Investment Group LLC incluent Eaton Corporation plc (US:ETN) , .
Meilleures augmentations ce trimestre
Nous utilisons la variation de l'allocation du portefeuille car il s'agit de l'indicateur le plus significatif. Les changements peuvent être dus à des transactions ou à des variations de prix des actions.
| Titre | Actions (en millions) |
Valeur ($ en millions) |
% du portefeuille | ΔPortefeuille % |
|---|---|---|---|---|
| 0,02 | 9,85 | 2,1363 | 2,0036 | |
| 0,10 | 27,22 | 5,9071 | 1,8805 | |
| 0,05 | 22,97 | 4,9836 | 0,7741 | |
| 0,10 | 15,09 | 3,2751 | 0,7490 | |
| 0,03 | 13,88 | 3,0118 | 0,7171 | |
| 0,07 | 13,17 | 2,8572 | 0,6418 | |
| 0,03 | 12,49 | 2,7104 | 0,4040 | |
| 0,00 | 15,21 | 3,3002 | 0,3447 | |
| 0,29 | 10,52 | 2,2833 | 0,2089 | |
| 0,01 | 7,61 | 1,6505 | 0,2084 |
Principales baisses ce trimestre
Nous utilisons la variation de l'allocation du portefeuille car il s'agit de l'indicateur le plus significatif. Les changements peuvent être dus à des transactions ou à des variations de prix des actions.
| Titre | Actions (en millions) |
Valeur ($ en millions) |
% du portefeuille | ΔPortefeuille % |
|---|---|---|---|---|
| 0,03 | 10,57 | 2,2933 | -0,8837 | |
| 0,02 | 4,12 | 0,8931 | -0,7671 | |
| 0,07 | 14,21 | 3,0823 | -0,6801 | |
| 0,04 | 11,81 | 2,5634 | -0,5061 | |
| 0,09 | 8,21 | 1,7815 | -0,5038 | |
| 0,03 | 8,03 | 1,7414 | -0,3819 | |
| 0,14 | 17,65 | 3,8301 | -0,3743 | |
| 0,05 | 4,41 | 0,9570 | -0,3717 | |
| 0,23 | 7,20 | 1,5623 | -0,3684 | |
| 0,04 | 14,26 | 3,0950 | -0,3536 |
Déclarations 13F et dépôts de fonds
Ce formulaire a été déposé le 2025-07-09 pour la période de déclaration 2025-06-30. Cliquez sur l'icône du lien pour voir l'historique complet des transactions.
Mettre à niveau pour débloquer les données premium et exporter vers Excel ![]() .
.
| Titre | Type | Prix moyen de l'action | Actions (en millions) |
ΔActions (%) |
ΔActions (%) |
Valeur ($ en millions) |
Portefeuille (%) |
ΔPortefeuille (%) |
|
|---|---|---|---|---|---|---|---|---|---|
| AVGO / Broadcom Inc. | 0,10 | -0,29 | 27,22 | 64,16 | 5,9071 | 1,8805 | |||
| MSFT / Microsoft Corporation | 0,05 | -0,02 | 22,97 | 32,48 | 4,9836 | 0,7741 | |||
| COST / Costco Wholesale Corporation | 0,02 | -0,46 | 20,64 | 4,19 | 4,4774 | -0,3313 | |||
| TJX / The TJX Companies, Inc. | 0,14 | 0,54 | 17,65 | 1,94 | 3,8301 | -0,3743 | |||
| GOOGL / Alphabet Inc. | 0,09 | -0,35 | 16,26 | 13,57 | 3,5286 | 0,0519 | |||
| BKNG / Booking Holdings Inc. | 0,00 | -0,57 | 15,21 | 24,95 | 3,3002 | 0,3447 | |||
| ISRG / Intuitive Surgical, Inc. | 0,03 | -0,06 | 15,10 | 9,65 | 3,2756 | -0,0672 | |||
| NVDA / NVIDIA Corporation | 0,10 | -0,48 | 15,09 | 45,08 | 3,2751 | 0,7490 | |||
| URI / United Rentals, Inc. | 0,02 | -0,30 | 14,36 | 19,86 | 3,1156 | 0,2069 | |||
| HD / The Home Depot, Inc. | 0,04 | 0,38 | 14,26 | 0,42 | 3,0950 | -0,3536 | |||
| AAPL / Apple Inc. | 0,07 | -0,75 | 14,21 | -8,33 | 3,0823 | -0,6801 | |||
| CRWD / CrowdStrike Holdings, Inc. | 0,03 | 1,67 | 13,88 | 46,86 | 3,0118 | 0,7171 | |||
| HWM / Howmet Aerospace Inc. | 0,07 | 0,59 | 13,17 | 44,32 | 2,8572 | 0,6418 | |||
| V / Visa Inc. | 0,04 | -0,69 | 13,07 | 0,62 | 2,8368 | -0,3182 | |||
| CRH / CRH plc | 0,14 | 0,47 | 12,72 | 4,85 | 2,7596 | -0,1856 | |||
| TT / Trane Technologies plc | 0,03 | 1,29 | 12,49 | 31,50 | 2,7104 | 0,4040 | |||
| RTX / RTX Corporation | 0,09 | -0,13 | 12,48 | 10,10 | 2,7068 | -0,0445 | |||
| AJG / Arthur J. Gallagher & Co. | 0,04 | 0,78 | 11,81 | -6,55 | 2,5634 | -0,5061 | |||
| LDOS / Leidos Holdings, Inc. | 0,07 | 0,26 | 11,39 | 17,22 | 2,4710 | 0,1121 | |||
| TMO / Thermo Fisher Scientific Inc. | 0,03 | -0,87 | 10,57 | -19,23 | 2,2933 | -0,8837 | |||
| XYL / Xylem Inc. | 0,08 | 0,71 | 10,53 | 9,05 | 2,2856 | -0,0596 | |||
| TTEK / Tetra Tech, Inc. | 0,29 | 0,19 | 10,52 | 23,18 | 2,2833 | 0,2089 | |||
| TEL / TE Connectivity plc | 0,06 | 0,11 | 10,26 | 19,48 | 2,2257 | 0,1413 | |||
| NXPI / NXP Semiconductors N.V. | 0,05 | -5,11 | 9,90 | 9,08 | 2,1478 | -0,0554 | |||
| GEV / GE Vernova Inc. | 0,02 | 938,92 | 9,85 | 1 703,11 | 2,1363 | 2,0036 | |||
| ZTS / Zoetis Inc. | 0,05 | 1,55 | 8,42 | -3,83 | 1,8269 | -0,2986 | |||
| MLM / Martin Marietta Materials, Inc. | 0,02 | -3,91 | 8,36 | 10,34 | 1,8137 | -0,0258 | |||
| CHD / Church & Dwight Co., Inc. | 0,09 | -0,08 | 8,21 | -12,77 | 1,7815 | -0,5038 | |||
| UNP / Union Pacific Corporation | 0,03 | -5,77 | 8,03 | -8,23 | 1,7414 | -0,3819 | |||
| META / Meta Platforms, Inc. | 0,01 | 0,01 | 7,61 | 28,07 | 1,6505 | 0,2084 | |||
| DHR / Danaher Corporation | 0,04 | -3,51 | 7,51 | -7,02 | 1,6290 | -0,3314 | |||
| EPD / Enterprise Products Partners L.P. - Limited Partnership | 0,23 | -0,31 | 7,20 | -9,46 | 1,5623 | -0,3684 | |||
| NEE / NextEra Energy, Inc. | 0,10 | -0,32 | 7,19 | -2,39 | 1,5602 | -0,2283 | |||
| OKE / ONEOK, Inc. | 0,05 | -2,03 | 4,41 | -19,41 | 0,9570 | -0,3717 | |||
| CRM / Salesforce, Inc. | 0,02 | -40,76 | 4,12 | -39,81 | 0,8931 | -0,7671 | |||
| GOOGL / Alphabet Inc. | 0,02 | -0,67 | 3,90 | 12,80 | 0,8454 | 0,0066 | |||
| NVO / Novo Nordisk A/S - Depositary Receipt (Common Stock) | 0,03 | 8,27 | 2,26 | 7,58 | 0,4897 | -0,0195 | |||
| SPY / SPDR S&P 500 ETF | 0,00 | 3,77 | 2,08 | 14,63 | 0,4505 | 0,0107 | |||
| ABBV / AbbVie Inc. | 0,01 | 0,00 | 1,96 | -11,42 | 0,4258 | -0,1120 | |||
| XOM / Exxon Mobil Corporation | 0,02 | -0,63 | 1,71 | -9,95 | 0,3714 | -0,0900 | |||
| ADP / Automatic Data Processing, Inc. | 0,01 | -1,35 | 1,69 | -0,41 | 0,3677 | -0,0455 | |||
| ABT / Abbott Laboratories | 0,01 | 0,00 | 1,38 | 2,53 | 0,2992 | -0,0273 | |||
| MDY / SPDR S&P MidCap 400 ETF Trust | 0,00 | -4,21 | 1,29 | 1,74 | 0,2794 | -0,0280 | |||
| PEP / PepsiCo, Inc. | 0,01 | -2,64 | 1,18 | -14,25 | 0,2559 | -0,0781 | |||
| BX / Blackstone Inc. | 0,01 | 0,00 | 1,13 | 6,99 | 0,2460 | -0,0112 | |||
| CSCO / Cisco Systems, Inc. | 0,01 | 0,00 | 1,01 | 12,46 | 0,2195 | 0,0010 | |||
| APD / Air Products and Chemicals, Inc. | 0,00 | -4,99 | 0,91 | -9,16 | 0,1980 | -0,0458 | |||
| VLTO / Veralto Corporation | 0,01 | -0,19 | 0,91 | 3,42 | 0,1969 | -0,0162 | |||
| MCD / McDonald's Corporation | 0,00 | -3,61 | 0,90 | -9,85 | 0,1947 | -0,0469 | |||
| JNJ / Johnson & Johnson | 0,01 | -4,90 | 0,88 | -12,40 | 0,1902 | -0,0528 | |||
| LLY / Eli Lilly and Company | 0,00 | 0,00 | 0,81 | -5,59 | 0,1759 | -0,0326 | |||
| BLD / TopBuild Corp. | 0,00 | -5,80 | 0,79 | 0,00 | 0,1710 | -0,0203 | |||
| MRK / Merck & Co., Inc. | 0,01 | -2,89 | 0,66 | -14,43 | 0,1442 | -0,0442 | |||
| MS / Morgan Stanley | 0,00 | 0,00 | 0,64 | 20,75 | 0,1391 | 0,0102 | |||
| BRK.B / Berkshire Hathaway Inc. | 0,00 | 0,00 | 0,63 | -8,82 | 0,1370 | -0,0311 | |||
| TSCO / Tractor Supply Company | 0,01 | -27,04 | 0,50 | -30,18 | 0,1075 | -0,0647 | |||
| WMT / Walmart Inc. | 0,01 | 0,00 | 0,49 | 11,34 | 0,1066 | -0,0005 | |||
| PG / The Procter & Gamble Company | 0,00 | 0,00 | 0,49 | -6,51 | 0,1060 | -0,0209 | |||
| AMGN / Amgen Inc. | 0,00 | -5,97 | 0,49 | -15,72 | 0,1060 | -0,0347 | |||
| CL / Colgate-Palmolive Company | 0,01 | 0,00 | 0,47 | -2,91 | 0,1015 | -0,0156 | |||
| CVX / Chevron Corporation | 0,00 | 0,00 | 0,47 | -14,52 | 0,1011 | -0,0311 | |||
| SYK / Stryker Corporation | 0,00 | 0,00 | 0,41 | 6,27 | 0,0884 | -0,0047 | |||
| AMZN / Amazon.com, Inc. | 0,00 | 0,00 | 0,38 | 15,36 | 0,0833 | 0,0025 | |||
| DOV / Dover Corporation | 0,00 | 0,00 | 0,36 | 4,39 | 0,0775 | -0,0056 | |||
| ECL / Ecolab Inc. | 0,00 | 0,00 | 0,34 | 6,29 | 0,0735 | -0,0039 | |||
| ADI / Analog Devices, Inc. | 0,00 | -3,92 | 0,29 | 13,23 | 0,0633 | 0,0008 | |||
| CSX / CSX Corporation | 0,01 | 0,00 | 0,29 | 10,81 | 0,0624 | -0,0006 | |||
| PFE / Pfizer Inc. | 0,01 | 0,00 | 0,27 | -4,26 | 0,0586 | -0,0100 | |||
| PYPL / PayPal Holdings, Inc. | 0,00 | 0,00 | 0,27 | 14,16 | 0,0578 | 0,0010 | |||
| WWD / Woodward, Inc. | 0,00 | -8,70 | 0,26 | 22,97 | 0,0558 | 0,0049 | |||
| EWG / iShares, Inc. - iShares MSCI Germany ETF | 0,01 | 0,23 | 0,0510 | 0,0510 | |||||
| GE / General Electric Company | 0,00 | 0,23 | 0,0491 | 0,0491 | |||||
| HON / Honeywell International Inc. | 0,00 | 0,22 | 0,0475 | 0,0475 | |||||
| CAT / Caterpillar Inc. | 0,00 | 0,22 | 0,0474 | 0,0474 | |||||
| EMR / Emerson Electric Co. | 0,00 | 0,22 | 0,0467 | 0,0467 | |||||
| ETN / Eaton Corporation plc | 0,00 | 0,21 | 0,0465 | 0,0465 | |||||
| JPM / JPMorgan Chase & Co. | 0,00 | 0,21 | 0,0450 | 0,0450 | |||||
| LOW / Lowe's Companies, Inc. | 0,00 | 0,00 | 0,21 | -4,65 | 0,0445 | -0,0078 | |||
| HAL / Halliburton Company | 0,00 | -100,00 | 0,00 | 0,0000 | |||||
| ODFL / Old Dominion Freight Line, Inc. | 0,00 | -100,00 | 0,00 | 0,0000 |