Statistiques de base
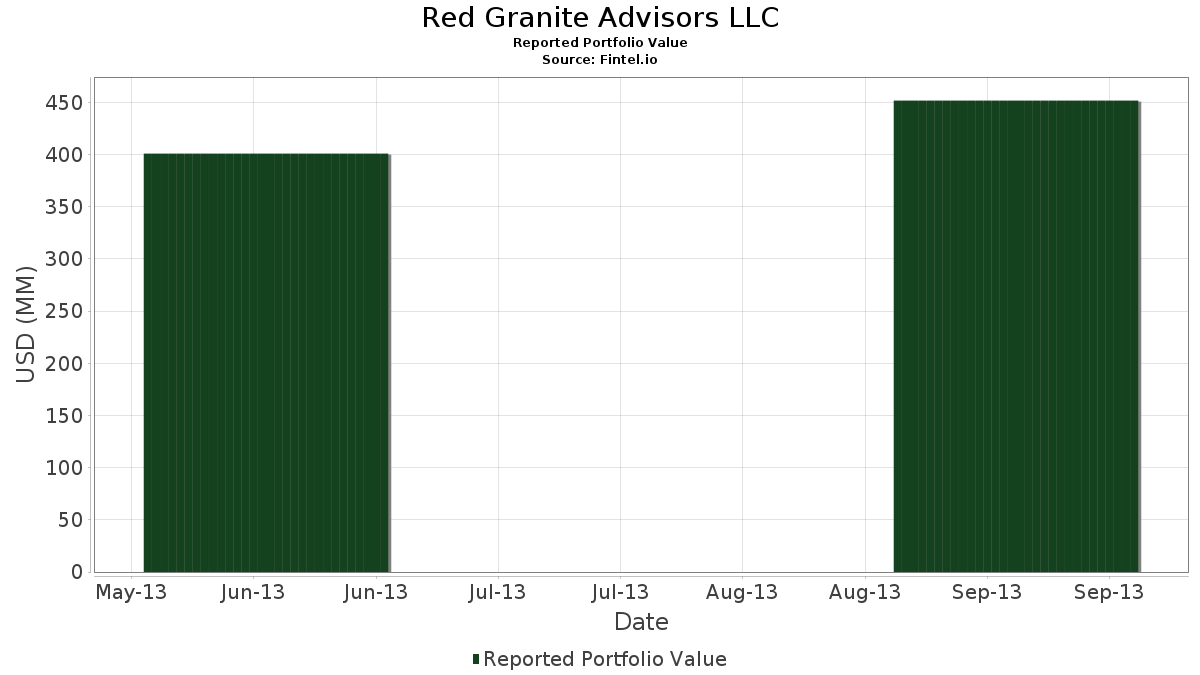
| Valeur du portefeuille | $ 451 598 000 |
| Positions actuelles | 61 |
Dernières positions, performances, ASG (à partir des dépôts 13F, 13D)
Red Granite Advisors LLC a déclaré un total de 61 positions dans ses derniers dépôts auprès de la SEC. La valeur la plus récente du portefeuille est calculée à 451 598 000 USD. Les actifs sous gestion réels (ASG) sont cette valeur plus les liquidités (qui ne sont pas divulguées). Les principales positions de Red Granite Advisors LLC sont Biogen Inc. (US:BIIB) , Celgene Corp. (US:CELG) , Apple Inc. (US:AAPL) , Alphabet Inc. (US:GOOGL) , and Gilead Sciences, Inc. (US:GILD) . Les nouvelles positions de Red Granite Advisors LLC incluent DICK'S Sporting Goods, Inc. (US:DKS) , Intuitive Surgical, Inc. (US:ISRG) , Robert Half Inc. (US:RHI) , Informatica Inc. (US:INFA) , and .
Meilleures augmentations ce trimestre
Nous utilisons la variation de l'allocation du portefeuille car il s'agit de l'indicateur le plus significatif. Les changements peuvent être dus à des transactions ou à des variations de prix des actions.
| Titre | Actions (en millions) |
Valeur ($ en millions) |
% du portefeuille | ΔPortefeuille % |
|---|---|---|---|---|
| 0,19 | 10,40 | 2,3036 | 2,3036 | |
| 0,03 | 10,22 | 2,2640 | 2,2640 | |
| 0,23 | 9,15 | 2,0270 | 2,0270 | |
| 0,23 | 8,78 | 1,9440 | 1,9440 | |
| 0,29 | 14,56 | 3,2245 | 1,3940 | |
| 0,19 | 9,82 | 2,1743 | 0,8200 | |
| 0,11 | 17,34 | 3,8393 | 0,5075 | |
| 0,24 | 15,31 | 3,3906 | 0,2886 | |
| 0,18 | 11,68 | 2,5870 | 0,2473 | |
| 0,04 | 17,17 | 3,8023 | 0,2325 |
Principales baisses ce trimestre
Nous utilisons la variation de l'allocation du portefeuille car il s'agit de l'indicateur le plus significatif. Les changements peuvent être dus à des transactions ou à des variations de prix des actions.
| Titre | Actions (en millions) |
Valeur ($ en millions) |
% du portefeuille | ΔPortefeuille % |
|---|---|---|---|---|
| 0,01 | 0,74 | 0,1641 | -2,3703 | |
| 0,01 | 0,96 | 0,2130 | -1,8316 | |
| 0,01 | 0,98 | 0,2172 | -1,6163 | |
| 0,01 | 0,58 | 0,1284 | -1,3204 | |
| 0,01 | 9,04 | 2,0029 | -0,7977 | |
| 0,29 | 10,80 | 2,3906 | -0,5447 | |
| 0,02 | 16,50 | 3,6530 | -0,5138 | |
| 0,12 | 11,48 | 2,5421 | -0,4219 | |
| 0,18 | 13,90 | 3,0782 | -0,4048 | |
| 0,19 | 11,46 | 2,5374 | -0,3108 |
Déclarations 13F et dépôts de fonds
Ce formulaire a été déposé le 2013-11-06 pour la période de déclaration 2013-09-30. Cliquez sur l'icône du lien pour voir l'historique complet des transactions.
Mettre à niveau pour débloquer les données premium et exporter vers Excel ![]() .
.
| Titre | Type | Prix moyen de l'action | Actions (en millions) |
ΔActions (%) |
ΔActions (%) |
Valeur ($ en millions) |
Portefeuille (%) |
ΔPortefeuille (%) |
|
|---|---|---|---|---|---|---|---|---|---|
| BIIB / Biogen Inc. | 0,07 | -1,53 | 17,41 | 10,17 | 3,8559 | -0,0877 | |||
| CELG / Celgene Corp. | 0,11 | -1,47 | 17,34 | 29,83 | 3,8393 | 0,5075 | |||
| AAPL / Apple Inc. | 0,04 | -0,19 | 17,17 | 20,01 | 3,8023 | 0,2325 | |||
| GOOGL / Alphabet Inc. | 0,02 | -0,72 | 16,50 | -1,22 | 3,6530 | -0,5138 | |||
| GILD / Gilead Sciences, Inc. | 0,24 | 0,43 | 15,31 | 23,16 | 3,3906 | 0,2886 | |||
| META / Meta Platforms, Inc. | 0,29 | -1,70 | 14,56 | 98,47 | 3,2245 | 1,3940 | |||
| FAST / Fastenal Company | 0,29 | -0,37 | 14,55 | 9,37 | 3,2219 | -0,0972 | |||
| AXP / American Express Company | 0,18 | -1,42 | 13,90 | -0,42 | 3,0782 | -0,4048 | |||
| AMZN / Amazon.com, Inc. | 0,04 | -0,68 | 13,40 | 11,82 | 2,9675 | -0,0225 | |||
| EMR / Emerson Electric Co. | 0,20 | -0,97 | 13,16 | 17,48 | 2,9143 | 0,1192 | |||
| WAG / | 0,24 | -0,89 | 12,79 | 20,65 | 2,8324 | 0,1872 | |||
| QCOM / QUALCOMM Incorporated | 0,19 | -1,28 | 12,50 | 8,79 | 2,7686 | -0,0988 | |||
| SBUX / Starbucks Corporation | 0,16 | 1,10 | 12,30 | 18,79 | 2,7248 | 0,1402 | |||
| TRMB / Trimble Inc. | 0,40 | 0,20 | 11,96 | 14,54 | 2,6484 | 0,0431 | |||
| LVS / Las Vegas Sands Corp. | 0,18 | -0,73 | 11,68 | 24,58 | 2,5870 | 0,2473 | |||
| MCD / McDonald's Corporation | 0,12 | -0,57 | 11,48 | -3,37 | 2,5421 | -0,4219 | |||
| ESRX / Express Scripts Holding Co. | 0,19 | 0,28 | 11,46 | 0,38 | 2,5374 | -0,3108 | |||
| SRCL / Stericycle, Inc. | 0,10 | -1,39 | 11,27 | 3,04 | 2,4954 | -0,2331 | |||
| GS / The Goldman Sachs Group, Inc. | 0,07 | -0,74 | 10,89 | 3,82 | 2,4108 | -0,2054 | |||
| KO / The Coca-Cola Company | 0,29 | -2,83 | 10,80 | -8,24 | 2,3906 | -0,5447 | |||
| CERN / Cerner Corp. | 0,20 | -1,42 | 10,63 | 7,83 | 2,3550 | -0,1058 | |||
| LKQ / LKQ Corporation | 0,33 | -0,20 | 10,51 | 23,52 | 2,3273 | 0,2043 | |||
| COST / Costco Wholesale Corporation | 0,09 | -1,65 | 10,50 | 2,44 | 2,3257 | -0,2323 | |||
| DKS / DICK'S Sporting Goods, Inc. | 0,19 | 10,40 | 2,3036 | 2,3036 | |||||
| V / Visa Inc. | 0,05 | -0,51 | 10,37 | 4,03 | 2,2963 | -0,1907 | |||
| FDX / FedEx Corporation | 0,09 | 2,33 | 10,27 | 18,44 | 2,2739 | 0,1108 | |||
| ISRG / Intuitive Surgical, Inc. | 0,03 | 10,22 | 2,2640 | 2,2640 | |||||
| CRM / Salesforce, Inc. | 0,19 | 33,04 | 9,82 | 80,90 | 2,1743 | 0,8200 | |||
| 61166W101 / Monsanto Co. | 0,09 | -1,16 | 9,45 | 4,42 | 2,0932 | -0,1655 | |||
| CVX / Chevron Corporation | 0,08 | -1,10 | 9,44 | 1,54 | 2,0895 | -0,2291 | |||
| 74005P104 / Praxair, Inc. | 0,08 | -0,96 | 9,20 | 3,38 | 2,0379 | -0,1831 | |||
| RHI / Robert Half Inc. | 0,23 | 9,15 | 2,0270 | 2,0270 | |||||
| BKNG / Booking Holdings Inc. | 0,01 | -34,11 | 9,04 | -19,42 | 2,0029 | -0,7977 | |||
| INFA / Informatica Inc. | 0,23 | 8,78 | 1,9440 | 1,9440 | |||||
| EMC / Global X Funds - Global X Emerging Markets Great Consumer ETF | 0,31 | -0,49 | 7,93 | 7,68 | 1,7562 | -0,0813 | |||
| COP / ConocoPhillips | 0,11 | -1,02 | 7,80 | 13,72 | 1,7272 | 0,0159 | |||
| YUM / Yum! Brands, Inc. | 0,07 | 2,84 | 5,31 | 5,88 | 1,1756 | -0,0754 | |||
| TPR / Tapestry, Inc. | 0,10 | -1,77 | 5,20 | -6,18 | 1,1504 | -0,2311 | |||
| XOM / Exxon Mobil Corporation | 0,03 | -1,45 | 2,34 | -6,17 | 0,5186 | -0,1041 | |||
| KMB / Kimberly-Clark Corporation | 0,01 | -1,68 | 1,38 | -4,63 | 0,3056 | -0,0554 | |||
| GSK / GSK plc - Depositary Receipt (Common Stock) | 0,03 | -4,66 | 1,28 | -4,25 | 0,2843 | -0,0503 | |||
| NVS / Novartis AG - Depositary Receipt (Common Stock) | 0,01 | -1,70 | 1,11 | 6,62 | 0,2460 | -0,0140 | |||
| VZ / Verizon Communications Inc. | 0,02 | 5,27 | 1,03 | -2,37 | 0,2283 | -0,0352 | |||
| ABBV / AbbVie Inc. | 0,02 | -1,66 | 1,02 | 6,48 | 0,2256 | -0,0131 | |||
| JNJ / Johnson & Johnson | 0,01 | -6,46 | 1,01 | -5,51 | 0,2241 | -0,0431 | |||
| IBM / International Business Machines Corporation | 0,01 | -86,22 | 0,98 | -86,65 | 0,2172 | -1,6163 | |||
| INTU / Intuit Inc. | 0,01 | -89,19 | 0,96 | -88,26 | 0,2130 | -1,8316 | |||
| FIS / Fidelity National Information Services, Inc. | 0,02 | 0,00 | 0,84 | 8,40 | 0,1858 | -0,0073 | |||
| ABT / Abbott Laboratories | 0,02 | -4,24 | 0,74 | -8,92 | 0,1650 | -0,0391 | |||
| DE / Deere & Company | 0,01 | -92,72 | 0,74 | -92,71 | 0,1641 | -2,3703 | |||
| PG / The Procter & Gamble Company | 0,01 | 0,00 | 0,61 | -1,76 | 0,1357 | -0,0199 | |||
| SYY / Sysco Corporation | 0,02 | 4,43 | 0,60 | -2,59 | 0,1331 | -0,0209 | |||
| CL / Colgate-Palmolive Company | 0,01 | -90,35 | 0,58 | -90,01 | 0,1284 | -1,3204 | |||
| WMT / Walmart Inc. | 0,00 | 0,00 | 0,35 | -0,86 | 0,0766 | -0,0105 | |||
| BMY / Bristol-Myers Squibb Company | 0,01 | -1,99 | 0,32 | 1,59 | 0,0706 | -0,0077 | |||
| CLX / The Clorox Company | 0,00 | 0,00 | 0,25 | -1,59 | 0,0547 | -0,0079 | |||
| APH / Amphenol Corporation | 0,00 | 0,00 | 0,22 | -0,45 | 0,0489 | -0,0065 | |||
| TEG / Integrys Energy Group, Inc. | 0,00 | -10,24 | 0,22 | -14,40 | 0,0487 | -0,0154 | |||
| MRK / Merck & Co., Inc. | 0,00 | -11,43 | 0,21 | -9,21 | 0,0458 | -0,0110 | |||
| UNP / Union Pacific Corporation | 0,00 | 0,00 | 0,20 | 0,49 | 0,0452 | -0,0055 | |||
| NKTR / Nektar Therapeutics | 0,01 | -12,58 | 0,12 | -21,09 | 0,0257 | -0,0110 |