Statistiques de base
| Valeur du portefeuille | $ 268 384 663 |
| Positions actuelles | 93 |
Dernières positions, performances, ASG (à partir des dépôts 13F, 13D)
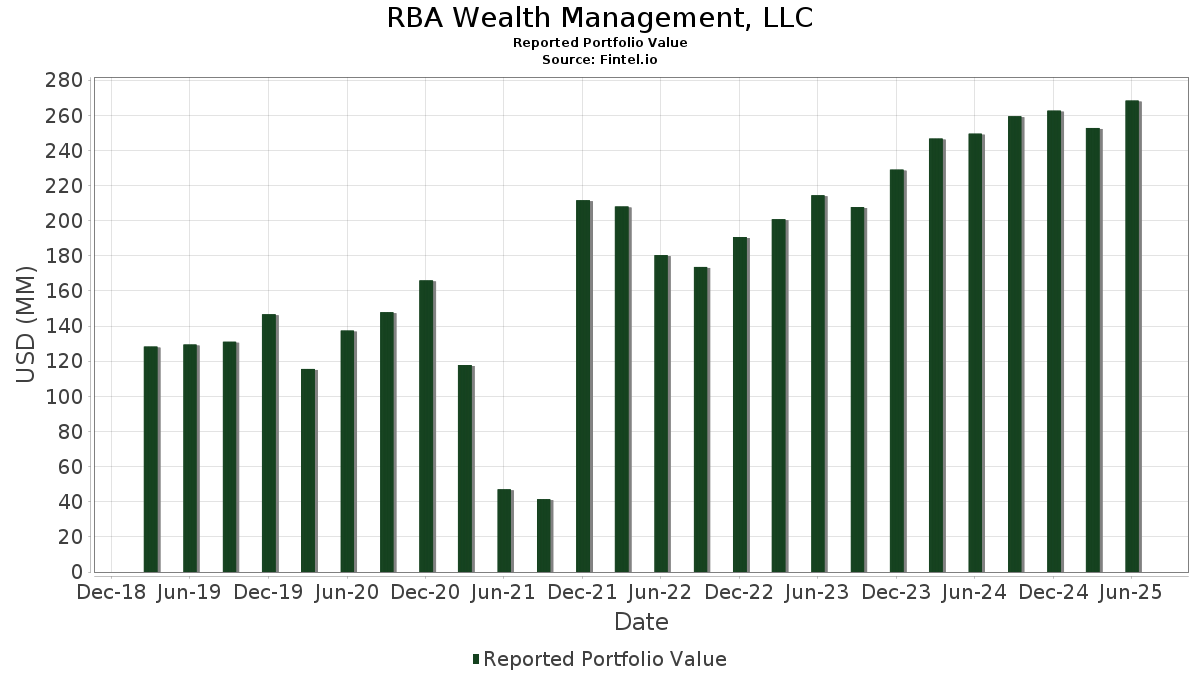
RBA Wealth Management, LLC a déclaré un total de 93 positions dans ses derniers dépôts auprès de la SEC. La valeur la plus récente du portefeuille est calculée à 268 384 663 USD. Les actifs sous gestion réels (ASG) sont cette valeur plus les liquidités (qui ne sont pas divulguées). Les principales positions de RBA Wealth Management, LLC sont Microsoft Corporation (US:MSFT) , Broadcom Inc. (US:AVGO) , Apple Inc. (US:AAPL) , Alphabet Inc. (US:GOOGL) , and Visa Inc. (US:V) . Les nouvelles positions de RBA Wealth Management, LLC incluent Ingredion Incorporated (US:INGR) , NRG Energy, Inc. (US:NRG) , .
Meilleures augmentations ce trimestre
Nous utilisons la variation de l'allocation du portefeuille car il s'agit de l'indicateur le plus significatif. Les changements peuvent être dus à des transactions ou à des variations de prix des actions.
| Titre | Actions (en millions) |
Valeur ($ en millions) |
% du portefeuille | ΔPortefeuille % |
|---|---|---|---|---|
| 0,01 | 5,64 | 2,1016 | 2,1016 | |
| 0,03 | 8,97 | 3,3419 | 1,1394 | |
| 0,02 | 2,80 | 1,0429 | 1,0429 | |
| 0,01 | 2,33 | 0,8686 | 0,8686 | |
| 0,02 | 10,03 | 3,7384 | 0,6747 | |
| 0,01 | 6,97 | 2,5982 | 0,5139 | |
| 0,02 | 5,20 | 1,9392 | 0,4448 | |
| 0,03 | 5,21 | 1,9400 | 0,3402 | |
| 0,01 | 5,34 | 1,9911 | 0,2949 | |
| 0,01 | 5,93 | 2,2078 | 0,2927 |
Principales baisses ce trimestre
Nous utilisons la variation de l'allocation du portefeuille car il s'agit de l'indicateur le plus significatif. Les changements peuvent être dus à des transactions ou à des variations de prix des actions.
| Titre | Actions (en millions) |
Valeur ($ en millions) |
% du portefeuille | ΔPortefeuille % |
|---|---|---|---|---|
| 0,01 | 0,60 | 0,2222 | -1,7863 | |
| 0,00 | 5,69 | 2,1204 | -1,4317 | |
| 0,02 | 3,98 | 1,4835 | -0,5057 | |
| 0,04 | 8,65 | 3,2236 | -0,4469 | |
| 0,00 | 1,03 | 0,3839 | -0,4380 | |
| 0,02 | 5,11 | 1,9041 | -0,3341 | |
| 0,02 | 3,98 | 1,4844 | -0,3234 | |
| 0,06 | 5,91 | 2,2007 | -0,2987 | |
| 0,02 | 4,59 | 1,7088 | -0,2464 | |
| 0,02 | 7,61 | 2,8344 | -0,2374 |
Déclarations 13F et dépôts de fonds
Ce formulaire a été déposé le 2025-07-17 pour la période de déclaration 2025-06-30. Cliquez sur l'icône du lien pour voir l'historique complet des transactions.
Mettre à niveau pour débloquer les données premium et exporter vers Excel ![]() .
.
| Titre | Type | Prix moyen de l'action | Actions (en millions) |
ΔActions (%) |
ΔActions (%) |
Valeur ($ en millions) |
Portefeuille (%) |
ΔPortefeuille (%) |
|
|---|---|---|---|---|---|---|---|---|---|
| MSFT / Microsoft Corporation | 0,02 | -2,23 | 10,03 | 29,56 | 3,7384 | 0,6747 | |||
| AVGO / Broadcom Inc. | 0,03 | -2,15 | 8,97 | 61,11 | 3,3419 | 1,1394 | |||
| AAPL / Apple Inc. | 0,04 | 0,96 | 8,65 | -6,76 | 3,2236 | -0,4469 | |||
| GOOGL / Alphabet Inc. | 0,05 | -1,02 | 8,27 | 12,80 | 3,0827 | 0,1811 | |||
| V / Visa Inc. | 0,02 | -3,30 | 7,61 | -2,02 | 2,8344 | -0,2374 | |||
| WM / Waste Management, Inc. | 0,03 | -0,54 | 7,25 | -1,70 | 2,7002 | -0,2161 | |||
| META / Meta Platforms, Inc. | 0,01 | 3,36 | 6,97 | 32,37 | 2,5982 | 0,5139 | |||
| CMI / Cummins Inc. | 0,02 | 0,02 | 6,81 | 4,51 | 2,5384 | -0,0403 | |||
| BSX / Boston Scientific Corporation | 0,06 | -5,26 | 6,80 | 0,88 | 2,5336 | -0,1330 | |||
| MET / MetLife, Inc. | 0,08 | 0,15 | 6,24 | 0,32 | 2,3258 | -0,1359 | |||
| EWBC / East West Bancorp, Inc. | 0,06 | 1,53 | 6,18 | 14,21 | 2,3029 | 0,1623 | |||
| SNPS / Synopsys, Inc. | 0,01 | 0,15 | 5,93 | 19,73 | 2,2111 | 0,2503 | |||
| ASML / ASML Holding N.V. - Depositary Receipt (Common Stock) | 0,01 | 1,20 | 5,93 | 22,39 | 2,2078 | 0,2927 | |||
| ACGL / Arch Capital Group Ltd. | 0,06 | -1,25 | 5,91 | -6,51 | 2,2007 | -0,2987 | |||
| CBOE / Cboe Global Markets, Inc. | 0,03 | 4,55 | 5,86 | 7,73 | 2,1852 | 0,0319 | |||
| AZO / AutoZone, Inc. | 0,00 | -34,90 | 5,69 | -36,63 | 2,1204 | -1,4317 | |||
| GS / The Goldman Sachs Group, Inc. | 0,01 | 5,64 | 2,1016 | 2,1016 | |||||
| URI / United Rentals, Inc. | 0,01 | 3,67 | 5,34 | 24,63 | 1,9911 | 0,2949 | |||
| AMAT / Applied Materials, Inc. | 0,03 | 2,06 | 5,21 | 28,77 | 1,9400 | 0,3402 | |||
| TSM / Taiwan Semiconductor Manufacturing Company Limited - Depositary Receipt (Common Stock) | 0,02 | 0,98 | 5,20 | 37,78 | 1,9392 | 0,4448 | |||
| TMUS / T-Mobile US, Inc. | 0,02 | 1,11 | 5,11 | -9,67 | 1,9041 | -0,3341 | |||
| HD / The Home Depot, Inc. | 0,01 | 0,46 | 5,01 | 0,50 | 1,8651 | -0,1053 | |||
| AEP / American Electric Power Company, Inc. | 0,05 | 1,55 | 4,96 | -3,58 | 1,8489 | -0,1868 | |||
| QCOM / QUALCOMM Incorporated | 0,03 | 0,75 | 4,91 | 4,45 | 1,8288 | -0,0301 | |||
| PG / The Procter & Gamble Company | 0,03 | 1,77 | 4,86 | -4,86 | 1,8105 | -0,2099 | |||
| MDT / Medtronic plc | 0,05 | 1,30 | 4,65 | -1,75 | 1,7329 | -0,1394 | |||
| CRM / Salesforce, Inc. | 0,02 | 0,96 | 4,61 | 2,58 | 1,7161 | -0,0600 | |||
| EXP / Eagle Materials Inc. | 0,02 | 1,89 | 4,59 | -7,20 | 1,7088 | -0,2464 | |||
| EA / Electronic Arts Inc. | 0,03 | 0,65 | 4,53 | 11,24 | 1,6890 | 0,0766 | |||
| ADBE / Adobe Inc. | 0,01 | 1,85 | 4,47 | 2,74 | 1,6645 | -0,0556 | |||
| FIS / Fidelity National Information Services, Inc. | 0,05 | 1,20 | 4,43 | 10,33 | 1,6519 | 0,0622 | |||
| FLS / Flowserve Corporation | 0,08 | 0,88 | 4,26 | 8,15 | 1,5877 | 0,0288 | |||
| CI / The Cigna Group | 0,01 | 5,06 | 4,16 | 5,56 | 1,5503 | -0,0090 | |||
| PVH / PVH Corp. | 0,06 | 1,23 | 4,04 | 7,42 | 1,5044 | 0,0176 | |||
| PLD / Prologis, Inc. | 0,04 | 0,30 | 4,01 | -5,70 | 1,4934 | -0,1877 | |||
| TRGP / Targa Resources Corp. | 0,02 | 0,40 | 3,98 | -12,83 | 1,4844 | -0,3234 | |||
| BDX / Becton, Dickinson and Company | 0,02 | 5,30 | 3,98 | -20,82 | 1,4835 | -0,5057 | |||
| KBH / KB Home | 0,07 | 2,67 | 3,50 | -6,44 | 1,3058 | -0,1758 | |||
| VGT / Vanguard World Fund - Vanguard Information Technology ETF | 0,01 | -0,19 | 3,40 | 22,08 | 1,2651 | 0,1646 | |||
| MHK / Mohawk Industries, Inc. | 0,03 | 3,59 | 3,33 | -4,88 | 1,2412 | -0,1442 | |||
| NXPI / NXP Semiconductors N.V. | 0,01 | 2,66 | 3,20 | 18,01 | 1,1939 | 0,1198 | |||
| INGR / Ingredion Incorporated | 0,02 | 2,80 | 1,0429 | 1,0429 | |||||
| TFX / Teleflex Incorporated | 0,02 | 6,23 | 2,69 | -9,03 | 1,0022 | -0,1673 | |||
| EOG / EOG Resources, Inc. | 0,02 | 5,31 | 2,59 | -1,78 | 0,9642 | -0,0780 | |||
| ACN / Accenture plc | 0,01 | 12,98 | 2,47 | 8,18 | 0,9218 | 0,0174 | |||
| NRG / NRG Energy, Inc. | 0,01 | 2,33 | 0,8686 | 0,8686 | |||||
| VICI / VICI Properties Inc. | 0,06 | 2,63 | 2,06 | 2,59 | 0,7662 | -0,0269 | |||
| BND / Vanguard Bond Index Funds - Vanguard Total Bond Market ETF | 0,02 | -0,68 | 1,62 | -0,43 | 0,6033 | -0,0401 | |||
| AGG / iShares Trust - iShares Core U.S. Aggregate Bond ETF | 0,02 | -2,24 | 1,60 | -1,97 | 0,5948 | -0,0493 | |||
| VFH / Vanguard World Fund - Vanguard Financials ETF | 0,01 | 4,56 | 1,52 | 11,41 | 0,5677 | 0,0267 | |||
| TGT / Target Corporation | 0,02 | 10,75 | 1,51 | 4,71 | 0,5632 | -0,0080 | |||
| BRK.A / Berkshire Hathaway Inc. | 0,00 | 0,00 | 1,46 | -8,71 | 0,5431 | -0,0886 | |||
| CVX / Chevron Corporation | 0,01 | -7,10 | 1,29 | -20,48 | 0,4804 | -0,1611 | |||
| AMZN / Amazon.com, Inc. | 0,01 | 0,02 | 1,18 | 15,36 | 0,4395 | 0,0349 | |||
| VCR / Vanguard World Fund - Vanguard Consumer Discretionary ETF | 0,00 | 7,82 | 1,07 | 20,02 | 0,4001 | 0,0462 | |||
| VHT / Vanguard World Fund - Vanguard Health Care ETF | 0,00 | 3,67 | 1,03 | -2,83 | 0,3845 | -0,0353 | |||
| UNH / UnitedHealth Group Incorporated | 0,00 | -16,74 | 1,03 | -50,41 | 0,3839 | -0,4380 | |||
| VIS / Vanguard World Fund - Vanguard Industrials ETF | 0,00 | 2,32 | 1,00 | 15,89 | 0,3722 | 0,0308 | |||
| VOX / Vanguard World Fund - Vanguard Communication Services ETF | 0,01 | -0,68 | 0,97 | 14,54 | 0,3611 | 0,0262 | |||
| JPM / JPMorgan Chase & Co. | 0,00 | -1,00 | 0,95 | 17,04 | 0,3535 | 0,0328 | |||
| WMT / Walmart Inc. | 0,01 | -10,59 | 0,87 | -0,46 | 0,3237 | -0,0214 | |||
| TSLA / Tesla, Inc. | 0,00 | 0,93 | 0,83 | 23,65 | 0,3081 | 0,0437 | |||
| SCHG / Schwab Strategic Trust - Schwab U.S. Large-Cap Growth ETF | 0,02 | 2,82 | 0,65 | 19,89 | 0,2406 | 0,0276 | |||
| CSCO / Cisco Systems, Inc. | 0,01 | -89,55 | 0,60 | -88,26 | 0,2222 | -1,7863 | |||
| NVDA / NVIDIA Corporation | 0,00 | 3,83 | 0,56 | 51,62 | 0,2090 | 0,0624 | |||
| OTTR / Otter Tail Corporation | 0,01 | -3,85 | 0,53 | -7,89 | 0,1959 | -0,0296 | |||
| VDC / Vanguard World Fund - Vanguard Consumer Staples ETF | 0,00 | -2,67 | 0,49 | -2,60 | 0,1816 | -0,0163 | |||
| IBM / International Business Machines Corporation | 0,00 | -16,36 | 0,48 | -0,83 | 0,1786 | -0,0127 | |||
| LMT / Lockheed Martin Corporation | 0,00 | -27,55 | 0,47 | -24,92 | 0,1743 | -0,0720 | |||
| SCHZ / Schwab Strategic Trust - Schwab U.S. Aggregate Bond ETF | 0,02 | 2,86 | 0,41 | 3,27 | 0,1528 | -0,0044 | |||
| DIS / The Walt Disney Company | 0,00 | -5,50 | 0,40 | 18,69 | 0,1493 | 0,0158 | |||
| QQQ / Invesco QQQ Trust, Series 1 | 0,00 | 0,56 | 0,40 | 18,51 | 0,1480 | 0,0152 | |||
| COST / Costco Wholesale Corporation | 0,00 | -7,08 | 0,39 | -2,74 | 0,1454 | -0,0133 | |||
| SCHM / Schwab Strategic Trust - Schwab U.S. Mid-Cap ETF | 0,01 | 2,67 | 0,38 | 9,86 | 0,1414 | 0,0048 | |||
| SPYG / SPDR Series Trust - SPDR Portfolio S&P 500 Growth ETF | 0,00 | 1,37 | 0,37 | 20,32 | 0,1390 | 0,0163 | |||
| SPY / SPDR S&P 500 ETF | 0,00 | -7,75 | 0,35 | 1,73 | 0,1315 | -0,0055 | |||
| VDE / Vanguard World Fund - Vanguard Energy ETF | 0,00 | 13,19 | 0,35 | 3,83 | 0,1314 | -0,0028 | |||
| CB / Chubb Limited | 0,00 | -1,53 | 0,33 | -5,65 | 0,1247 | -0,0154 | |||
| PEP / PepsiCo, Inc. | 0,00 | -19,54 | 0,30 | -29,21 | 0,1130 | -0,0563 | |||
| SCHA / Schwab Strategic Trust - Schwab U.S. Small-Cap ETF | 0,01 | 5,67 | 0,30 | 13,96 | 0,1128 | 0,0078 | |||
| TECK / Teck Resources Limited | 0,01 | -9,87 | 0,30 | 0,00 | 0,1111 | -0,0070 | |||
| CPRT / Copart, Inc. | 0,01 | 0,00 | 0,27 | -13,38 | 0,1016 | -0,0228 | |||
| IAGG / iShares Trust - iShares Core International Aggregate Bond ETF | 0,01 | 7,42 | 0,26 | 9,54 | 0,0986 | 0,0032 | |||
| SCHV / Schwab Strategic Trust - Schwab U.S. Large-Cap Value ETF | 0,01 | 0,37 | 0,26 | 4,49 | 0,0956 | -0,0016 | |||
| SCHF / Schwab Strategic Trust - Schwab International Equity ETF | 0,01 | -0,95 | 0,26 | 10,39 | 0,0953 | 0,0039 | |||
| VNQ / Vanguard Specialized Funds - Vanguard Real Estate ETF | 0,00 | 4,63 | 0,26 | 2,82 | 0,0953 | -0,0030 | |||
| VPU / Vanguard World Fund - Vanguard Utilities ETF | 0,00 | 4,64 | 0,25 | 8,09 | 0,0949 | 0,0017 | |||
| JEPI / J.P. Morgan Exchange-Traded Fund Trust - JPMorgan Equity Premium Income ETF | 0,00 | -5,11 | 0,25 | -5,66 | 0,0933 | -0,0116 | |||
| MCD / McDonald's Corporation | 0,00 | -0,71 | 0,24 | -6,87 | 0,0909 | -0,0130 | |||
| BRK.B / Berkshire Hathaway Inc. | 0,00 | -7,89 | 0,24 | -15,90 | 0,0887 | -0,0234 | |||
| RJF / Raymond James Financial, Inc. | 0,00 | -2,81 | 0,23 | 7,37 | 0,0870 | 0,0009 | |||
| FDX / FedEx Corporation | 0,00 | -1,00 | 0,22 | -7,82 | 0,0837 | -0,0126 | |||
| VAW / Vanguard World Fund - Vanguard Materials ETF | 0,00 | 1,29 | 0,21 | 4,41 | 0,0797 | -0,0013 | |||
| COP / ConocoPhillips | 0,00 | -100,00 | 0,00 | 0,0000 | |||||
| JNJ / Johnson & Johnson | 0,00 | -100,00 | 0,00 | 0,0000 | |||||
| SPGI / S&P Global Inc. | 0,00 | -100,00 | 0,00 | 0,0000 | |||||
| XOM / Exxon Mobil Corporation | 0,00 | -100,00 | 0,00 | 0,0000 |