Statistiques de base
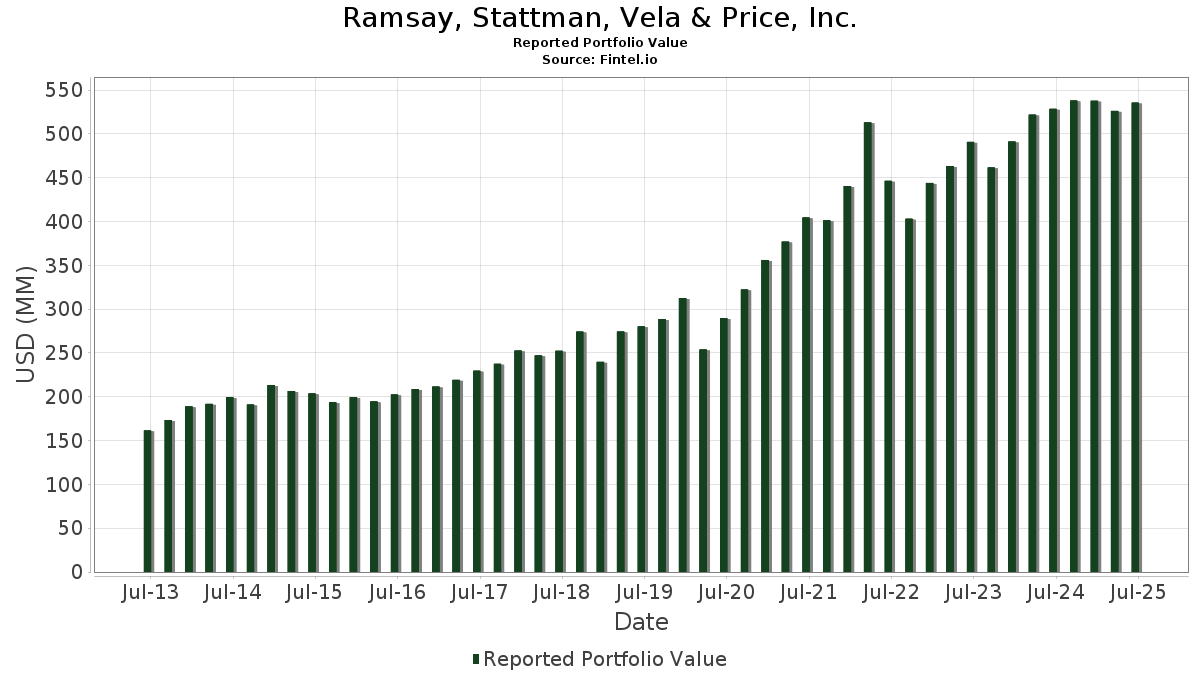
| Valeur du portefeuille | $ 535 537 366 |
| Positions actuelles | 80 |
Dernières positions, performances, ASG (à partir des dépôts 13F, 13D)
Ramsay, Stattman, Vela & Price, Inc. a déclaré un total de 80 positions dans ses derniers dépôts auprès de la SEC. La valeur la plus récente du portefeuille est calculée à 535 537 366 USD. Les actifs sous gestion réels (ASG) sont cette valeur plus les liquidités (qui ne sont pas divulguées). Les principales positions de Ramsay, Stattman, Vela & Price, Inc. sont Microsoft Corporation (US:MSFT) , Apple Inc. (US:AAPL) , NVIDIA Corporation (US:NVDA) , Berkshire Hathaway Inc. (US:BRK.A) , and Visa Inc. (US:V) . Les nouvelles positions de Ramsay, Stattman, Vela & Price, Inc. incluent Ralliant Corporation (US:RAL) , .
Meilleures augmentations ce trimestre
Nous utilisons la variation de l'allocation du portefeuille car il s'agit de l'indicateur le plus significatif. Les changements peuvent être dus à des transactions ou à des variations de prix des actions.
| Titre | Actions (en millions) |
Valeur ($ en millions) |
% du portefeuille | ΔPortefeuille % |
|---|---|---|---|---|
| 0,11 | 53,76 | 10,0391 | 2,0267 | |
| 0,17 | 27,29 | 5,0953 | 1,8752 | |
| 0,08 | 17,08 | 3,1896 | 0,5166 | |
| 0,00 | 3,23 | 0,6029 | 0,4886 | |
| 0,08 | 10,27 | 1,9178 | 0,2814 | |
| 0,06 | 6,88 | 1,2851 | 0,2549 | |
| 0,03 | 5,93 | 1,1070 | 0,1642 | |
| 0,03 | 4,60 | 0,8586 | 0,1642 | |
| 0,04 | 7,24 | 1,3510 | 0,1577 | |
| 0,01 | 4,01 | 0,7486 | 0,1072 |
Principales baisses ce trimestre
Nous utilisons la variation de l'allocation du portefeuille car il s'agit de l'indicateur le plus significatif. Les changements peuvent être dus à des transactions ou à des variations de prix des actions.
| Titre | Actions (en millions) |
Valeur ($ en millions) |
% du portefeuille | ΔPortefeuille % |
|---|---|---|---|---|
| 0,17 | 35,47 | 6,6234 | -0,9556 | |
| 0,08 | 14,35 | 2,6802 | -0,8510 | |
| 0,03 | 4,98 | 0,9296 | -0,7587 | |
| 0,05 | 23,67 | 4,4191 | -0,6901 | |
| 0,02 | 6,21 | 1,1588 | -0,3744 | |
| 0,06 | 12,80 | 2,3900 | -0,2950 | |
| 0,07 | 11,29 | 2,1090 | -0,2712 | |
| 0,09 | 11,51 | 2,1492 | -0,2236 | |
| 0,08 | 12,55 | 2,3442 | -0,2149 | |
| 0,04 | 6,15 | 1,1486 | -0,1687 |
Déclarations 13F et dépôts de fonds
Ce formulaire a été déposé le 2025-07-31 pour la période de déclaration 2025-06-30. Cliquez sur l'icône du lien pour voir l'historique complet des transactions.
Mettre à niveau pour débloquer les données premium et exporter vers Excel ![]() .
.
| Titre | Type | Prix moyen de l'action | Actions (en millions) |
ΔActions (%) |
ΔActions (%) |
Valeur ($ en millions) |
Portefeuille (%) |
ΔPortefeuille (%) |
|
|---|---|---|---|---|---|---|---|---|---|
| MSFT / Microsoft Corporation | 0,11 | -3,75 | 53,76 | 27,53 | 10,0391 | 2,0267 | |||
| AAPL / Apple Inc. | 0,17 | -3,69 | 35,47 | -11,05 | 6,6234 | -0,9556 | |||
| NVDA / NVIDIA Corporation | 0,17 | 10,49 | 27,29 | 61,06 | 5,0953 | 1,8752 | |||
| BRK.A / Berkshire Hathaway Inc. | 0,05 | -3,48 | 23,67 | -11,96 | 4,4191 | -0,6901 | |||
| V / Visa Inc. | 0,05 | -1,71 | 19,42 | -0,42 | 3,6264 | -0,0803 | |||
| SYK / Stryker Corporation | 0,05 | -3,08 | 19,10 | 3,02 | 3,5663 | 0,0424 | |||
| GOOG / Alphabet Inc. | 0,10 | -8,84 | 18,31 | 3,51 | 3,4189 | 0,0567 | |||
| ADP / Automatic Data Processing, Inc. | 0,06 | -2,89 | 17,22 | -1,98 | 3,2148 | -0,1234 | |||
| AMZN / Amazon.com, Inc. | 0,08 | 5,33 | 17,08 | 21,46 | 3,1896 | 0,5166 | |||
| ABT / Abbott Laboratories | 0,11 | -3,34 | 14,73 | -0,89 | 2,7499 | -0,0743 | |||
| FI / Fiserv, Inc. | 0,08 | -1,05 | 14,35 | -22,75 | 2,6802 | -0,8510 | |||
| COST / Costco Wholesale Corporation | 0,01 | -3,24 | 13,29 | 1,27 | 2,4814 | -0,0125 | |||
| DHR / Danaher Corporation | 0,06 | -5,98 | 12,80 | -9,39 | 2,3900 | -0,2950 | |||
| PG / The Procter & Gamble Company | 0,08 | -0,26 | 12,55 | -6,76 | 2,3442 | -0,2149 | |||
| HD / The Home Depot, Inc. | 0,03 | -1,46 | 12,48 | -1,43 | 2,3313 | -0,0759 | |||
| ITW / Illinois Tool Works Inc. | 0,05 | -1,97 | 12,45 | -2,27 | 2,3248 | -0,0965 | |||
| PEP / PepsiCo, Inc. | 0,09 | 4,69 | 11,51 | -7,80 | 2,1492 | -0,2236 | |||
| JNJ / Johnson & Johnson | 0,07 | -2,08 | 11,29 | -9,81 | 2,1090 | -0,2712 | |||
| EMR / Emerson Electric Co. | 0,08 | -1,91 | 10,27 | 19,28 | 1,9178 | 0,2814 | |||
| KO / The Coca-Cola Company | 0,14 | -5,32 | 10,05 | -6,48 | 1,8770 | -0,1658 | |||
| IJH / iShares Trust - iShares Core S&P Mid-Cap ETF | 0,15 | -3,96 | 9,04 | 2,08 | 1,6883 | 0,0048 | |||
| LIN / Linde plc | 0,02 | -4,03 | 8,10 | -3,31 | 1,5134 | -0,0797 | |||
| IWM / iShares Trust - iShares Russell 2000 ETF | 0,04 | -4,74 | 8,01 | 3,05 | 1,4950 | 0,0182 | |||
| GOOGL / Alphabet Inc. | 0,04 | 1,12 | 7,24 | 15,24 | 1,3510 | 0,1577 | |||
| NSRGY / Nestlé S.A. - Depositary Receipt (Common Stock) | 0,07 | -2,53 | 6,90 | -4,33 | 1,2886 | -0,0822 | |||
| DIS / The Walt Disney Company | 0,06 | 1,06 | 6,88 | 26,97 | 1,2851 | 0,2549 | |||
| TMO / Thermo Fisher Scientific Inc. | 0,02 | -5,59 | 6,21 | -23,07 | 1,1588 | -0,3744 | |||
| CSCO / Cisco Systems, Inc. | 0,09 | -2,12 | 6,17 | 10,06 | 1,1525 | 0,0865 | |||
| CVX / Chevron Corporation | 0,04 | 3,69 | 6,15 | -11,24 | 1,1486 | -0,1687 | |||
| PANW / Palo Alto Networks, Inc. | 0,03 | -0,34 | 5,93 | 19,52 | 1,1070 | 0,1642 | |||
| SBUX / Starbucks Corporation | 0,06 | -3,87 | 5,92 | -10,20 | 1,1060 | -0,1476 | |||
| EFA / iShares Trust - iShares MSCI EAFE ETF | 0,06 | -8,01 | 5,75 | 0,61 | 1,0735 | -0,0125 | |||
| NKE / NIKE, Inc. | 0,07 | -4,11 | 5,26 | 7,32 | 0,9825 | 0,0506 | |||
| BDX / Becton, Dickinson and Company | 0,03 | -25,47 | 4,98 | -43,95 | 0,9296 | -0,7587 | |||
| APD / Air Products and Chemicals, Inc. | 0,02 | 2,42 | 4,86 | -2,04 | 0,9072 | -0,0355 | |||
| ADBE / Adobe Inc. | 0,01 | 0,96 | 4,68 | 1,85 | 0,8734 | 0,0005 | |||
| AMAT / Applied Materials, Inc. | 0,03 | -0,24 | 4,60 | 25,87 | 0,8586 | 0,1642 | |||
| MKC / McCormick & Company, Incorporated | 0,06 | -5,40 | 4,40 | -12,84 | 0,8224 | -0,1382 | |||
| CL / Colgate-Palmolive Company | 0,05 | -4,68 | 4,21 | -7,53 | 0,7870 | -0,0793 | |||
| TSLA / Tesla, Inc. | 0,01 | -3,07 | 4,01 | 18,79 | 0,7486 | 0,1072 | |||
| SPY / SPDR S&P 500 ETF | 0,01 | -0,92 | 3,74 | 9,43 | 0,6981 | 0,0488 | |||
| FDX / FedEx Corporation | 0,02 | 0,72 | 3,71 | -6,10 | 0,6929 | -0,0581 | |||
| ASML / ASML Holding N.V. - Depositary Receipt (Common Stock) | 0,00 | 343,72 | 3,23 | 437,10 | 0,6029 | 0,4886 | |||
| ROP / Roper Technologies, Inc. | 0,01 | 7,86 | 2,95 | 3,69 | 0,5518 | 0,0102 | |||
| JPM / JPMorgan Chase & Co. | 0,01 | 0,00 | 2,86 | 18,17 | 0,5346 | 0,0742 | |||
| VCSH / Vanguard Scottsdale Funds - Vanguard Short-Term Corporate Bond ETF | 0,03 | 7,50 | 2,74 | 8,27 | 0,5111 | 0,0306 | |||
| XOM / Exxon Mobil Corporation | 0,02 | -4,33 | 2,66 | -13,26 | 0,4960 | -0,0862 | |||
| IDXX / IDEXX Laboratories, Inc. | 0,00 | 0,00 | 2,24 | 27,72 | 0,4181 | 0,0849 | |||
| MCD / McDonald's Corporation | 0,01 | -0,16 | 2,20 | -6,64 | 0,4100 | -0,0369 | |||
| PNC / The PNC Financial Services Group, Inc. | 0,01 | 0,00 | 1,86 | 6,09 | 0,3481 | 0,0140 | |||
| MRK / Merck & Co., Inc. | 0,02 | -3,54 | 1,79 | -14,93 | 0,3342 | -0,0657 | |||
| VO / Vanguard Index Funds - Vanguard Mid-Cap ETF | 0,00 | 0,00 | 1,39 | 8,16 | 0,2599 | 0,0154 | |||
| VEA / Vanguard Tax-Managed Funds - Vanguard FTSE Developed Markets ETF | 0,02 | -4,10 | 1,39 | 7,51 | 0,2595 | 0,0139 | |||
| VGT / Vanguard World Fund - Vanguard Information Technology ETF | 0,00 | -18,79 | 1,38 | -0,72 | 0,2569 | -0,0064 | |||
| VERSX / Vanguard Emerging Markets Stock Index Fund | 0,03 | -10,83 | 1,33 | -2,57 | 0,2478 | -0,0110 | |||
| IJR / iShares Trust - iShares Core S&P Small-Cap ETF | 0,01 | 5,15 | 1,28 | 9,96 | 0,2392 | 0,0177 | |||
| RTX / RTX Corporation | 0,01 | -17,65 | 1,21 | -9,25 | 0,2255 | -0,0273 | |||
| SCHW / The Charles Schwab Corporation | 0,01 | 3,55 | 1,10 | 20,66 | 0,2063 | 0,0323 | |||
| FTV / Fortive Corporation | 0,02 | -0,24 | 0,97 | -28,98 | 0,1818 | -0,0786 | |||
| WMT / Walmart Inc. | 0,01 | -0,89 | 0,92 | 10,31 | 0,1719 | 0,0134 | |||
| ZBH / Zimmer Biomet Holdings, Inc. | 0,01 | -6,89 | 0,87 | -24,98 | 0,1622 | -0,0578 | |||
| AMD / Advanced Micro Devices, Inc. | 0,01 | -0,99 | 0,77 | 36,79 | 0,1431 | 0,0366 | |||
| BMY / Bristol-Myers Squibb Company | 0,02 | -8,68 | 0,73 | -30,67 | 0,1364 | -0,0639 | |||
| EEM / iShares, Inc. - iShares MSCI Emerging Markets ETF | 0,01 | -47,95 | 0,72 | -42,53 | 0,1343 | -0,1036 | |||
| CAT / Caterpillar Inc. | 0,00 | -0,69 | 0,50 | 16,94 | 0,0942 | 0,0122 | |||
| DEO / Diageo plc - Depositary Receipt (Common Stock) | 0,00 | -59,42 | 0,49 | -60,95 | 0,0923 | -0,1483 | |||
| T / AT&T Inc. | 0,02 | -16,42 | 0,44 | -14,40 | 0,0822 | -0,0156 | |||
| URI / United Rentals, Inc. | 0,00 | 0,00 | 0,40 | 20,06 | 0,0739 | 0,0113 | |||
| AXP / American Express Company | 0,00 | -0,49 | 0,39 | 17,82 | 0,0730 | 0,0100 | |||
| TTWO / Take-Two Interactive Software, Inc. | 0,00 | 0,00 | 0,36 | 17,42 | 0,0680 | 0,0089 | |||
| IVV / iShares Trust - iShares Core S&P 500 ETF | 0,00 | -1,99 | 0,31 | 8,51 | 0,0572 | 0,0034 | |||
| RAL / Ralliant Corporation | 0,01 | 0,30 | 0,0563 | 0,0563 | |||||
| XEL / Xcel Energy Inc. | 0,00 | 0,00 | 0,28 | -3,82 | 0,0518 | -0,0030 | |||
| ITA / iShares Trust - iShares U.S. Aerospace & Defense ETF | 0,00 | 0,00 | 0,26 | 23,36 | 0,0493 | 0,0086 | |||
| VTIP / Vanguard Malvern Funds - Vanguard Short-Term Inflation-Protected Securities ETF | 0,01 | 0,00 | 0,26 | 0,78 | 0,0485 | -0,0005 | |||
| AVUS / American Century ETF Trust - Avantis U.S. Equity ETF | 0,00 | 0,00 | 0,25 | 9,25 | 0,0464 | 0,0031 | |||
| EL / The Estée Lauder Companies Inc. | 0,00 | -23,27 | 0,22 | -6,01 | 0,0410 | -0,0034 | |||
| HON / Honeywell International Inc. | 0,00 | 0,22 | 0,0407 | 0,0407 | |||||
| VOO / Vanguard Index Funds - Vanguard S&P 500 ETF | 0,00 | -11,88 | 0,21 | -2,78 | 0,0393 | -0,0018 | |||
| TGT / Target Corporation | 0,00 | 0,00 | 0,21 | -5,43 | 0,0391 | -0,0030 | |||
| VZ / Verizon Communications Inc. | 0,00 | -100,00 | 0,00 | 0,0000 |