Statistiques de base
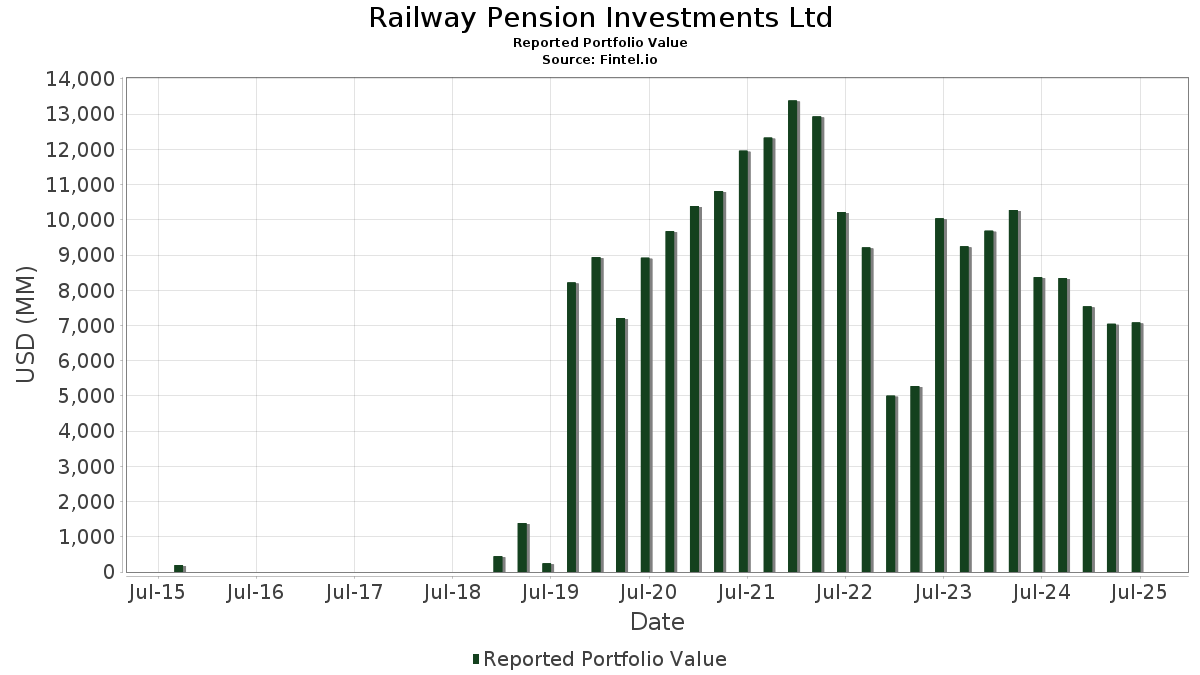
| Valeur du portefeuille | $ 7 083 275 793 |
| Positions actuelles | 210 |
Dernières positions, performances, ASG (à partir des dépôts 13F, 13D)
Railway Pension Investments Ltd a déclaré un total de 210 positions dans ses derniers dépôts auprès de la SEC. La valeur la plus récente du portefeuille est calculée à 7 083 275 793 USD. Les actifs sous gestion réels (ASG) sont cette valeur plus les liquidités (qui ne sont pas divulguées). Les principales positions de Railway Pension Investments Ltd sont Microsoft Corporation (US:MSFT) , Gilead Sciences, Inc. (US:GILD) , Visa Inc. (US:V) , Cameco Corporation (US:CCJ) , and Constellation Energy Corporation (US:CEG) . Les nouvelles positions de Railway Pension Investments Ltd incluent Viking Holdings Ltd (US:VIK) , Curtiss-Wright Corporation (US:CW) , Coca-Cola Europacific Partners PLC (MX:CCEP N) , .
Meilleures augmentations ce trimestre
Nous utilisons la variation de l'allocation du portefeuille car il s'agit de l'indicateur le plus significatif. Les changements peuvent être dus à des transactions ou à des variations de prix des actions.
| Titre | Actions (en millions) |
Valeur ($ en millions) |
% du portefeuille | ΔPortefeuille % |
|---|---|---|---|---|
| 1,65 | 122,75 | 1,7329 | 0,7358 | |
| 1,06 | 99,05 | 1,3984 | 0,6912 | |
| 0,37 | 120,32 | 1,6987 | 0,5687 | |
| 0,37 | 100,67 | 1,4212 | 0,4101 | |
| 1,15 | 27,84 | 0,3930 | 0,3607 | |
| 1,10 | 50,89 | 0,7184 | 0,3585 | |
| 0,09 | 50,35 | 0,7108 | 0,3258 | |
| 0,12 | 61,55 | 0,8690 | 0,3135 | |
| 0,17 | 26,80 | 0,3784 | 0,2818 | |
| 0,06 | 19,57 | 0,2763 | 0,2763 |
Principales baisses ce trimestre
Nous utilisons la variation de l'allocation du portefeuille car il s'agit de l'indicateur le plus significatif. Les changements peuvent être dus à des transactions ou à des variations de prix des actions.
| Titre | Actions (en millions) |
Valeur ($ en millions) |
% du portefeuille | ΔPortefeuille % |
|---|---|---|---|---|
| 0,39 | 38,15 | 0,5386 | -0,5038 | |
| 0,36 | 127,51 | 1,8002 | -0,4676 | |
| 0,64 | 119,20 | 1,6828 | -0,4592 | |
| 0,02 | 1,23 | 0,0174 | -0,4142 | |
| 0,80 | 57,41 | 0,8104 | -0,4032 | |
| 0,49 | 99,72 | 1,4079 | -0,3905 | |
| 0,32 | 96,81 | 1,3667 | -0,2567 | |
| 0,61 | 97,74 | 1,3799 | -0,2297 | |
| 0,67 | 102,01 | 1,4402 | -0,2244 | |
| 0,12 | 47,06 | 0,6644 | -0,2210 |
Déclarations 13F et dépôts de fonds
Ce formulaire a été déposé le 2025-08-13 pour la période de déclaration 2025-06-30. Cliquez sur l'icône du lien pour voir l'historique complet des transactions.
Mettre à niveau pour débloquer les données premium et exporter vers Excel ![]() .
.
| Titre | Type | Prix moyen de l'action | Actions (en millions) |
ΔActions (%) |
ΔActions (%) |
Valeur ($ en millions) |
Portefeuille (%) |
ΔPortefeuille (%) |
|
|---|---|---|---|---|---|---|---|---|---|
| MSFT / Microsoft Corporation | 0,31 | -20,51 | 155,59 | 5,33 | 2,1966 | 0,1002 | |||
| GILD / Gilead Sciences, Inc. | 1,37 | -4,09 | 152,28 | -5,10 | 2,1498 | -0,1275 | |||
| V / Visa Inc. | 0,36 | -21,23 | 127,51 | -20,20 | 1,8002 | -0,4676 | |||
| CCJ / Cameco Corporation | 1,65 | -3,12 | 122,75 | 74,71 | 1,7329 | 0,7358 | |||
| CEG / Constellation Energy Corporation | 0,37 | -5,60 | 120,32 | 51,12 | 1,6987 | 0,5687 | |||
| ABBV / AbbVie Inc. | 0,64 | -10,86 | 119,20 | -21,02 | 1,6828 | -0,4592 | |||
| LNG / Cheniere Energy, Inc. | 0,48 | -0,13 | 116,18 | 5,11 | 1,6402 | 0,0714 | |||
| META / Meta Platforms, Inc. | 0,15 | -24,46 | 114,20 | -3,26 | 1,6122 | -0,0632 | |||
| ORLY / O'Reilly Automotive, Inc. | 1,21 | 1 323,15 | 108,93 | -10,46 | 1,5378 | -0,1888 | |||
| GOOGL / Alphabet Inc. | 0,61 | -13,28 | 107,01 | -1,17 | 1,5107 | -0,0260 | |||
| AMZN / Amazon.com, Inc. | 0,47 | -13,64 | 103,62 | -0,42 | 1,4629 | -0,0139 | |||
| JNJ / Johnson & Johnson | 0,67 | -5,57 | 102,01 | -13,03 | 1,4402 | -0,2244 | |||
| AVGO / Broadcom Inc. | 0,37 | -14,17 | 100,67 | 41,30 | 1,4212 | 0,4101 | |||
| MO / Altria Group, Inc. | 1,71 | -7,04 | 100,54 | -9,19 | 1,4195 | -0,1520 | |||
| AAPL / Apple Inc. | 0,49 | -14,80 | 99,72 | -21,30 | 1,4079 | -0,3905 | |||
| HOOD / Robinhood Markets, Inc. | 1,06 | -11,64 | 99,05 | 98,77 | 1,3984 | 0,6912 | |||
| SPGI / S&P Global Inc. | 0,19 | -13,82 | 98,02 | -10,56 | 1,3839 | -0,1716 | |||
| PG / The Procter & Gamble Company | 0,61 | -7,81 | 97,74 | -13,82 | 1,3799 | -0,2297 | |||
| ACN / Accenture plc | 0,32 | -11,65 | 96,81 | -15,37 | 1,3667 | -0,2567 | |||
| NOW / ServiceNow, Inc. | 0,09 | -17,57 | 94,07 | 6,45 | 1,3280 | 0,0739 | |||
| MCK / McKesson Corporation | 0,13 | -8,56 | 92,42 | -0,43 | 1,3048 | -0,0126 | |||
| PANW / Palo Alto Networks, Inc. | 0,45 | -14,52 | 92,38 | 2,51 | 1,3041 | 0,0252 | |||
| PM / Philip Morris International Inc. | 0,50 | -2,23 | 90,96 | 12,18 | 1,2842 | 0,1334 | |||
| MRK / Merck & Co., Inc. | 1,15 | 26,63 | 90,74 | 11,68 | 1,2811 | 0,1279 | |||
| CSCO / Cisco Systems, Inc. | 1,29 | -11,25 | 89,41 | -0,22 | 1,2622 | -0,0095 | |||
| FCX / Freeport-McMoRan Inc. | 2,04 | 8,14 | 88,25 | 23,83 | 1,2459 | 0,2344 | |||
| AZO / AutoZone, Inc. | 0,02 | -8,49 | 87,99 | -10,91 | 1,2422 | -0,1594 | |||
| NEE / NextEra Energy, Inc. | 1,24 | -6,25 | 85,99 | -8,20 | 1,2139 | -0,1153 | |||
| CNP / CenterPoint Energy, Inc. | 2,30 | 0,00 | 84,49 | 1,41 | 1,1928 | 0,0104 | |||
| EQT / EQT Corporation | 1,44 | 0,00 | 84,17 | 9,15 | 1,1883 | 0,0939 | |||
| IDXX / IDEXX Laboratories, Inc. | 0,15 | -6,54 | 82,77 | 19,36 | 1,1686 | 0,1844 | |||
| PEG / Public Service Enterprise Group Incorporated | 0,96 | 10,77 | 80,87 | 13,30 | 1,1417 | 0,1287 | |||
| EQIX / Equinix, Inc. | 0,10 | -12,15 | 80,56 | -14,29 | 1,1373 | -0,1966 | |||
| BKNG / Booking Holdings Inc. | 0,01 | -8,05 | 79,31 | 15,54 | 1,1197 | 0,1455 | |||
| FAST / Fastenal Company | 1,86 | 85,20 | 78,12 | 0,30 | 1,1029 | -0,0025 | |||
| DASH / DoorDash, Inc. | 0,31 | -10,44 | 76,00 | 20,80 | 1,0729 | 0,1800 | |||
| TXN / Texas Instruments Incorporated | 0,35 | -14,51 | 72,79 | -1,23 | 1,0276 | -0,0182 | |||
| CL / Colgate-Palmolive Company | 0,79 | -8,31 | 72,05 | -11,05 | 1,0172 | -0,1323 | |||
| TECK / Teck Resources Limited | 1,77 | 0,00 | 71,42 | 10,84 | 1,0082 | 0,0938 | |||
| GWW / W.W. Grainger, Inc. | 0,06 | -13,99 | 63,34 | -9,42 | 0,8942 | -0,0982 | |||
| CRWD / CrowdStrike Holdings, Inc. | 0,12 | 8,86 | 61,55 | 57,25 | 0,8690 | 0,3135 | |||
| COST / Costco Wholesale Corporation | 0,06 | -7,14 | 57,95 | -2,80 | 0,8182 | -0,0280 | |||
| KR / The Kroger Co. | 0,80 | -36,65 | 57,41 | -32,87 | 0,8104 | -0,4032 | |||
| DHR / Danaher Corporation | 0,28 | -7,50 | 54,86 | -10,86 | 0,7745 | -0,0989 | |||
| EOG / EOG Resources, Inc. | 0,45 | 6,85 | 53,72 | -0,34 | 0,7584 | -0,0066 | |||
| FTNT / Fortinet, Inc. | 0,48 | -6,46 | 51,16 | 2,75 | 0,7222 | 0,0156 | |||
| BMY / Bristol-Myers Squibb Company | 1,10 | 164,38 | 50,89 | 100,66 | 0,7184 | 0,3585 | |||
| MA / Mastercard Incorporated | 0,09 | 81,01 | 50,35 | 85,58 | 0,7108 | 0,3258 | |||
| DDOG / Datadog, Inc. | 0,37 | 0,00 | 49,94 | 35,40 | 0,7050 | 0,1816 | |||
| NDAQ / Nasdaq, Inc. | 0,54 | 0,00 | 47,86 | 17,87 | 0,6756 | 0,0994 | |||
| HD / The Home Depot, Inc. | 0,13 | -9,67 | 47,28 | -9,63 | 0,6675 | -0,0750 | |||
| CMS / CMS Energy Corporation | 0,68 | 0,00 | 47,19 | -7,76 | 0,6663 | -0,0599 | |||
| TMO / Thermo Fisher Scientific Inc. | 0,12 | -7,42 | 47,06 | -24,56 | 0,6644 | -0,2210 | |||
| OTIS / Otis Worldwide Corporation | 0,47 | -10,63 | 46,55 | -14,25 | 0,6572 | -0,1132 | |||
| CTAS / Cintas Corporation | 0,20 | -8,69 | 45,44 | -0,98 | 0,6415 | -0,0098 | |||
| FICO / Fair Isaac Corporation | 0,02 | -9,23 | 44,95 | -10,03 | 0,6346 | -0,0744 | |||
| RSG / Republic Services, Inc. | 0,18 | 8,09 | 44,81 | 10,08 | 0,6327 | 0,0549 | |||
| IBM / International Business Machines Corporation | 0,15 | -8,27 | 43,80 | 8,74 | 0,6184 | 0,0467 | |||
| ROL / Rollins, Inc. | 0,75 | -6,99 | 42,55 | -2,88 | 0,6007 | -0,0211 | |||
| CTSH / Cognizant Technology Solutions Corporation | 0,54 | 0,22 | 42,29 | 2,23 | 0,5971 | 0,0099 | |||
| HCA / HCA Healthcare, Inc. | 0,11 | 2,20 | 40,90 | 13,31 | 0,5775 | 0,0651 | |||
| MSI / Motorola Solutions, Inc. | 0,10 | -8,98 | 40,07 | -12,59 | 0,5657 | -0,0849 | |||
| NTNX / Nutanix, Inc. | 0,51 | 0,00 | 39,11 | 9,50 | 0,5521 | 0,0452 | |||
| WMT / Walmart Inc. | 0,39 | -53,37 | 38,15 | -48,06 | 0,5386 | -0,5038 | |||
| TJX / The TJX Companies, Inc. | 0,31 | -3,01 | 37,79 | -1,67 | 0,5335 | -0,0119 | |||
| IT / Gartner, Inc. | 0,09 | -19,12 | 36,94 | -22,11 | 0,5215 | -0,1515 | |||
| HPQ / HP Inc. | 1,51 | -1,11 | 36,88 | -12,64 | 0,5206 | -0,0785 | |||
| CHKP / Check Point Software Technologies Ltd. | 0,17 | -7,15 | 36,80 | -9,86 | 0,5195 | -0,0599 | |||
| VLTO / Veralto Corporation | 0,36 | -2,68 | 36,68 | 0,82 | 0,5178 | 0,0015 | |||
| LPLA / LPL Financial Holdings Inc. | 0,10 | 26,14 | 36,18 | 44,59 | 0,5108 | 0,1557 | |||
| HES / Hess Corporation | 0,26 | 0,00 | 35,38 | -13,27 | 0,4995 | -0,0794 | |||
| VZ / Verizon Communications Inc. | 0,81 | 22,25 | 34,92 | 16,62 | 0,4930 | 0,0680 | |||
| NTAP / NetApp, Inc. | 0,32 | 2,07 | 34,61 | 23,81 | 0,4887 | 0,0919 | |||
| ADP / Automatic Data Processing, Inc. | 0,11 | 4,05 | 34,11 | 5,03 | 0,4815 | 0,0206 | |||
| CVX / Chevron Corporation | 0,23 | 0,00 | 33,09 | -14,41 | 0,4672 | -0,0815 | |||
| WM / Waste Management, Inc. | 0,14 | 14,93 | 32,94 | 13,59 | 0,4651 | 0,0535 | |||
| GH / Guardant Health, Inc. | 0,62 | 0,00 | 32,31 | 22,16 | 0,4562 | 0,0808 | |||
| NVT / nVent Electric plc | 0,43 | 0,00 | 31,61 | 39,73 | 0,4462 | 0,1252 | |||
| PTC / PTC Inc. | 0,18 | 0,00 | 31,42 | 11,22 | 0,4436 | 0,0427 | |||
| ABT / Abbott Laboratories | 0,23 | 0,00 | 31,40 | 2,53 | 0,4434 | 0,0087 | |||
| CHD / Church & Dwight Co., Inc. | 0,33 | -8,02 | 31,40 | -19,70 | 0,4433 | -0,1117 | |||
| LOW / Lowe's Companies, Inc. | 0,14 | 12,34 | 30,50 | 6,87 | 0,4306 | 0,0255 | |||
| KMB / Kimberly-Clark Corporation | 0,23 | -8,34 | 29,19 | -16,91 | 0,4121 | -0,0865 | |||
| BSX / Boston Scientific Corporation | 0,27 | -2,53 | 28,95 | 3,78 | 0,4087 | 0,0128 | |||
| CMCSA / Comcast Corporation | 0,79 | 1,16 | 28,28 | -2,16 | 0,3993 | -0,0109 | |||
| PFE / Pfizer Inc. | 1,15 | 1 177,53 | 27,84 | 1 122,08 | 0,3930 | 0,3607 | |||
| QCOM / QUALCOMM Incorporated | 0,17 | 279,91 | 26,80 | 293,93 | 0,3784 | 0,2818 | |||
| ELV / Elevance Health, Inc. | 0,07 | 1,06 | 25,84 | -9,63 | 0,3648 | -0,0410 | |||
| BILL / BILL Holdings, Inc. | 0,55 | 0,00 | 25,44 | 0,80 | 0,3592 | 0,0010 | |||
| CRC / California Resources Corporation | 0,55 | 15,38 | 24,91 | 19,84 | 0,3517 | 0,0567 | |||
| TWLO / Twilio Inc. | 0,20 | 0,00 | 24,84 | 27,02 | 0,3507 | 0,0731 | |||
| AMGN / Amgen Inc. | 0,09 | 28,24 | 24,60 | 14,93 | 0,3473 | 0,0435 | |||
| MCD / McDonald's Corporation | 0,08 | 131,04 | 24,57 | 116,10 | 0,3469 | 0,1855 | |||
| OWL / Blue Owl Capital Inc. | 1,27 | 0,00 | 24,38 | -4,14 | 0,3441 | -0,0168 | |||
| XYZ / Block, Inc. | 0,35 | 0,00 | 24,06 | 25,03 | 0,3396 | 0,0666 | |||
| JPM / JPMorgan Chase & Co. | 0,08 | -45,18 | 23,53 | -35,21 | 0,3322 | -0,1833 | |||
| OKTA / Okta, Inc. | 0,23 | 0,00 | 22,52 | -4,99 | 0,3180 | -0,0185 | |||
| MMC / Marsh & McLennan Companies, Inc. | 0,10 | 13,22 | 22,48 | 1,44 | 0,3173 | 0,0028 | |||
| INTU / Intuit Inc. | 0,03 | 24,23 | 22,21 | 59,37 | 0,3136 | 0,1158 | |||
| EL / The Estée Lauder Companies Inc. | 0,27 | 0,00 | 21,94 | 22,42 | 0,3097 | 0,0554 | |||
| ARGX / argenx SE - Depositary Receipt (Common Stock) | 0,04 | 0,00 | 21,77 | -6,87 | 0,3074 | -0,0244 | |||
| LULU / lululemon athletica inc. | 0,09 | 0,00 | 21,33 | -16,07 | 0,3012 | -0,0596 | |||
| ITW / Illinois Tool Works Inc. | 0,09 | -6,54 | 21,20 | -6,83 | 0,2994 | -0,0236 | |||
| UTHR / United Therapeutics Corporation | 0,07 | 0,00 | 20,29 | -6,79 | 0,2864 | -0,0225 | |||
| SNA / Snap-on Incorporated | 0,07 | -14,12 | 20,26 | -20,70 | 0,2860 | -0,0765 | |||
| ROP / Roper Technologies, Inc. | 0,03 | 6,75 | 19,73 | 2,63 | 0,2785 | 0,0057 | |||
| CI / The Cigna Group | 0,06 | 19,57 | 0,2763 | 0,2763 | |||||
| RYAN / Ryan Specialty Holdings, Inc. | 0,28 | 52,61 | 19,05 | 40,47 | 0,2690 | 0,0765 | |||
| GEN / Gen Digital Inc. | 0,64 | -5,06 | 18,88 | 5,17 | 0,2665 | 0,0118 | |||
| CGNX / Cognex Corporation | 0,58 | 0,00 | 18,45 | 6,33 | 0,2604 | 0,0142 | |||
| RDDT / Reddit, Inc. | 0,12 | 99,51 | 18,23 | 186,38 | 0,2574 | 0,1671 | |||
| UHS / Universal Health Services, Inc. | 0,10 | -0,82 | 17,52 | -4,38 | 0,2473 | -0,0127 | |||
| ETN / Eaton Corporation plc | 0,05 | -38,36 | 17,49 | -19,06 | 0,2470 | -0,0597 | |||
| PGR / The Progressive Corporation | 0,07 | -12,80 | 17,45 | -17,78 | 0,2464 | -0,0548 | |||
| TT / Trane Technologies plc | 0,04 | -5,74 | 17,23 | 22,37 | 0,2433 | 0,0434 | |||
| VIK / Viking Holdings Ltd | 0,32 | 17,02 | 0,2403 | 0,2403 | |||||
| ACI / Albertsons Companies, Inc. | 0,77 | 7,47 | 16,52 | 5,12 | 0,2332 | 0,0102 | |||
| JBL / Jabil Inc. | 0,07 | 16,36 | 0,2309 | 0,2309 | |||||
| EXPE / Expedia Group, Inc. | 0,10 | 652,34 | 16,24 | 655,14 | 0,2293 | 0,1988 | |||
| ABNB / Airbnb, Inc. | 0,12 | 0,00 | 16,16 | 10,78 | 0,2281 | 0,0211 | |||
| PAYX / Paychex, Inc. | 0,11 | -8,64 | 15,54 | -13,86 | 0,2194 | -0,0366 | |||
| VRSK / Verisk Analytics, Inc. | 0,05 | 11,99 | 15,42 | 17,22 | 0,2177 | 0,0310 | |||
| KO / The Coca-Cola Company | 0,22 | 0,00 | 15,41 | -1,21 | 0,2175 | -0,0038 | |||
| SYK / Stryker Corporation | 0,04 | -4,69 | 15,27 | 1,29 | 0,2156 | 0,0016 | |||
| TENB / Tenable Holdings, Inc. | 0,45 | 0,00 | 15,19 | -3,43 | 0,2145 | -0,0088 | |||
| GLOB / Globant S.A. | 0,16 | 0,00 | 14,76 | -22,83 | 0,2084 | -0,0631 | |||
| CF / CF Industries Holdings, Inc. | 0,16 | 14,73 | 0,2079 | 0,2079 | |||||
| PHM / PulteGroup, Inc. | 0,14 | 2,38 | 14,53 | 5,03 | 0,2051 | 0,0088 | |||
| PEP / PepsiCo, Inc. | 0,11 | 0,00 | 14,49 | -11,94 | 0,2045 | -0,0290 | |||
| CW / Curtiss-Wright Corporation | 0,03 | 14,02 | 0,1980 | 0,1980 | |||||
| YUM / Yum! Brands, Inc. | 0,09 | 69,23 | 14,02 | 59,36 | 0,1979 | 0,0731 | |||
| PH / Parker-Hannifin Corporation | 0,02 | -6,10 | 13,97 | 7,89 | 0,1972 | 0,0135 | |||
| TDG / TransDigm Group Incorporated | 0,01 | -1,09 | 13,84 | 8,73 | 0,1954 | 0,0147 | |||
| AJG / Arthur J. Gallagher & Co. | 0,04 | 3,87 | 13,73 | -3,68 | 0,1939 | -0,0085 | |||
| DVA / DaVita Inc. | 0,09 | 6,41 | 13,47 | -0,90 | 0,1902 | -0,0027 | |||
| GIS / General Mills, Inc. | 0,25 | 0,00 | 13,17 | -13,35 | 0,1860 | -0,0298 | |||
| APH / Amphenol Corporation | 0,13 | -2,69 | 12,85 | 46,50 | 0,1814 | 0,0569 | |||
| ETSY / Etsy, Inc. | 0,25 | 0,00 | 12,60 | 6,31 | 0,1779 | 0,0097 | |||
| TAP.A / Molson Coors Beverage Company | 0,26 | 0,00 | 12,52 | -21,00 | 0,1767 | -0,0481 | |||
| UNH / UnitedHealth Group Incorporated | 0,04 | 0,00 | 12,15 | -40,44 | 0,1716 | -0,1180 | |||
| EME / EMCOR Group, Inc. | 0,02 | -10,59 | 11,75 | 29,39 | 0,1658 | 0,0370 | |||
| TECH / Bio-Techne Corporation | 0,23 | 0,00 | 11,66 | -12,25 | 0,1647 | -0,0240 | |||
| LIN / Linde plc | 0,02 | -57,24 | 11,35 | -56,92 | 0,1603 | -0,2137 | |||
| EA / Electronic Arts Inc. | 0,07 | 0,00 | 11,34 | 10,50 | 0,1601 | 0,0145 | |||
| TRMB / Trimble Inc. | 0,14 | 10,74 | 0,1516 | 0,1516 | |||||
| VRSN / VeriSign, Inc. | 0,04 | -13,19 | 10,45 | -1,25 | 0,1476 | -0,0026 | |||
| HOLX / Hologic, Inc. | 0,16 | 0,00 | 10,24 | 5,49 | 0,1446 | 0,0068 | |||
| COR / Cencora, Inc. | 0,03 | 10,04 | 0,1418 | 0,1418 | |||||
| ADSK / Autodesk, Inc. | 0,03 | -1,28 | 9,56 | 16,74 | 0,1350 | 0,0187 | |||
| HLT / Hilton Worldwide Holdings Inc. | 0,03 | -5,11 | 8,90 | 11,06 | 0,1256 | 0,0119 | |||
| EXPD / Expeditors International of Washington, Inc. | 0,08 | 0,00 | 8,66 | -4,98 | 0,1223 | -0,0071 | |||
| NVR / NVR, Inc. | 0,00 | 0,00 | 8,38 | 1,95 | 0,1182 | 0,0017 | |||
| PKG / Packaging Corporation of America | 0,04 | -22,81 | 8,29 | -26,54 | 0,1171 | -0,0431 | |||
| WCN / Waste Connections, Inc. | 0,04 | 17,04 | 7,82 | 11,97 | 0,1105 | 0,0113 | |||
| RPM / RPM International Inc. | 0,07 | -6,15 | 7,71 | -10,89 | 0,1089 | -0,0139 | |||
| WSM / Williams-Sonoma, Inc. | 0,05 | -10,52 | 7,37 | -7,54 | 0,1040 | -0,0091 | |||
| MAS / Masco Corporation | 0,11 | -8,09 | 7,31 | -14,93 | 0,1033 | -0,0188 | |||
| HSY / The Hershey Company | 0,04 | 0,00 | 7,23 | -2,97 | 0,1020 | -0,0037 | |||
| SO / The Southern Company | 0,08 | 0,00 | 7,00 | -0,13 | 0,0988 | -0,0007 | |||
| L / Loews Corporation | 0,08 | 0,00 | 6,92 | -0,27 | 0,0977 | -0,0008 | |||
| MCO / Moody's Corporation | 0,01 | 0,00 | 6,67 | 7,72 | 0,0942 | 0,0063 | |||
| AME / AMETEK, Inc. | 0,04 | 0,00 | 6,49 | 5,12 | 0,0916 | 0,0040 | |||
| BK / The Bank of New York Mellon Corporation | 0,07 | -5,13 | 6,41 | 3,07 | 0,0904 | 0,0022 | |||
| FFIV / F5, Inc. | 0,02 | -14,09 | 6,10 | -5,04 | 0,0861 | -0,0051 | |||
| ADBE / Adobe Inc. | 0,02 | -18,09 | 5,96 | -17,38 | 0,0841 | -0,0182 | |||
| CB / Chubb Limited | 0,02 | -59,32 | 5,56 | -60,98 | 0,0785 | -0,1238 | |||
| IEX / IDEX Corporation | 0,03 | 0,00 | 5,40 | -2,98 | 0,0762 | -0,0028 | |||
| FNF / Fidelity National Financial, Inc. | 0,10 | -15,94 | 5,38 | -27,60 | 0,0760 | -0,0295 | |||
| NRG / NRG Energy, Inc. | 0,03 | 0,00 | 5,11 | 68,24 | 0,0721 | 0,0290 | |||
| JKHY / Jack Henry & Associates, Inc. | 0,03 | 0,00 | 5,01 | -1,34 | 0,0707 | -0,0013 | |||
| CBRE / CBRE Group, Inc. | 0,04 | -63,79 | 4,93 | -61,20 | 0,0696 | -0,1108 | |||
| KHC / The Kraft Heinz Company | 0,19 | 0,00 | 4,91 | -15,15 | 0,0693 | -0,0128 | |||
| T / AT&T Inc. | 0,17 | 0,00 | 4,86 | 2,34 | 0,0687 | 0,0012 | |||
| BALL / Ball Corporation | 0,09 | -74,96 | 4,86 | -73,03 | 0,0686 | -0,1870 | |||
| TRV / The Travelers Companies, Inc. | 0,02 | 0,00 | 4,82 | 1,16 | 0,0680 | 0,0004 | |||
| GRMN / Garmin Ltd. | 0,02 | 0,00 | 4,53 | -3,86 | 0,0639 | -0,0029 | |||
| CAH / Cardinal Health, Inc. | 0,03 | 4,30 | 0,0607 | 0,0607 | |||||
| AFL / Aflac Incorporated | 0,04 | -59,63 | 4,20 | -61,72 | 0,0593 | -0,0963 | |||
| LII / Lennox International Inc. | 0,01 | 0,00 | 4,15 | 2,19 | 0,0585 | 0,0010 | |||
| MDT / Medtronic plc | 0,05 | 0,00 | 3,94 | -2,98 | 0,0556 | -0,0020 | |||
| RJF / Raymond James Financial, Inc. | 0,03 | 0,00 | 3,85 | 10,41 | 0,0543 | 0,0049 | |||
| GDDY / GoDaddy Inc. | 0,02 | -18,11 | 3,75 | -18,14 | 0,0529 | -0,0121 | |||
| TMUS / T-Mobile US, Inc. | 0,01 | 0,00 | 3,22 | -10,67 | 0,0454 | -0,0057 | |||
| CRM / Salesforce, Inc. | 0,01 | 0,00 | 3,19 | 1,62 | 0,0450 | 0,0005 | |||
| CMI / Cummins Inc. | 0,01 | 0,00 | 2,91 | 4,48 | 0,0411 | 0,0016 | |||
| WRB / W. R. Berkley Corporation | 0,04 | 70,59 | 2,88 | 76,12 | 0,0406 | 0,0174 | |||
| ECL / Ecolab Inc. | 0,01 | 0,00 | 2,86 | 6,29 | 0,0403 | 0,0022 | |||
| HIG / The Hartford Insurance Group, Inc. | 0,02 | -32,52 | 2,82 | -30,81 | 0,0398 | -0,0180 | |||
| DECK / Deckers Outdoor Corporation | 0,02 | -60,87 | 2,32 | -63,93 | 0,0327 | -0,0585 | |||
| BR / Broadridge Financial Solutions, Inc. | 0,01 | 39,06 | 2,16 | 39,39 | 0,0305 | 0,0085 | |||
| KDP / Keurig Dr Pepper Inc. | 0,06 | 0,00 | 1,91 | -3,39 | 0,0269 | -0,0011 | |||
| KEYS / Keysight Technologies, Inc. | 0,01 | 0,00 | 1,57 | 9,46 | 0,0222 | 0,0018 | |||
| SYF / Synchrony Financial | 0,02 | 0,00 | 1,49 | 26,08 | 0,0211 | 0,0043 | |||
| CCEP N / Coca-Cola Europacific Partners PLC | 0,02 | 1,42 | 0,0200 | 0,0200 | |||||
| CPRT / Copart, Inc. | 0,03 | 0,00 | 1,38 | -13,33 | 0,0195 | -0,0031 | |||
| DGX / Quest Diagnostics Incorporated | 0,01 | 0,00 | 1,28 | 6,16 | 0,0180 | 0,0010 | |||
| SOLV / Solventum Corporation | 0,02 | -95,95 | 1,23 | -95,96 | 0,0174 | -0,4142 | |||
| ROST / Ross Stores, Inc. | 0,01 | -37,06 | 1,15 | -37,16 | 0,0162 | -0,0097 | |||
| FERG / Ferguson Enterprises Inc. | 0,01 | 0,00 | 1,11 | 35,86 | 0,0157 | 0,0041 | |||
| DPZ / Domino's Pizza, Inc. | 0,00 | 0,00 | 1,08 | -1,91 | 0,0153 | -0,0004 | |||
| MTD / Mettler-Toledo International Inc. | 0,00 | 0,00 | 1,06 | -0,47 | 0,0149 | -0,0002 | |||
| FE / FirstEnergy Corp. | 0,03 | 0,00 | 1,03 | -0,39 | 0,0145 | -0,0001 | |||
| DOCU / DocuSign, Inc. | 0,01 | 0,00 | 1,02 | -4,32 | 0,0144 | -0,0007 | |||
| MANH / Manhattan Associates, Inc. | 0,00 | 0,00 | 0,95 | 14,23 | 0,0134 | 0,0016 | |||
| KVUE / Kenvue Inc. | 0,04 | 0,00 | 0,84 | -12,70 | 0,0118 | -0,0018 | |||
| FTV / Fortive Corporation | 0,01 | 0,00 | 0,64 | -28,81 | 0,0090 | -0,0037 | |||
| RMD / ResMed Inc. | 0,00 | 0,00 | 0,62 | 15,24 | 0,0088 | 0,0011 | |||
| AOS / A. O. Smith Corporation | 0,01 | 0,00 | 0,54 | 0,37 | 0,0076 | -0,0000 | |||
| CAG / Conagra Brands, Inc. | 0,02 | 0,00 | 0,44 | -23,18 | 0,0063 | -0,0019 | |||
| CLX / The Clorox Company | 0,00 | 0,00 | 0,42 | -18,47 | 0,0059 | -0,0014 | |||
| BLDR / Builders FirstSource, Inc. | 0,00 | -100,00 | 0,00 | 0,0000 | |||||
| RS / Reliance, Inc. | 0,00 | -100,00 | 0,00 | 0,0000 | |||||
| HUBB / Hubbell Incorporated | 0,00 | -100,00 | 0,00 | 0,0000 | |||||
| LEN / Lennar Corporation | 0,00 | -100,00 | 0,00 | 0,0000 | |||||
| AMP / Ameriprise Financial, Inc. | 0,00 | -100,00 | 0,00 | 0,0000 | |||||
| BLK / BlackRock, Inc. | 0,00 | -100,00 | 0,00 | 0,0000 | |||||
| MOH / Molina Healthcare, Inc. | 0,00 | -100,00 | 0,00 | 0,0000 | |||||
| MRP / Millrose Properties, Inc. | 0,00 | -100,00 | 0,00 | 0,0000 | |||||
| BAH / Booz Allen Hamilton Holding Corporation | 0,00 | -100,00 | 0,00 | 0,0000 | |||||
| SEIC / SEI Investments Company | 0,00 | -100,00 | 0,00 | 0,0000 | |||||
| HPE / Hewlett Packard Enterprise Company | 0,00 | -100,00 | 0,00 | 0,0000 |