Statistiques de base
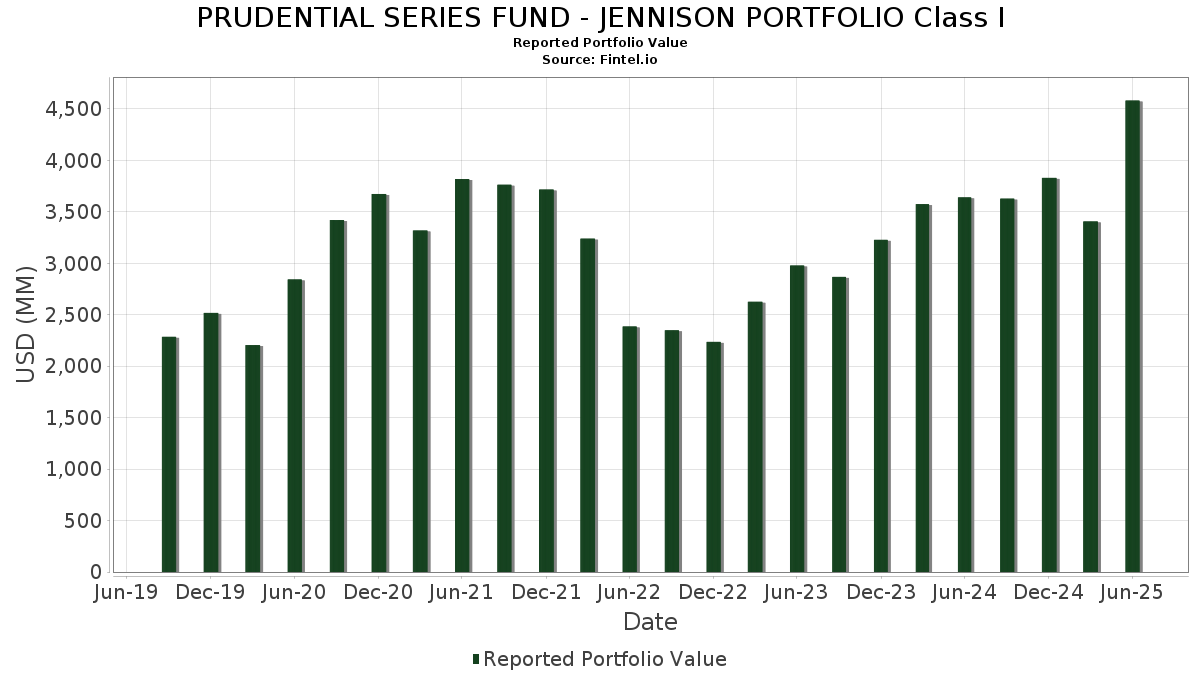
| Valeur du portefeuille | $ 4 581 027 980 |
| Positions actuelles | 58 |
Dernières positions, performances, ASG (à partir des dépôts 13F, 13D)
PRUDENTIAL SERIES FUND - JENNISON PORTFOLIO Class I a déclaré un total de 58 positions dans ses derniers dépôts auprès de la SEC. La valeur la plus récente du portefeuille est calculée à 4 581 027 980 USD. Les actifs sous gestion réels (ASG) sont cette valeur plus les liquidités (qui ne sont pas divulguées). Les principales positions de PRUDENTIAL SERIES FUND - JENNISON PORTFOLIO Class I sont NVIDIA Corporation (US:NVDA) , Amazon.com, Inc. (US:AMZN) , Microsoft Corporation (US:MSFT) , Meta Platforms, Inc. (US:META) , and Netflix, Inc. (US:NFLX) .
Meilleures augmentations ce trimestre
Nous utilisons la variation de l'allocation du portefeuille car il s'agit de l'indicateur le plus significatif. Les changements peuvent être dus à des transactions ou à des variations de prix des actions.
| Titre | Actions (en millions) |
Valeur ($ en millions) |
% du portefeuille | ΔPortefeuille % |
|---|---|---|---|---|
| 54,31 | 54,31 | 1,2022 | 1,2022 | |
| 2,70 | 426,82 | 9,4482 | 1,1512 | |
| 45,69 | 45,65 | 1,0106 | 1,0106 | |
| 0,21 | 66,54 | 1,4729 | 0,8066 | |
| 0,80 | 220,29 | 4,8763 | 0,7090 | |
| 0,29 | 65,19 | 1,4431 | 0,5066 | |
| 0,22 | 45,06 | 0,9975 | 0,4972 | |
| 0,48 | 100,49 | 2,2245 | 0,4792 | |
| 0,58 | 287,52 | 6,3646 | 0,4140 | |
| 0,17 | 227,72 | 5,0408 | 0,3627 |
Principales baisses ce trimestre
Nous utilisons la variation de l'allocation du portefeuille car il s'agit de l'indicateur le plus significatif. Les changements peuvent être dus à des transactions ou à des variations de prix des actions.
| Titre | Actions (en millions) |
Valeur ($ en millions) |
% du portefeuille | ΔPortefeuille % |
|---|---|---|---|---|
| 0,93 | 191,54 | 4,2400 | -1,4739 | |
| 0,20 | 23,21 | 0,5138 | -1,2336 | |
| 1,52 | 333,65 | 7,3858 | -0,9384 | |
| 0,07 | 17,96 | 0,3977 | -0,7223 | |
| 0,59 | 55,18 | 1,2216 | -0,6114 | |
| 0,16 | 21,11 | 0,4674 | -0,5528 | |
| 0,17 | 132,55 | 2,9342 | -0,4924 | |
| 0,41 | 73,36 | 1,6238 | -0,3663 | |
| 0,18 | 16,73 | 0,3702 | -0,3644 | |
| 0,42 | 73,39 | 1,6245 | -0,3563 |
Déclarations 13F et dépôts de fonds
Ce formulaire a été déposé le 2025-08-27 pour la période de déclaration 2025-06-30. Cliquez sur l'icône du lien pour voir l'historique complet des transactions.
Mettre à niveau pour débloquer les données premium et exporter vers Excel ![]() .
.
| Titre | Type | Prix moyen de l'action | Actions (en millions) |
ΔActions (%) |
ΔActions (%) |
Valeur ($ en millions) |
Portefeuille (%) |
ΔPortefeuille (%) |
|
|---|---|---|---|---|---|---|---|---|---|
| NVDA / NVIDIA Corporation | 2,70 | 4,86 | 426,82 | 52,87 | 9,4482 | 1,1512 | |||
| AMZN / Amazon.com, Inc. | 1,52 | 3,29 | 333,65 | 19,11 | 7,3858 | -0,9384 | |||
| MSFT / Microsoft Corporation | 0,58 | 8,36 | 287,52 | 43,58 | 6,3646 | 0,4140 | |||
| META / Meta Platforms, Inc. | 0,36 | 3,84 | 264,83 | 32,97 | 5,8624 | -0,0559 | |||
| NFLX / Netflix, Inc. | 0,17 | 0,73 | 227,72 | 44,65 | 5,0408 | 0,3627 | |||
| AVGO / Broadcom Inc. | 0,80 | -4,59 | 220,29 | 57,08 | 4,8763 | 0,7090 | |||
| AAPL / Apple Inc. | 0,93 | 7,85 | 191,54 | -0,39 | 4,2400 | -1,4739 | |||
| LLY / Eli Lilly and Company | 0,17 | 21,79 | 132,55 | 14,95 | 2,9342 | -0,4924 | |||
| MA / Mastercard Incorporated | 0,23 | 17,59 | 131,00 | 20,55 | 2,8999 | -0,3293 | |||
| BA / The Boeing Company | 0,48 | 39,27 | 100,49 | 71,10 | 2,2245 | 0,4792 | |||
| TSLA / Tesla, Inc. | 0,30 | 1,03 | 95,05 | 23,84 | 2,1041 | -0,1767 | |||
| VRTX / Vertex Pharmaceuticals Incorporated | 0,21 | 64,63 | 94,75 | 51,18 | 2,0974 | 0,2350 | |||
| COST / Costco Wholesale Corporation | 0,10 | 17,47 | 94,46 | 22,96 | 2,0909 | -0,1919 | |||
| DIS / The Walt Disney Company | 0,74 | 27,79 | 91,22 | 60,57 | 2,0192 | 0,3310 | |||
| V / Visa Inc. | 0,26 | 17,53 | 90,58 | 19,07 | 2,0050 | -0,2555 | |||
| WMT / Walmart Inc. | 0,90 | 17,55 | 87,98 | 30,93 | 1,9476 | -0,0493 | |||
| CRWD / CrowdStrike Holdings, Inc. | 0,16 | 9,16 | 81,55 | 57,68 | 1,8051 | 0,2683 | |||
| CDNS / Cadence Design Systems, Inc. | 0,26 | 15,49 | 80,80 | 39,93 | 1,7886 | 0,0728 | |||
| GOOGL / Alphabet Inc. | 0,42 | -3,39 | 73,39 | 10,09 | 1,6245 | -0,3563 | |||
| GOOG / Alphabet Inc. | 0,41 | -3,53 | 73,36 | 9,53 | 1,6238 | -0,3663 | |||
| NOW / ServiceNow, Inc. | 0,07 | 10,71 | 68,69 | 42,97 | 1,5206 | 0,0928 | |||
| CEG / Constellation Energy Corporation | 0,21 | 85,36 | 66,54 | 196,72 | 1,4729 | 0,8066 | |||
| TSM / Taiwan Semiconductor Manufacturing Company Limited - Depositary Receipt (Common Stock) | 0,29 | 51,61 | 65,19 | 106,86 | 1,4431 | 0,5066 | |||
| SPOT / Spotify Technology S.A. | 0,08 | 16,98 | 60,06 | 63,19 | 1,3295 | 0,2359 | |||
| GE / General Electric Company | 0,23 | 6,06 | 60,02 | 36,39 | 1,3286 | 0,0209 | |||
| MELI / MercadoLibre, Inc. | 0,02 | 17,43 | 55,77 | 57,33 | 1,2345 | 0,1811 | |||
| UBER / Uber Technologies, Inc. | 0,59 | -30,14 | 55,18 | -10,54 | 1,2216 | -0,6114 | |||
| HLT / Hilton Worldwide Holdings Inc. | 0,20 | 3,09 | 54,43 | 20,66 | 1,2050 | -0,1356 | |||
| (PIPA070) PGIM Core Government Money Market Fund / STIV (000000000) | 54,31 | 54,31 | 1,2022 | 1,2022 | |||||
| ORLY / O'Reilly Automotive, Inc. | 0,55 | 1 671,25 | 50,01 | 11,44 | 1,1071 | -0,2265 | |||
| ISRG / Intuitive Surgical, Inc. | 0,09 | 39,52 | 49,34 | 53,08 | 1,0921 | 0,1344 | |||
| NVO / Novo Nordisk A/S - Depositary Receipt (Common Stock) | 0,70 | 17,52 | 48,01 | 16,81 | 1,0628 | -0,1586 | |||
| SNOW / Snowflake Inc. | 0,21 | 11,79 | 47,72 | 71,16 | 1,0564 | 0,2278 | |||
| PGIM Institutional Money Market Fund - D / STIV (000000000) | 45,69 | 45,65 | 1,0106 | 1,0106 | |||||
| TXN / Texas Instruments Incorporated | 0,22 | 131,67 | 45,06 | 167,67 | 0,9975 | 0,4972 | |||
| PGR / The Progressive Corporation | 0,15 | 17,24 | 39,67 | 10,55 | 0,8782 | -0,1882 | |||
| EW / Edwards Lifesciences Corporation | 0,51 | 37,37 | 39,59 | 48,23 | 0,8764 | 0,0827 | |||
| DXCM / DexCom, Inc. | 0,43 | 20,55 | 37,73 | 54,09 | 0,8352 | 0,1076 | |||
| TJX / The TJX Companies, Inc. | 0,29 | 82,02 | 35,66 | 84,55 | 0,7893 | 0,2151 | |||
| TTD / The Trade Desk, Inc. | 0,49 | 41,77 | 35,36 | 86,52 | 0,7827 | 0,2194 | |||
| ADS / adidas AG | 0,15 | 18,26 | 33,90 | 17,04 | 0,7504 | -0,1103 | |||
| NKE / NIKE, Inc. | 0,44 | 44,05 | 31,10 | 61,20 | 0,6885 | 0,1152 | |||
| MCO / Moody's Corporation | 0,06 | -3,87 | 28,96 | 3,54 | 0,6412 | -0,1901 | |||
| DDOG / Datadog, Inc. | 0,20 | 17,38 | 26,29 | 58,93 | 0,5820 | 0,0904 | |||
| AXON / Axon Enterprise, Inc. | 0,03 | 17,23 | 25,95 | 84,55 | 0,5744 | 0,1566 | |||
| GS / The Goldman Sachs Group, Inc. | 0,04 | 17,49 | 25,89 | 52,21 | 0,5731 | 0,0677 | |||
| APP / AppLovin Corporation | 0,07 | 16,42 | 23,30 | 53,81 | 0,5157 | 0,0656 | |||
| SHOP / Shopify Inc. | 0,20 | 152,02 | 23,21 | -57,00 | 0,5138 | -1,2336 | |||
| IDEXY / Industria de Diseño Textil, S.A. - Depositary Receipt (Common Stock) | 0,43 | 37,55 | 22,46 | 44,12 | 0,4972 | 0,0341 | |||
| ABNB / Airbnb, Inc. | 0,16 | -44,48 | 21,11 | -38,50 | 0,4674 | -0,5528 | |||
| LPLA / LPL Financial Holdings Inc. | 0,06 | 78,92 | 20,91 | 105,09 | 0,4628 | 0,1599 | |||
| AZN / AstraZeneca PLC - Depositary Receipt (Common Stock) | 0,27 | -22,11 | 19,14 | -16,93 | 0,4236 | -0,1813 | |||
| HUBS / HubSpot, Inc. | 0,03 | 12,93 | 19,00 | 6,58 | 0,4205 | -0,0703 | |||
| CRM / Salesforce, Inc. | 0,07 | -53,09 | 17,96 | -52,34 | 0,3977 | -0,7223 | |||
| SBUX / Starbucks Corporation | 0,18 | -27,58 | 16,73 | -32,35 | 0,3702 | -0,3644 | |||
| KKR / KKR & Co. Inc. | 0,11 | -31,67 | 14,04 | -21,38 | 0,3109 | -0,2199 | |||
| CAVA / CAVA Group, Inc. | 0,12 | -18,06 | 9,91 | -20,13 | 0,2194 | -0,1494 | |||
| BSX / Boston Scientific Corporation | 0,07 | 7,62 | 0,1687 | 0,1687 |