Statistiques de base
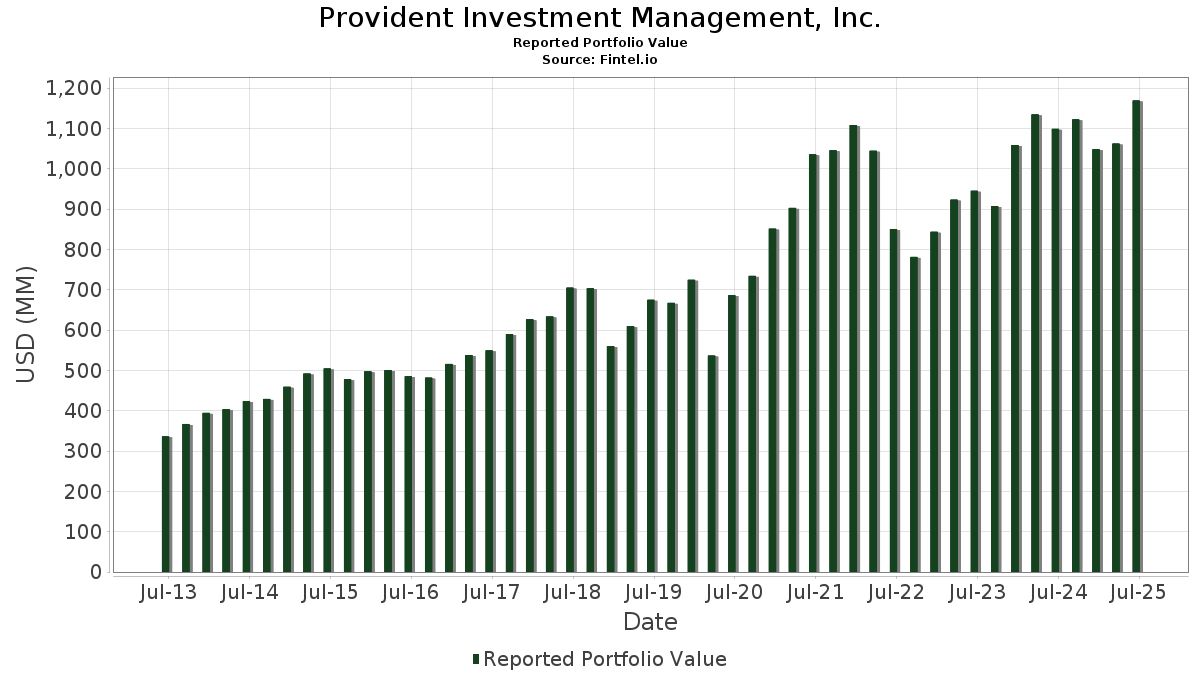
| Valeur du portefeuille | $ 1 168 884 219 |
| Positions actuelles | 75 |
Dernières positions, performances, ASG (à partir des dépôts 13F, 13D)
Provident Investment Management, Inc. a déclaré un total de 75 positions dans ses derniers dépôts auprès de la SEC. La valeur la plus récente du portefeuille est calculée à 1 168 884 219 USD. Les actifs sous gestion réels (ASG) sont cette valeur plus les liquidités (qui ne sont pas divulguées). Les principales positions de Provident Investment Management, Inc. sont Visa Inc. (US:V) , Microsoft Corporation (US:MSFT) , Booking Holdings Inc. (US:BKNG) , Vertex Pharmaceuticals Incorporated (US:VRTX) , and Corpay, Inc. (US:CPAY) . Les nouvelles positions de Provident Investment Management, Inc. incluent BlackRock, Inc. (US:BLK) , Trane Technologies plc (US:TT) , Starbucks Corporation (US:SBUX) , ONEOK, Inc. (US:OKE) , and Phillips Edison & Company, Inc. (US:PECO) .
Meilleures augmentations ce trimestre
Nous utilisons la variation de l'allocation du portefeuille car il s'agit de l'indicateur le plus significatif. Les changements peuvent être dus à des transactions ou à des variations de prix des actions.
| Titre | Actions (en millions) |
Valeur ($ en millions) |
% du portefeuille | ΔPortefeuille % |
|---|---|---|---|---|
| 0,06 | 59,93 | 5,1272 | 5,1272 | |
| 0,28 | 38,68 | 3,3090 | 3,1101 | |
| 0,06 | 28,20 | 2,4125 | 2,4125 | |
| 0,07 | 50,62 | 4,3306 | 2,0768 | |
| 0,17 | 83,70 | 7,1605 | 1,2117 | |
| 0,10 | 46,23 | 3,9546 | 0,9586 | |
| 0,01 | 74,81 | 6,4001 | 0,7094 | |
| 0,36 | 33,54 | 2,8693 | 0,5763 | |
| 0,23 | 49,83 | 4,2629 | 0,5397 | |
| 0,16 | 30,73 | 2,6291 | 0,3400 |
Principales baisses ce trimestre
Nous utilisons la variation de l'allocation du portefeuille car il s'agit de l'indicateur le plus significatif. Les changements peuvent être dus à des transactions ou à des variations de prix des actions.
| Titre | Actions (en millions) |
Valeur ($ en millions) |
% du portefeuille | ΔPortefeuille % |
|---|---|---|---|---|
| 0,00 | 0,93 | 0,0799 | -4,2370 | |
| 0,89 | 37,24 | 3,1862 | -2,9081 | |
| 0,00 | 0,37 | 0,0315 | -2,4532 | |
| 0,25 | 43,96 | 3,7609 | -2,1667 | |
| 1,29 | 63,15 | 5,4027 | -1,5332 | |
| 0,16 | 70,66 | 6,0448 | -1,0913 | |
| 0,21 | 69,10 | 5,9120 | -0,9826 | |
| 0,26 | 93,80 | 8,0246 | -0,7720 | |
| 0,38 | 34,58 | 2,9586 | -0,5277 | |
| 0,31 | 56,75 | 4,8548 | -0,2145 |
Déclarations 13F et dépôts de fonds
Ce formulaire a été déposé le 2025-08-26 pour la période de déclaration 2025-06-30. Cliquez sur l'icône du lien pour voir l'historique complet des transactions.
Mettre à niveau pour débloquer les données premium et exporter vers Excel ![]() .
.
| Titre | Type | Prix moyen de l'action | Actions (en millions) |
ΔActions (%) |
ΔActions (%) |
Valeur ($ en millions) |
Portefeuille (%) |
ΔPortefeuille (%) |
|
|---|---|---|---|---|---|---|---|---|---|
| V / Visa Inc. | 0,26 | -0,90 | 93,80 | 0,40 | 8,0246 | -0,7720 | |||
| MSFT / Microsoft Corporation | 0,17 | -0,02 | 83,70 | 32,48 | 7,1605 | 1,2117 | |||
| BKNG / Booking Holdings Inc. | 0,01 | -1,50 | 74,81 | 23,78 | 6,4001 | 0,7094 | |||
| VRTX / Vertex Pharmaceuticals Incorporated | 0,16 | 1,52 | 70,66 | -6,77 | 6,0448 | -1,0913 | |||
| CPAY / Corpay, Inc. | 0,21 | -0,82 | 69,10 | -5,63 | 5,9120 | -0,9826 | |||
| CPRT / Copart, Inc. | 1,29 | -1,13 | 63,15 | -14,27 | 5,4027 | -1,5332 | |||
| BLK / BlackRock, Inc. | 0,06 | 59,93 | 5,1272 | 5,1272 | |||||
| ICE / Intercontinental Exchange, Inc. | 0,31 | -0,90 | 56,75 | 5,40 | 4,8548 | -0,2145 | |||
| SCHW / The Charles Schwab Corporation | 0,62 | -0,44 | 56,65 | 16,04 | 4,8462 | 0,2499 | |||
| META / Meta Platforms, Inc. | 0,07 | 65,14 | 50,62 | 111,49 | 4,3306 | 2,0768 | |||
| AMZN / Amazon.com, Inc. | 0,23 | 9,28 | 49,83 | 26,01 | 4,2629 | 0,5397 | |||
| FI / Fiserv, Inc. | 0,28 | 35,37 | 48,98 | 5,69 | 4,1906 | -0,1732 | |||
| CACI / CACI International Inc | 0,10 | 11,82 | 46,23 | 45,27 | 3,9546 | 0,9586 | |||
| GOOG / Alphabet Inc. | 0,25 | -38,50 | 43,96 | -30,17 | 3,7609 | -2,1667 | |||
| TTWO / Take-Two Interactive Software, Inc. | 0,18 | 0,15 | 42,59 | 17,35 | 3,6436 | 0,2265 | |||
| ABT / Abbott Laboratories | 0,28 | 1 686,29 | 38,68 | 1 732,21 | 3,3090 | 3,1101 | |||
| FAST / Fastenal Company | 0,89 | 6,24 | 37,24 | -42,46 | 3,1862 | -2,9081 | |||
| ORLY / O'Reilly Automotive, Inc. | 0,38 | 1 384,56 | 34,58 | -6,60 | 2,9586 | -0,5277 | |||
| UBER / Uber Technologies, Inc. | 0,36 | 7,55 | 33,54 | 37,72 | 2,8693 | 0,5763 | |||
| ALGN / Align Technology, Inc. | 0,16 | 6,06 | 30,73 | 26,40 | 2,6291 | 0,3400 | |||
| TT / Trane Technologies plc | 0,06 | 28,20 | 2,4125 | 2,4125 | |||||
| SPGI / S&P Global Inc. | 0,01 | -4,22 | 5,75 | -0,59 | 0,4920 | -0,0527 | |||
| MCD / McDonald's Corporation | 0,01 | -8,92 | 3,18 | -14,82 | 0,2725 | -0,0795 | |||
| ROP / Roper Technologies, Inc. | 0,01 | 0,00 | 3,12 | -3,86 | 0,2667 | -0,0386 | |||
| QUAL / iShares Trust - iShares MSCI USA Quality Factor ETF | 0,01 | 17,20 | 2,61 | 25,37 | 0,2232 | 0,0273 | |||
| PYPL / PayPal Holdings, Inc. | 0,02 | -0,46 | 1,61 | 13,34 | 0,1375 | 0,0040 | |||
| GILD / Gilead Sciences, Inc. | 0,01 | 0,00 | 1,55 | -1,02 | 0,1328 | -0,0149 | |||
| XOM / Exxon Mobil Corporation | 0,01 | -3,94 | 1,55 | -12,91 | 0,1327 | -0,0350 | |||
| ESS / Essex Property Trust, Inc. | 0,00 | -6,41 | 1,41 | -13,48 | 0,1203 | -0,0327 | |||
| NTRS / Northern Trust Corporation | 0,01 | 0,00 | 1,38 | 28,50 | 0,1177 | 0,0169 | |||
| GOOGL / Alphabet Inc. | 0,01 | -11,68 | 1,37 | 0,66 | 0,1171 | -0,0109 | |||
| AMGN / Amgen Inc. | 0,00 | 1,29 | 0,1100 | 0,1100 | |||||
| NVDA / NVIDIA Corporation | 0,01 | 9,02 | 1,25 | 58,91 | 0,1069 | 0,0329 | |||
| KO / The Coca-Cola Company | 0,02 | 0,00 | 1,20 | -1,23 | 0,1029 | -0,0117 | |||
| DG / Dollar General Corporation | 0,01 | -6,94 | 1,18 | 21,07 | 0,1008 | 0,0092 | |||
| ESNT / Essent Group Ltd. | 0,02 | 2,69 | 1,14 | 8,07 | 0,0974 | -0,0018 | |||
| NOC / Northrop Grumman Corporation | 0,00 | 11,21 | 1,11 | 8,61 | 0,0950 | -0,0013 | |||
| ABBV / AbbVie Inc. | 0,01 | 19,05 | 1,10 | 5,56 | 0,0943 | -0,0041 | |||
| LKQ / LKQ Corporation | 0,03 | 18,28 | 1,02 | 2,92 | 0,0876 | -0,0061 | |||
| TFC / Truist Financial Corporation | 0,02 | 0,90 | 1,01 | 5,42 | 0,0865 | -0,0038 | |||
| NXST / Nexstar Media Group, Inc. | 0,01 | 0,47 | 0,99 | -3,04 | 0,0846 | -0,0114 | |||
| APAM / Artisan Partners Asset Management Inc. | 0,02 | 10,93 | 0,98 | 25,77 | 0,0835 | 0,0104 | |||
| CVX / Chevron Corporation | 0,01 | 7,75 | 0,95 | -7,79 | 0,0811 | -0,0157 | |||
| UNH / UnitedHealth Group Incorporated | 0,00 | -96,58 | 0,93 | -97,96 | 0,0799 | -4,2370 | |||
| COST / Costco Wholesale Corporation | 0,00 | 0,00 | 0,91 | 4,60 | 0,0779 | -0,0040 | |||
| HSY / The Hershey Company | 0,01 | 1,77 | 0,91 | -1,31 | 0,0777 | -0,0089 | |||
| CL / Colgate-Palmolive Company | 0,01 | -10,42 | 0,91 | -13,06 | 0,0774 | -0,0206 | |||
| MTN / Vail Resorts, Inc. | 0,01 | 15,75 | 0,90 | 13,64 | 0,0770 | 0,0024 | |||
| HON / Honeywell International Inc. | 0,00 | 13,24 | 0,87 | 24,68 | 0,0748 | 0,0087 | |||
| SYK / Stryker Corporation | 0,00 | 0,00 | 0,85 | 6,28 | 0,0724 | -0,0026 | |||
| SGOV / iShares Trust - iShares 0-3 Month Treasury Bond ETF | 0,01 | -25,85 | 0,84 | -25,86 | 0,0722 | -0,0349 | |||
| VICI / VICI Properties Inc. | 0,03 | 6,73 | 0,83 | 6,71 | 0,0708 | -0,0023 | |||
| TROW / T. Rowe Price Group, Inc. | 0,01 | 17,86 | 0,82 | 23,86 | 0,0697 | 0,0077 | |||
| SBUX / Starbucks Corporation | 0,01 | 0,80 | 0,0684 | 0,0684 | |||||
| CTRA / Coterra Energy Inc. | 0,03 | 11,68 | 0,76 | -1,94 | 0,0651 | -0,0080 | |||
| LAMR / Lamar Advertising Company | 0,01 | -6,62 | 0,73 | -0,41 | 0,0626 | -0,0066 | |||
| EMN / Eastman Chemical Company | 0,01 | 32,60 | 0,67 | 12,37 | 0,0575 | 0,0012 | |||
| BRK.B / Berkshire Hathaway Inc. | 0,00 | 0,00 | 0,63 | -8,70 | 0,0539 | -0,0111 | |||
| AAPL / Apple Inc. | 0,00 | -66,13 | 0,61 | -68,72 | 0,0521 | -0,1311 | |||
| COP / ConocoPhillips | 0,01 | 0,00 | 0,56 | -14,50 | 0,0479 | -0,0138 | |||
| ET / Energy Transfer LP - Limited Partnership | 0,03 | 0,00 | 0,50 | -2,55 | 0,0425 | -0,0055 | |||
| DHI / D.R. Horton, Inc. | 0,00 | -64,92 | 0,46 | -64,46 | 0,0395 | -0,0827 | |||
| FDS / FactSet Research Systems Inc. | 0,00 | -8,68 | 0,44 | -10,16 | 0,0378 | -0,0085 | |||
| JNJ / Johnson & Johnson | 0,00 | -2,59 | 0,37 | -10,34 | 0,0320 | -0,0072 | |||
| OKE / ONEOK, Inc. | 0,00 | 0,37 | 0,0318 | 0,0318 | |||||
| ADBE / Adobe Inc. | 0,00 | -98,62 | 0,37 | -98,61 | 0,0315 | -2,4532 | |||
| PG / The Procter & Gamble Company | 0,00 | 0,00 | 0,37 | -6,65 | 0,0313 | -0,0055 | |||
| GLD / SPDR Gold Trust | 0,00 | 0,08 | 0,36 | 5,87 | 0,0309 | -0,0012 | |||
| PECO / Phillips Edison & Company, Inc. | 0,01 | 0,32 | 0,0270 | 0,0270 | |||||
| PAYX / Paychex, Inc. | 0,00 | 0,00 | 0,29 | -5,84 | 0,0249 | -0,0042 | |||
| HD / The Home Depot, Inc. | 0,00 | 0,00 | 0,28 | 0,00 | 0,0243 | -0,0024 | |||
| VTI / Vanguard Index Funds - Vanguard Total Stock Market ETF | 0,00 | -3,81 | 0,28 | 6,56 | 0,0237 | -0,0008 | |||
| ORCL / Oracle Corporation | 0,00 | 0,23 | 0,0195 | 0,0195 | |||||
| VIOG / Vanguard Admiral Funds - Vanguard S&P Small-Cap 600 Growth ETF | 0,00 | 0,22 | 0,0191 | 0,0191 | |||||
| CCO / Clear Channel Outdoor Holdings, Inc. | 0,03 | 0,00 | 0,04 | 5,71 | 0,0032 | -0,0001 | |||
| BALL / Ball Corporation | 0,00 | -100,00 | 0,00 | 0,0000 | |||||
| NEM / Newmont Corporation | 0,00 | -100,00 | 0,00 | 0,0000 | |||||
| GSK / GSK plc - Depositary Receipt (Common Stock) | 0,00 | -100,00 | 0,00 | 0,0000 | |||||
| SPY / SPDR S&P 500 ETF | 0,00 | -100,00 | 0,00 | 0,0000 |