Statistiques de base
| Valeur du portefeuille | $ 166 022 270 |
| Positions actuelles | 26 |
Dernières positions, performances, ASG (à partir des dépôts 13F, 13D)
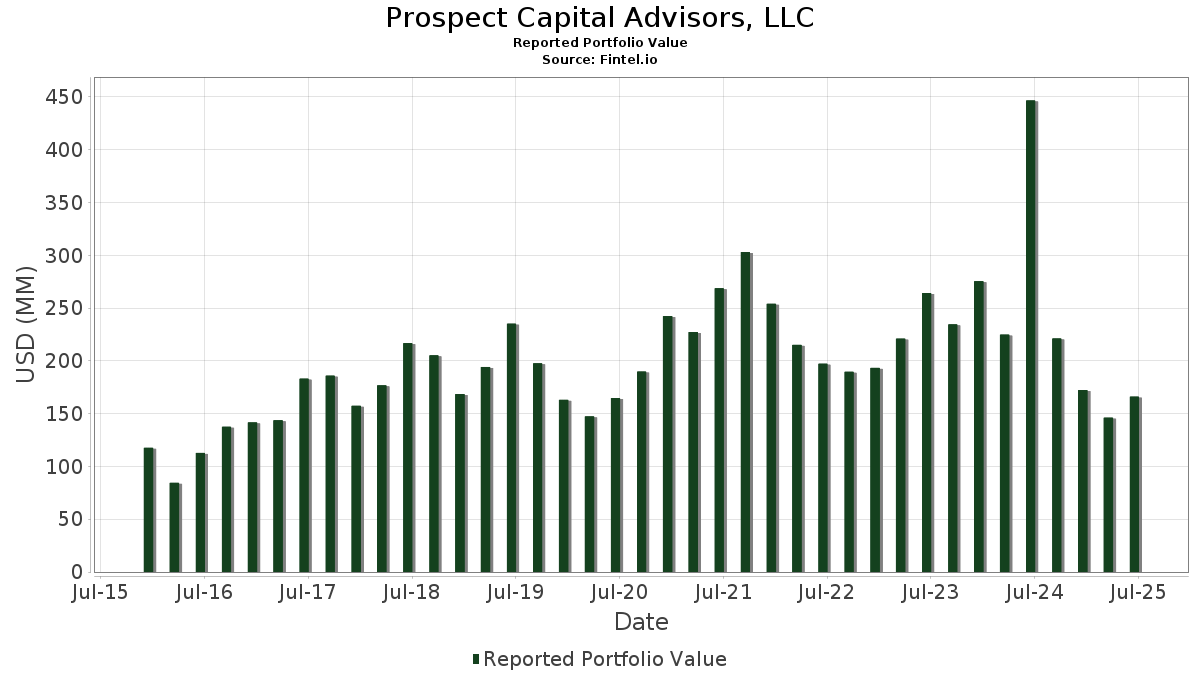
Prospect Capital Advisors, LLC a déclaré un total de 26 positions dans ses derniers dépôts auprès de la SEC. La valeur la plus récente du portefeuille est calculée à 166 022 270 USD. Les actifs sous gestion réels (ASG) sont cette valeur plus les liquidités (qui ne sont pas divulguées). Les principales positions de Prospect Capital Advisors, LLC sont PJT Partners Inc. (US:PJT) , Grand Canyon Education, Inc. (US:LOPE) , OSI Systems, Inc. (US:OSIS) , Silicon Motion Technology Corporation - Depositary Receipt (Common Stock) (US:SIMO) , and Enova International, Inc. (US:ENVA) . Les nouvelles positions de Prospect Capital Advisors, LLC incluent Dave Inc. (US:DAVE) , United States Antimony Corporation (US:UAMY) , Turning Point Brands, Inc. (US:TPB) , Blend Labs, Inc. (US:BLND) , and .
Meilleures augmentations ce trimestre
Nous utilisons la variation de l'allocation du portefeuille car il s'agit de l'indicateur le plus significatif. Les changements peuvent être dus à des transactions ou à des variations de prix des actions.
| Titre | Actions (en millions) |
Valeur ($ en millions) |
% du portefeuille | ΔPortefeuille % |
|---|---|---|---|---|
| 0,02 | 4,88 | 2,9392 | 2,9392 | |
| 1,30 | 2,83 | 1,7057 | 1,7057 | |
| 0,03 | 2,60 | 1,5677 | 1,5677 | |
| 0,42 | 1,37 | 0,8257 | 0,8257 |
Principales baisses ce trimestre
Nous utilisons la variation de l'allocation du portefeuille car il s'agit de l'indicateur le plus significatif. Les changements peuvent être dus à des transactions ou à des variations de prix des actions.
| Titre | Actions (en millions) |
Valeur ($ en millions) |
% du portefeuille | ΔPortefeuille % |
|---|---|---|---|---|
| 0,04 | 8,73 | 2,6981 | -4,7143 | |
| 0,07 | 13,74 | 4,2448 | -4,4796 | |
| 0,10 | 15,85 | 4,8953 | -4,1674 | |
| 0,05 | 12,03 | 3,7154 | -3,4177 | |
| 0,18 | 4,67 | 1,4442 | -2,8933 | |
| 0,18 | 7,85 | 2,4244 | -2,6311 | |
| 0,03 | 6,95 | 2,1467 | -2,5955 | |
| 0,09 | 9,56 | 2,9518 | -2,5873 | |
| 0,02 | 4,54 | 1,4011 | -1,9894 | |
| 0,25 | 6,97 | 2,1530 | -1,6075 |
Déclarations 13F et dépôts de fonds
Ce formulaire a été déposé le 2025-08-14 pour la période de déclaration 2025-06-30. Cliquez sur l'icône du lien pour voir l'historique complet des transactions.
Mettre à niveau pour débloquer les données premium et exporter vers Excel ![]() .
.
| Titre | Type | Prix moyen de l'action | Actions (en millions) |
ΔActions (%) |
ΔActions (%) |
Valeur ($ en millions) |
Portefeuille (%) |
ΔPortefeuille (%) |
|
|---|---|---|---|---|---|---|---|---|---|
| PJT / PJT Partners Inc. | 0,10 | 0,00 | 15,85 | 19,68 | 4,8953 | -4,1674 | |||
| LOPE / Grand Canyon Education, Inc. | 0,07 | -1,32 | 13,74 | 7,80 | 4,2448 | -4,4796 | |||
| OSIS / OSI Systems, Inc. | 0,05 | -0,26 | 12,03 | 15,40 | 3,7154 | -3,4177 | |||
| SIMO / Silicon Motion Technology Corporation - Depositary Receipt (Common Stock) | 0,13 | 0,00 | 9,65 | 48,68 | 2,9806 | -1,4611 | |||
| ENVA / Enova International, Inc. | 0,09 | 2,23 | 9,56 | 18,08 | 2,9518 | -2,5873 | |||
| ARLO / Arlo Technologies, Inc. | 0,55 | 5,14 | 9,25 | 80,68 | 2,8568 | -0,6466 | |||
| RSI / Rush Street Interactive, Inc. | 0,60 | 35,62 | 8,91 | 88,51 | 2,7517 | -0,4826 | |||
| IDCC / InterDigital, Inc. | 0,04 | -25,64 | 8,73 | -19,36 | 2,6981 | -4,7143 | |||
| TTMI / TTM Technologies, Inc. | 0,21 | -5,11 | 8,73 | 88,89 | 2,6955 | -0,4666 | |||
| BLBD / Blue Bird Corporation | 0,18 | -20,31 | 7,85 | 6,24 | 2,4244 | -2,6311 | |||
| IMAX / IMAX Corporation | 0,25 | 19,54 | 6,97 | 26,87 | 2,1530 | -1,6075 | |||
| AMT / American Tower Corporation | 0,03 | -1,26 | 6,95 | 0,29 | 2,1467 | -2,5955 | |||
| MSFT / Microsoft Corporation | 0,01 | 0,00 | 5,72 | 32,52 | 1,7679 | -1,1882 | |||
| CMPO / CompoSecure, Inc. | 0,38 | -1,29 | 5,41 | 27,96 | 1,6715 | -1,2227 | |||
| DAVE / Dave Inc. | 0,02 | 4,88 | 2,9392 | 2,9392 | |||||
| FIVN / Five9, Inc. | 0,18 | -24,36 | 4,67 | -26,24 | 1,4442 | -2,8933 | |||
| POOL / Pool Corporation | 0,02 | 0,00 | 4,54 | -8,44 | 1,4011 | -1,9894 | |||
| WSO / Watsco, Inc. | 0,01 | 26,74 | 4,35 | 10,12 | 1,3452 | -1,3616 | |||
| SEZL / Sezzle Inc. | 0,02 | -82,35 | 3,45 | -9,29 | 1,0646 | -1,5360 | |||
| FSS / Federal Signal Corporation | 0,03 | 50,17 | 3,32 | 117,30 | 1,0244 | -0,0202 | |||
| UAMY / United States Antimony Corporation | 1,30 | 2,83 | 1,7057 | 1,7057 | |||||
| TPB / Turning Point Brands, Inc. | 0,03 | 2,60 | 1,5677 | 1,5677 | |||||
| LSCC / Lattice Semiconductor Corporation | 0,05 | -18,56 | 2,29 | -23,96 | 0,7071 | -1,3525 | |||
| BLND / Blend Labs, Inc. | 0,42 | 1,37 | 0,8257 | 0,8257 | |||||
| NXST / Nexstar Media Group, Inc. | 0,01 | 0,00 | 1,30 | -3,50 | 0,4007 | -0,5193 | |||
| WSC / WillScot Holdings Corporation | 0,04 | -60,00 | 1,10 | -60,58 | 0,3386 | -1,5642 | |||
| PAYO / Payoneer Global Inc. | 0,00 | -100,00 | 0,00 | 0,0000 | |||||
| RHLD.V / Resolute Holdings Management, Inc. | 0,00 | -100,00 | 0,00 | 0,0000 | |||||
| GRPN / Groupon, Inc. | 0,00 | -100,00 | 0,00 | 0,0000 | |||||
| PI / Impinj, Inc. | 0,00 | -100,00 | 0,00 | 0,0000 | |||||
| INMD / InMode Ltd. | 0,00 | -100,00 | 0,00 | 0,0000 | |||||
| BB / BlackBerry Limited | 0,00 | -100,00 | 0,00 | -100,00 | -1,3266 |