Statistiques de base
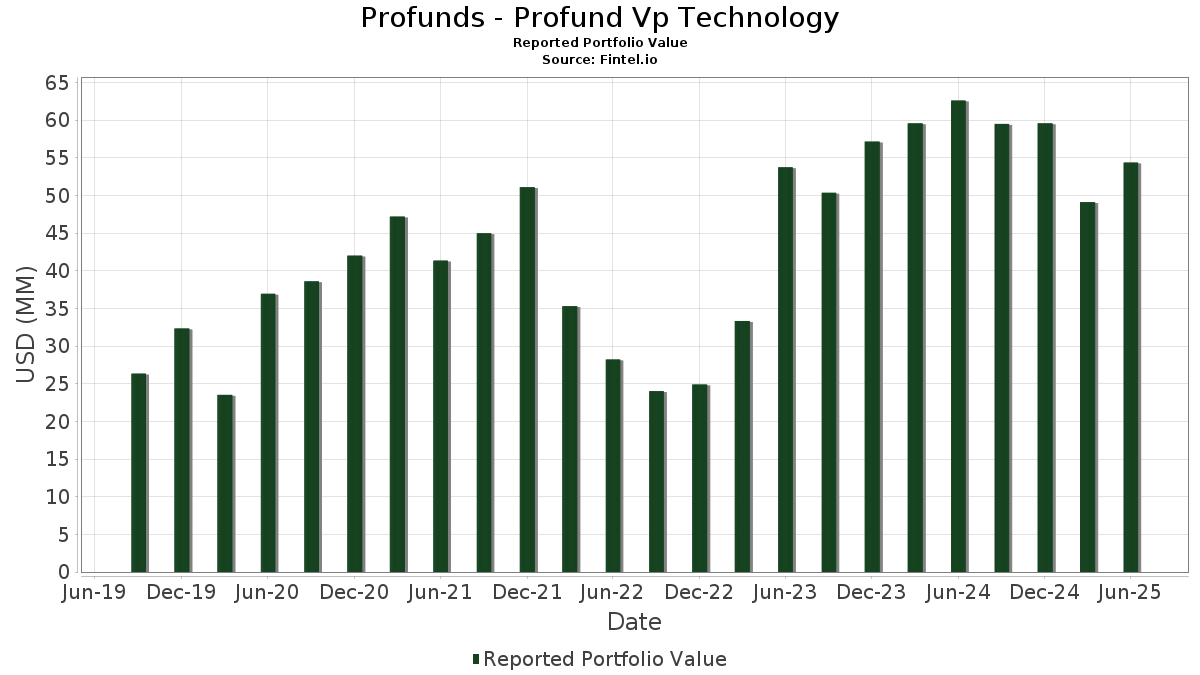
| Valeur du portefeuille | $ 54 368 851 |
| Positions actuelles | 77 |
Dernières positions, performances, ASG (à partir des dépôts 13F, 13D)
Profunds - Profund Vp Technology a déclaré un total de 77 positions dans ses derniers dépôts auprès de la SEC. La valeur la plus récente du portefeuille est calculée à 54 368 851 USD. Les actifs sous gestion réels (ASG) sont cette valeur plus les liquidités (qui ne sont pas divulguées). Les principales positions de Profunds - Profund Vp Technology sont NVIDIA Corporation (US:NVDA) , Microsoft Corporation (US:MSFT) , Apple Inc. (US:AAPL) , Broadcom Inc. (US:AVGO) , and Oracle Corporation (US:ORCL) .
Meilleures augmentations ce trimestre
Nous utilisons la variation de l'allocation du portefeuille car il s'agit de l'indicateur le plus significatif. Les changements peuvent être dus à des transactions ou à des variations de prix des actions.
| Titre | Actions (en millions) |
Valeur ($ en millions) |
% du portefeuille | ΔPortefeuille % |
|---|---|---|---|---|
| 0,05 | 7,92 | 18,4349 | 6,3130 | |
| 0,02 | 7,60 | 17,6883 | 4,9435 | |
| 0,01 | 2,66 | 6,2011 | 2,3219 | |
| 0,01 | 1,91 | 4,4395 | 1,7452 | |
| 0,01 | 1,56 | 3,6204 | 1,5651 | |
| 0,01 | 1,23 | 2,8725 | 0,8947 | |
| 0,00 | 1,18 | 2,7499 | 0,7087 | |
| 0,00 | 1,14 | 2,6562 | 0,7077 | |
| 0,00 | 1,47 | 3,4203 | 0,6889 | |
| 0,01 | 0,74 | 1,7198 | 0,5698 |
Principales baisses ce trimestre
Nous utilisons la variation de l'allocation du portefeuille car il s'agit de l'indicateur le plus significatif. Les changements peuvent être dus à des transactions ou à des variations de prix des actions.
| Titre | Actions (en millions) |
Valeur ($ en millions) |
% du portefeuille | ΔPortefeuille % |
|---|---|---|---|---|
| 0,03 | 6,30 | 14,6618 | -0,5778 | |
| 0,00 | 0,03 | 0,0650 | -0,0327 | |
| 0,01 | 0,12 | 0,2879 | -0,0206 | |
| -0,01 | -0,0135 | -0,0135 |
Déclarations 13F et dépôts de fonds
Ce formulaire a été déposé le 2025-08-26 pour la période de déclaration 2025-06-30. Cliquez sur l'icône du lien pour voir l'historique complet des transactions.
Mettre à niveau pour débloquer les données premium et exporter vers Excel ![]() .
.
| Titre | Type | Prix moyen de l'action | Actions (en millions) |
ΔActions (%) |
ΔActions (%) |
Valeur ($ en millions) |
Portefeuille (%) |
ΔPortefeuille (%) |
|
|---|---|---|---|---|---|---|---|---|---|
| NVDA / NVIDIA Corporation | 0,05 | -9,19 | 7,92 | 32,38 | 18,4349 | 6,3130 | |||
| MSFT / Microsoft Corporation | 0,02 | -8,83 | 7,60 | 20,81 | 17,6883 | 4,9435 | |||
| AAPL / Apple Inc. | 0,03 | -9,34 | 6,30 | -16,26 | 14,6618 | -0,5778 | |||
| AVGO / Broadcom Inc. | 0,01 | -15,49 | 2,66 | 39,18 | 6,2011 | 2,3219 | |||
| ORCL / Oracle Corporation | 0,01 | -8,28 | 1,91 | 43,49 | 4,4395 | 1,7452 | |||
| PLTR / Palantir Technologies Inc. | 0,01 | -5,07 | 1,56 | 53,35 | 3,6204 | 1,5651 | |||
| CSCO / Cisco Systems, Inc. | 0,02 | -8,62 | 1,48 | 2,71 | 3,4462 | 0,5264 | |||
| IBM / International Business Machines Corporation | 0,00 | -8,06 | 1,47 | 8,98 | 3,4203 | 0,6889 | |||
| CRM / Salesforce, Inc. | 0,01 | -8,29 | 1,40 | -6,84 | 3,2668 | 0,2157 | |||
| AMD / Advanced Micro Devices, Inc. | 0,01 | -8,47 | 1,23 | 26,43 | 2,8725 | 0,8947 | |||
| INTU / Intuit Inc. | 0,00 | -8,59 | 1,18 | 17,28 | 2,7499 | 0,7087 | |||
| NOW / ServiceNow, Inc. | 0,00 | -8,11 | 1,14 | 18,73 | 2,6562 | 0,7077 | |||
| TXN / Texas Instruments Incorporated | 0,00 | -8,71 | 1,01 | 5,42 | 2,3549 | 0,4115 | |||
| ACN / Accenture plc | 0,00 | -8,45 | 1,00 | -12,33 | 2,3361 | 0,0173 | |||
| QCOM / QUALCOMM Incorporated | 0,01 | -9,25 | 0,94 | -5,92 | 2,1815 | 0,1634 | |||
| ADBE / Adobe Inc. | 0,00 | -10,46 | 0,88 | -9,70 | 2,0585 | 0,0748 | |||
| AMAT / Applied Materials, Inc. | 0,00 | -8,54 | 0,80 | 15,34 | 1,8570 | 0,4561 | |||
| MU / Micron Technology, Inc. | 0,01 | -8,24 | 0,74 | 30,16 | 1,7198 | 0,5698 | |||
| PANW / Palo Alto Networks, Inc. | 0,00 | -8,50 | 0,73 | 9,67 | 1,6919 | 0,3498 | |||
| CRWD / CrowdStrike Holdings, Inc. | 0,00 | -7,48 | 0,68 | 33,60 | 1,5838 | 0,5523 | |||
| LRCX / Lam Research Corporation | 0,01 | -8,85 | 0,67 | 21,94 | 1,5545 | 0,4459 | |||
| APH / Amphenol Corporation | 0,01 | -8,63 | 0,64 | 37,63 | 1,4913 | 0,5477 | |||
| KLAC / KLA Corporation | 0,00 | -8,99 | 0,64 | 20,04 | 1,4782 | 0,4053 | |||
| ADI / Analog Devices, Inc. | 0,00 | -8,56 | 0,63 | 8,02 | 1,4737 | 0,2851 | |||
| ANET / Arista Networks Inc | 0,01 | -8,81 | 0,57 | 20,47 | 1,3155 | 0,3645 | |||
| INTC / Intel Corporation | 0,02 | -7,86 | 0,52 | -9,03 | 1,2199 | 0,0515 | |||
| CDNS / Cadence Design Systems, Inc. | 0,00 | -8,89 | 0,45 | 10,54 | 1,0508 | 0,2222 | |||
| SNPS / Synopsys, Inc. | 0,00 | -8,50 | 0,43 | 9,54 | 0,9893 | 0,2021 | |||
| MSI / Motorola Solutions, Inc. | 0,00 | -8,67 | 0,38 | -12,35 | 0,8759 | 0,0067 | |||
| FTNT / Fortinet, Inc. | 0,00 | -8,63 | 0,36 | 0,28 | 0,8386 | 0,1112 | |||
| ADSK / Autodesk, Inc. | 0,00 | -8,96 | 0,36 | 7,58 | 0,8272 | 0,1584 | |||
| ROP / Roper Technologies, Inc. | 0,00 | -8,27 | 0,33 | -11,62 | 0,7613 | 0,0100 | |||
| NXPI / NXP Semiconductors N.V. | 0,00 | -9,06 | 0,30 | 4,59 | 0,6891 | 0,1154 | |||
| WDAY / Workday, Inc. | 0,00 | -7,41 | 0,28 | -5,12 | 0,6491 | 0,0554 | |||
| TEL / TE Connectivity plc | 0,00 | -9,03 | 0,27 | 8,50 | 0,6246 | 0,1239 | |||
| FICO / Fair Isaac Corporation | 0,00 | -8,39 | 0,24 | -9,13 | 0,5574 | 0,0231 | |||
| GLW / Corning Incorporated | 0,00 | -8,52 | 0,22 | 5,34 | 0,5062 | 0,0869 | |||
| CTSH / Cognizant Technology Solutions Corporation | 0,00 | -8,83 | 0,21 | -6,79 | 0,4802 | 0,0308 | |||
| MCHP / Microchip Technology Incorporated | 0,00 | -8,53 | 0,20 | 33,55 | 0,4725 | 0,1632 | |||
| DELL / Dell Technologies Inc. | 0,00 | -12,14 | 0,20 | 18,67 | 0,4586 | 0,1208 | |||
| HSBC SECURITIES (USA), INC. B 4.3 , 7/01/2025 / RA (N/A) | 0,19 | 0,4469 | 0,4469 | ||||||
| MPWR / Monolithic Power Systems, Inc. | 0,00 | -8,21 | 0,19 | 15,43 | 0,4375 | 0,1085 | |||
| IT / Gartner, Inc. | 0,00 | -8,22 | 0,17 | -11,70 | 0,3886 | 0,0059 | |||
| ANSS / ANSYS, Inc. | 0,00 | -7,99 | 0,17 | 1,85 | 0,3859 | 0,0569 | |||
| STX / Seagate Technology Holdings plc | 0,00 | -8,30 | 0,16 | 56,19 | 0,3823 | 0,1687 | |||
| KEYS / Keysight Technologies, Inc. | 0,00 | -8,58 | 0,15 | 0,00 | 0,3536 | 0,0459 | |||
| HPE / Hewlett Packard Enterprise Company | 0,01 | -8,51 | 0,14 | 22,03 | 0,3354 | 0,0946 | |||
| GDDY / GoDaddy Inc. | 0,00 | -7,73 | 0,14 | -8,05 | 0,3202 | 0,0180 | |||
| TYL / Tyler Technologies, Inc. | 0,00 | -7,97 | 0,14 | -6,21 | 0,3188 | 0,0231 | |||
| SMCI / Super Micro Computer, Inc. | 0,00 | -6,77 | 0,13 | 32,67 | 0,3140 | 0,1092 | |||
| SOCIETE' GENERALE 4.26 , 7/01/2025 / RA (N/A) | 0,13 | 0,3003 | 0,3003 | ||||||
| TDY / Teledyne Technologies Incorporated | 0,00 | -8,06 | 0,13 | -5,19 | 0,2993 | 0,0240 | |||
| CDW / CDW Corporation | 0,00 | -9,60 | 0,13 | 0,80 | 0,2935 | 0,0399 | |||
| JBL / Jabil Inc. | 0,00 | -10,28 | 0,13 | 43,68 | 0,2924 | 0,1154 | |||
| VRSN / VeriSign, Inc. | 0,00 | -9,22 | 0,13 | 3,31 | 0,2911 | 0,0457 | |||
| HPQ / HP Inc. | 0,01 | -8,04 | 0,12 | -19,08 | 0,2879 | -0,0206 | |||
| WDC / Western Digital Corporation | 0,00 | -8,28 | 0,12 | 45,12 | 0,2787 | 0,1116 | |||
| ON / ON Semiconductor Corporation | 0,00 | -9,27 | 0,12 | 17,00 | 0,2735 | 0,0698 | |||
| NTAP / NetApp, Inc. | 0,00 | -8,47 | 0,12 | 11,54 | 0,2706 | 0,0584 | |||
| PTC / PTC Inc. | 0,00 | -8,92 | 0,11 | 0,92 | 0,2579 | 0,0363 | |||
| TRMB / Trimble Inc. | 0,00 | -11,17 | 0,10 | 3,19 | 0,2264 | 0,0347 | |||
| FSLR / First Solar, Inc. | 0,00 | -8,44 | 0,10 | 20,25 | 0,2216 | 0,0607 | |||
| FFIV / F5, Inc. | 0,00 | -8,88 | 0,09 | 1,12 | 0,2110 | 0,0287 | |||
| GEN / Gen Digital Inc. | 0,00 | -7,92 | 0,09 | 2,38 | 0,2004 | 0,0294 | |||
| ZBRA / Zebra Technologies Corporation | 0,00 | -9,30 | 0,08 | -1,18 | 0,1959 | 0,0236 | |||
| TER / Teradyne, Inc. | 0,00 | -9,84 | 0,08 | -1,28 | 0,1802 | 0,0204 | |||
| JNPR / Juniper Networks, Inc. | 0,00 | -8,50 | 0,07 | 0,00 | 0,1651 | 0,0228 | |||
| CREDIT AGRICOLE CIB NY 4.26 , 7/01/2025 / RA (N/A) | 0,06 | 0,1490 | 0,1490 | ||||||
| AKAM / Akamai Technologies, Inc. | 0,00 | -11,01 | 0,06 | -11,43 | 0,1455 | 0,0019 | |||
| SWKS / Skyworks Solutions, Inc. | 0,00 | -14,63 | 0,06 | -1,67 | 0,1396 | 0,0162 | |||
| UMB FINANCIAL CORP. B 4.1 , 7/01/2025 / RA (N/A) | 0,06 | 0,1350 | 0,1350 | ||||||
| EPAM / EPAM Systems, Inc. | 0,00 | -8,71 | 0,05 | -5,36 | 0,1251 | 0,0112 | |||
| NATWEST MARKETS PLC 4.24 , 7/01/2025 / RA (N/A) | 0,05 | 0,1234 | 0,1234 | ||||||
| VPTC_IXT_GOLDMAN / DE (N/A) | 0,05 | 0,1210 | 0,1210 | ||||||
| ROYAL BANK OF CANADA 4.15 , 7/01/2025 / RA (N/A) | 0,03 | 0,0745 | 0,0745 | ||||||
| ENPH / Enphase Energy, Inc. | 0,00 | -9,40 | 0,03 | -43,75 | 0,0650 | -0,0327 | |||
| VPTC_IXT_GOLDMAN / DE (N/A) | -0,01 | -0,0135 | -0,0135 |