Statistiques de base
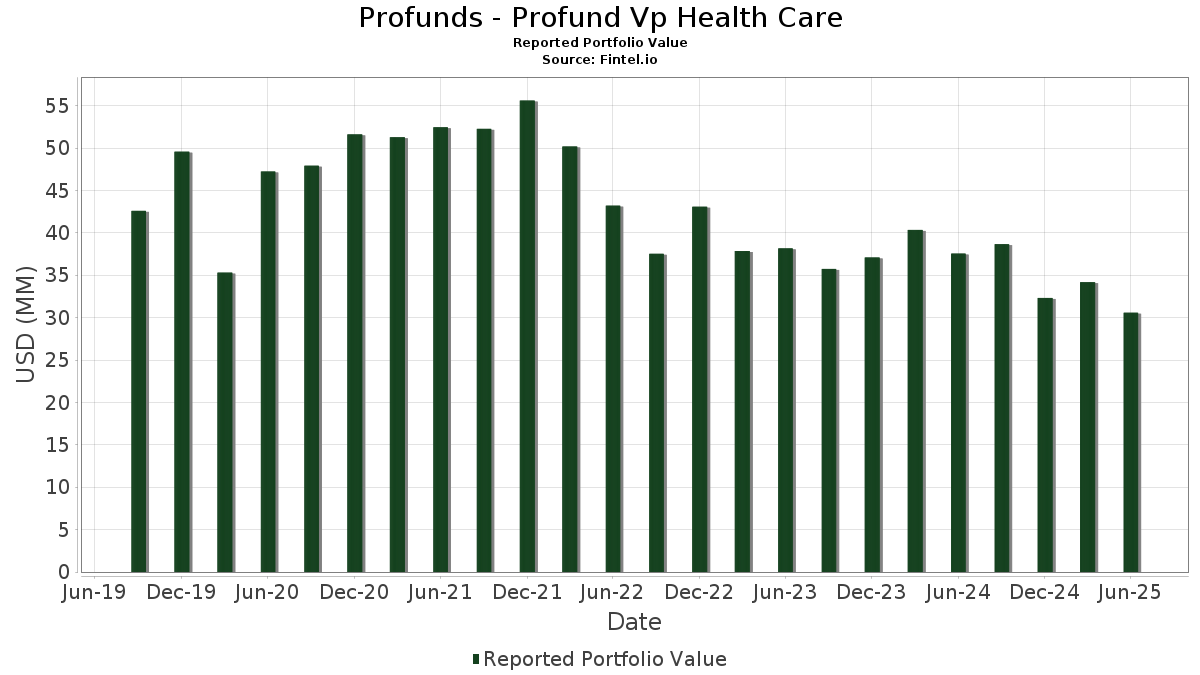
| Valeur du portefeuille | $ 30 574 502 |
| Positions actuelles | 68 |
Dernières positions, performances, ASG (à partir des dépôts 13F, 13D)
Profunds - Profund Vp Health Care a déclaré un total de 68 positions dans ses derniers dépôts auprès de la SEC. La valeur la plus récente du portefeuille est calculée à 30 574 502 USD. Les actifs sous gestion réels (ASG) sont cette valeur plus les liquidités (qui ne sont pas divulguées). Les principales positions de Profunds - Profund Vp Health Care sont Eli Lilly and Company (US:LLY) , Johnson & Johnson (US:JNJ) , AbbVie Inc. (US:ABBV) , UnitedHealth Group Incorporated (US:UNH) , and Abbott Laboratories (US:ABT) .
Meilleures augmentations ce trimestre
Nous utilisons la variation de l'allocation du portefeuille car il s'agit de l'indicateur le plus significatif. Les changements peuvent être dus à des transactions ou à des variations de prix des actions.
| Titre | Actions (en millions) |
Valeur ($ en millions) |
% du portefeuille | ΔPortefeuille % |
|---|---|---|---|---|
| 0,00 | 3,76 | 12,2274 | 3,7662 | |
| 0,01 | 2,25 | 7,3285 | 2,1374 | |
| 0,01 | 2,01 | 6,5379 | 1,7291 | |
| 0,01 | 1,45 | 4,7184 | 1,7271 | |
| 0,00 | 1,19 | 3,8845 | 1,5875 | |
| 0,01 | 0,97 | 3,1687 | 1,2357 | |
| 0,00 | 0,83 | 2,7136 | 1,0517 | |
| 0,02 | 1,22 | 3,9634 | 1,0113 | |
| 0,01 | 0,85 | 2,7501 | 0,9344 | |
| 0,03 | 0,84 | 2,7480 | 0,8810 |
Principales baisses ce trimestre
Nous utilisons la variation de l'allocation du portefeuille car il s'agit de l'indicateur le plus significatif. Les changements peuvent être dus à des transactions ou à des variations de prix des actions.
| Titre | Actions (en millions) |
Valeur ($ en millions) |
% du portefeuille | ΔPortefeuille % |
|---|---|---|---|---|
| 0,01 | 1,74 | 5,6432 | -0,6236 | |
| -0,00 | -0,0020 | -0,0020 |
Déclarations 13F et dépôts de fonds
Ce formulaire a été déposé le 2025-08-26 pour la période de déclaration 2025-06-30. Cliquez sur l'icône du lien pour voir l'historique complet des transactions.
Mettre à niveau pour débloquer les données premium et exporter vers Excel ![]() .
.
| Titre | Type | Prix moyen de l'action | Actions (en millions) |
ΔActions (%) |
ΔActions (%) |
Valeur ($ en millions) |
Portefeuille (%) |
ΔPortefeuille (%) |
|
|---|---|---|---|---|---|---|---|---|---|
| LLY / Eli Lilly and Company | 0,00 | -1,69 | 3,76 | -7,21 | 12,2274 | 3,7662 | |||
| JNJ / Johnson & Johnson | 0,01 | -1,59 | 2,25 | -9,34 | 7,3285 | 2,1374 | |||
| ABBV / AbbVie Inc. | 0,01 | -1,46 | 2,01 | -12,68 | 6,5379 | 1,7291 | |||
| UNH / UnitedHealth Group Incorporated | 0,01 | -2,93 | 1,74 | -42,19 | 5,6432 | -0,6236 | |||
| ABT / Abbott Laboratories | 0,01 | -1,22 | 1,45 | 1,26 | 4,7184 | 1,7271 | |||
| MRK / Merck & Co., Inc. | 0,02 | -2,25 | 1,22 | -13,80 | 3,9634 | 1,0113 | |||
| ISRG / Intuitive Surgical, Inc. | 0,00 | -1,04 | 1,19 | 8,64 | 3,8845 | 1,5875 | |||
| BSX / Boston Scientific Corporation | 0,01 | -1,14 | 0,97 | 5,30 | 3,1687 | 1,2357 | |||
| TMO / Thermo Fisher Scientific Inc. | 0,00 | -2,85 | 0,94 | -20,84 | 3,0514 | 0,5763 | |||
| AMGN / Amgen Inc. | 0,00 | -1,43 | 0,92 | -11,71 | 2,9939 | 0,8177 | |||
| GILD / Gilead Sciences, Inc. | 0,01 | -1,71 | 0,85 | -2,76 | 2,7501 | 0,9344 | |||
| PFE / Pfizer Inc. | 0,03 | -1,21 | 0,84 | -5,59 | 2,7480 | 0,8810 | |||
| SYK / Stryker Corporation | 0,00 | -1,36 | 0,83 | 4,91 | 2,7136 | 1,0517 | |||
| DHR / Danaher Corporation | 0,00 | -2,01 | 0,77 | -5,51 | 2,5088 | 0,8029 | |||
| VRTX / Vertex Pharmaceuticals Incorporated | 0,00 | -1,56 | 0,70 | -9,68 | 2,2790 | 0,6602 | |||
| MDT / Medtronic plc | 0,01 | -1,52 | 0,69 | -4,46 | 2,2291 | 0,7310 | |||
| BMY / Bristol-Myers Squibb Company | 0,01 | -1,25 | 0,58 | -25,06 | 1,8784 | 0,2692 | |||
| MCK / McKesson Corporation | 0,00 | -1,67 | 0,56 | 7,25 | 1,8279 | 0,7317 | |||
| CI / The Cigna Group | 0,00 | -3,93 | 0,54 | -3,39 | 1,7611 | 0,5897 | |||
| ELV / Elevance Health, Inc. | 0,00 | -4,09 | 0,54 | -14,33 | 1,7520 | 0,4405 | |||
| CVS / CVS Health Corporation | 0,01 | -1,20 | 0,54 | 0,75 | 1,7400 | 0,6294 | |||
| ZTS / Zoetis Inc. | 0,00 | -2,08 | 0,43 | -7,41 | 1,3846 | 0,4261 | |||
| HCA / HCA Healthcare, Inc. | 0,00 | -4,58 | 0,41 | 5,73 | 1,3232 | 0,5201 | |||
| REGN / Regeneron Pharmaceuticals, Inc. | 0,00 | -2,75 | 0,33 | -19,52 | 1,0876 | 0,2202 | |||
| COR / Cencora, Inc. | 0,00 | -1,58 | 0,32 | 6,38 | 1,0317 | 0,4075 | |||
| BDX / Becton, Dickinson and Company | 0,00 | -1,73 | 0,30 | -26,16 | 0,9843 | 0,1290 | |||
| EW / Edwards Lifesciences Corporation | 0,00 | -2,04 | 0,28 | 5,64 | 0,9149 | 0,3592 | |||
| IDXX / IDEXX Laboratories, Inc. | 0,00 | -3,33 | 0,26 | 23,36 | 0,8599 | 0,4127 | |||
| CAH / Cardinal Health, Inc. | 0,00 | -2,73 | 0,25 | 18,36 | 0,7994 | 0,3667 | |||
| RMD / ResMed Inc. | 0,00 | -1,64 | 0,23 | 13,24 | 0,7543 | 0,3271 | |||
| DXCM / DexCom, Inc. | 0,00 | -1,19 | 0,21 | 25,90 | 0,6825 | 0,3355 | |||
| HSBC SECURITIES (USA), INC. B 4.3 , 7/01/2025 / RA (N/A) | 0,21 | 0,6765 | 0,6765 | ||||||
| GEHC / GE HealthCare Technologies Inc. | 0,00 | -1,40 | 0,21 | -9,61 | 0,6762 | 0,1964 | |||
| A / Agilent Technologies, Inc. | 0,00 | -1,58 | 0,21 | -0,48 | 0,6709 | 0,2370 | |||
| HUM / Humana Inc. | 0,00 | -1,46 | 0,18 | -9,09 | 0,5884 | 0,1734 | |||
| CNC / Centene Corporation | 0,00 | -1,20 | 0,17 | -11,76 | 0,5386 | 0,1471 | |||
| IQV / IQVIA Holdings Inc. | 0,00 | -3,26 | 0,16 | -13,66 | 0,5166 | 0,1330 | |||
| MTD / Mettler-Toledo International Inc. | 0,00 | -2,31 | 0,15 | -2,61 | 0,4852 | 0,1646 | |||
| STE / STERIS plc | 0,00 | -1,63 | 0,14 | 4,35 | 0,4703 | 0,1807 | |||
| SOCIETE' GENERALE 4.26 , 7/01/2025 / RA (N/A) | 0,14 | 0,4553 | 0,4553 | ||||||
| PODD / Insulet Corporation | 0,00 | -1,37 | 0,14 | 18,42 | 0,4404 | 0,2008 | |||
| LH / Labcorp Holdings Inc. | 0,00 | -1,16 | 0,13 | 11,67 | 0,4380 | 0,1857 | |||
| WAT / Waters Corporation | 0,00 | -1,35 | 0,13 | -6,62 | 0,4143 | 0,1296 | |||
| DGX / Quest Diagnostics Incorporated | 0,00 | -1,01 | 0,12 | 5,17 | 0,3996 | 0,1554 | |||
| BIIB / Biogen Inc. | 0,00 | -1,43 | 0,11 | -9,68 | 0,3668 | 0,1065 | |||
| ZBH / Zimmer Biomet Holdings, Inc. | 0,00 | -2,10 | 0,11 | -21,43 | 0,3598 | 0,0670 | |||
| MOH / Molina Healthcare, Inc. | 0,00 | -4,05 | 0,10 | -13,27 | 0,3217 | 0,0837 | |||
| WST / West Pharmaceutical Services, Inc. | 0,00 | -2,44 | 0,10 | -4,00 | 0,3131 | 0,1023 | |||
| BAX / Baxter International Inc. | 0,00 | -1,04 | 0,10 | -12,04 | 0,3098 | 0,0826 | |||
| HOLX / Hologic, Inc. | 0,00 | -2,22 | 0,09 | 3,49 | 0,2895 | 0,1093 | |||
| COO / The Cooper Companies, Inc. | 0,00 | -1,37 | 0,09 | -16,35 | 0,2837 | 0,0648 | |||
| ALGN / Align Technology, Inc. | 0,00 | -4,35 | 0,08 | 14,49 | 0,2574 | 0,1124 | |||
| CREDIT AGRICOLE CIB NY 4.26 , 7/01/2025 / RA (N/A) | 0,07 | 0,2277 | 0,2277 | ||||||
| RVTY / Revvity, Inc. | 0,00 | -4,62 | 0,07 | -13,75 | 0,2274 | 0,0600 | |||
| INCY / Incyte Corporation | 0,00 | -1,50 | 0,07 | 11,67 | 0,2182 | 0,0917 | |||
| SOLV / Solventum Corporation | 0,00 | -1,28 | 0,06 | -1,54 | 0,2094 | 0,0729 | |||
| VTRS / Viatris Inc. | 0,01 | -3,18 | 0,06 | 0,00 | 0,2090 | 0,0738 | |||
| UHS / Universal Health Services, Inc. | 0,00 | -4,10 | 0,06 | -7,35 | 0,2068 | 0,0632 | |||
| UMB FINANCIAL CORP. B 4.1 , 7/01/2025 / RA (N/A) | 0,06 | 0,2016 | 0,2016 | ||||||
| MRNA / Moderna, Inc. | 0,00 | -1,00 | 0,06 | -3,39 | 0,1873 | 0,0625 | |||
| NATWEST MARKETS PLC 4.24 , 7/01/2025 / RA (N/A) | 0,06 | 0,1854 | 0,1854 | ||||||
| HSIC / Henry Schein, Inc. | 0,00 | -3,87 | 0,05 | 1,89 | 0,1772 | 0,0662 | |||
| TECH / Bio-Techne Corporation | 0,00 | -2,34 | 0,05 | -14,04 | 0,1608 | 0,0403 | |||
| CRL / Charles River Laboratories International, Inc. | 0,00 | -5,35 | 0,05 | -4,26 | 0,1485 | 0,0486 | |||
| DVA / DaVita Inc. | 0,00 | -6,93 | 0,04 | -12,20 | 0,1181 | 0,0306 | |||
| ROYAL BANK OF CANADA 4.15 , 7/01/2025 / RA (N/A) | 0,04 | 0,1138 | 0,1138 | ||||||
| VPHC_IXV_GOLDMAN / DE (N/A) | 0,01 | 0,0469 | 0,0469 | ||||||
| VPHC_IXV_GOLDMAN / DE (N/A) | -0,00 | -0,0020 | -0,0020 |