Statistiques de base
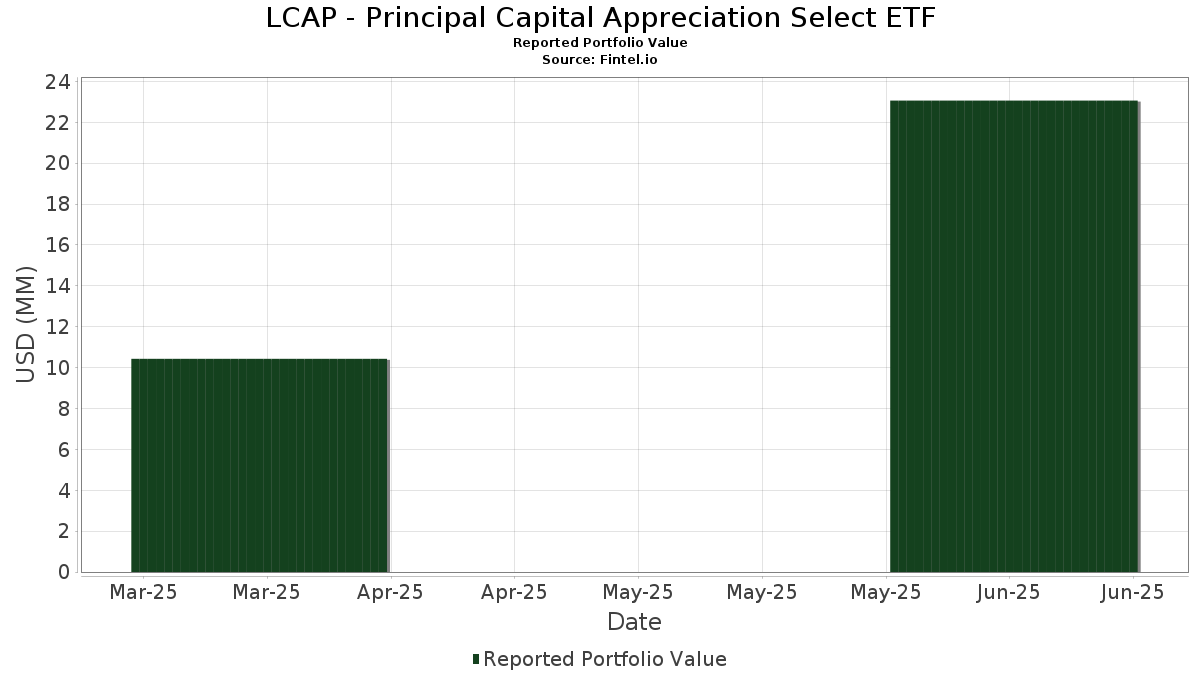
| Valeur du portefeuille | $ 23 060 286 |
| Positions actuelles | 51 |
Dernières positions, performances, ASG (à partir des dépôts 13F, 13D)
LCAP - Principal Capital Appreciation Select ETF a déclaré un total de 51 positions dans ses derniers dépôts auprès de la SEC. La valeur la plus récente du portefeuille est calculée à 23 060 286 USD. Les actifs sous gestion réels (ASG) sont cette valeur plus les liquidités (qui ne sont pas divulguées). Les principales positions de LCAP - Principal Capital Appreciation Select ETF sont Microsoft Corporation (US:MSFT) , NVIDIA Corporation (US:NVDA) , Apple Inc. (US:AAPL) , Amazon.com, Inc. (US:AMZN) , and Visa Inc. (US:V) . Les nouvelles positions de LCAP - Principal Capital Appreciation Select ETF incluent Motorola Solutions, Inc. (US:MSI) , Eaton Corporation plc (US:ETN) , The Boeing Company (US:BA) , Extra Space Storage Inc. (US:EXR) , and Tesla, Inc. (US:TSLA) .
Meilleures augmentations ce trimestre
Nous utilisons la variation de l'allocation du portefeuille car il s'agit de l'indicateur le plus significatif. Les changements peuvent être dus à des transactions ou à des variations de prix des actions.
| Titre | Actions (en millions) |
Valeur ($ en millions) |
% du portefeuille | ΔPortefeuille % |
|---|---|---|---|---|
| 0,01 | 1,60 | 6,9589 | 2,4516 | |
| 0,00 | 0,55 | 2,3946 | 1,7401 | |
| 0,00 | 0,40 | 1,7375 | 1,7375 | |
| 0,00 | 1,61 | 6,9601 | 1,7055 | |
| 0,00 | 0,35 | 1,5077 | 1,5077 | |
| 0,01 | 0,63 | 2,7448 | 1,2847 | |
| 0,00 | 0,22 | 0,9694 | 0,9694 | |
| 0,00 | 0,18 | 0,7659 | 0,7659 | |
| 0,00 | 0,16 | 0,6997 | 0,6997 | |
| 0,01 | 0,55 | 2,3637 | 0,6708 |
Principales baisses ce trimestre
Nous utilisons la variation de l'allocation du portefeuille car il s'agit de l'indicateur le plus significatif. Les changements peuvent être dus à des transactions ou à des variations de prix des actions.
| Titre | Actions (en millions) |
Valeur ($ en millions) |
% du portefeuille | ΔPortefeuille % |
|---|---|---|---|---|
| 0,00 | 0,00 | -2,2447 | ||
| 0,00 | 0,29 | 1,2642 | -1,5362 | |
| 0,01 | 1,05 | 4,5523 | -1,3960 | |
| 0,00 | 0,27 | 1,1684 | -1,2258 | |
| 0,00 | 0,61 | 2,6573 | -1,0763 | |
| 0,00 | 0,39 | 1,6998 | -1,0012 | |
| 0,00 | 0,40 | 1,7415 | -0,9569 | |
| 0,00 | 0,00 | -0,9298 | ||
| 0,00 | 0,80 | 3,4794 | -0,7864 | |
| 0,00 | 0,22 | 0,9591 | -0,7847 |
Déclarations 13F et dépôts de fonds
Ce formulaire a été déposé le 2025-08-15 pour la période de déclaration 2025-06-30. Cliquez sur l'icône du lien pour voir l'historique complet des transactions.
Mettre à niveau pour débloquer les données premium et exporter vers Excel ![]() .
.
| Titre | Type | Prix moyen de l'action | Actions (en millions) |
ΔActions (%) |
ΔActions (%) |
Valeur ($ en millions) |
Portefeuille (%) |
ΔPortefeuille (%) |
|
|---|---|---|---|---|---|---|---|---|---|
| MSFT / Microsoft Corporation | 0,00 | 122,71 | 1,61 | 195,58 | 6,9601 | 1,7055 | |||
| NVDA / NVIDIA Corporation | 0,01 | 135,96 | 1,60 | 244,21 | 6,9589 | 2,4516 | |||
| AAPL / Apple Inc. | 0,01 | 84,60 | 1,05 | 70,57 | 4,5523 | -1,3960 | |||
| AMZN / Amazon.com, Inc. | 0,00 | 116,14 | 0,82 | 149,54 | 3,5408 | 0,3758 | |||
| V / Visa Inc. | 0,00 | 79,37 | 0,80 | 81,86 | 3,4794 | -0,7864 | |||
| JPM / JPMorgan Chase & Co. | 0,00 | 111,98 | 0,80 | 150,78 | 3,4696 | 0,3843 | |||
| GOOGL / Alphabet Inc. | 0,00 | 96,53 | 0,78 | 124,21 | 3,3745 | 0,0178 | |||
| META / Meta Platforms, Inc. | 0,00 | 92,76 | 0,75 | 147,02 | 3,2389 | 0,3158 | |||
| AVGO / Broadcom Inc. | 0,00 | 41,92 | 0,71 | 133,77 | 3,0634 | 0,1424 | |||
| BR / Broadridge Financial Solutions, Inc. | 0,00 | 104,76 | 0,66 | 105,63 | 2,8548 | -0,2440 | |||
| LRCX / Lam Research Corporation | 0,01 | 212,79 | 0,63 | 319,21 | 2,7448 | 1,2847 | |||
| RSG / Republic Services, Inc. | 0,00 | 55,70 | 0,61 | 58,55 | 2,6573 | -1,0763 | |||
| MCK / McKesson Corporation | 0,00 | 104,76 | 0,60 | 123,13 | 2,5960 | 0,0019 | |||
| CASY / Casey's General Stores, Inc. | 0,00 | 110,81 | 0,59 | 148,73 | 2,5467 | 0,2573 | |||
| CEG / Constellation Energy Corporation | 0,00 | 409,23 | 0,55 | 723,88 | 2,3946 | 1,7401 | |||
| NDAQ / Nasdaq, Inc. | 0,01 | 163,90 | 0,55 | 211,43 | 2,3637 | 0,6708 | |||
| XOM / Exxon Mobil Corporation | 0,00 | 104,76 | 0,52 | 85,46 | 2,2713 | -0,4551 | |||
| TJX / The TJX Companies, Inc. | 0,00 | 147,99 | 0,49 | 151,55 | 2,1194 | 0,2415 | |||
| PANW / Palo Alto Networks, Inc. | 0,00 | 119,25 | 0,43 | 164,02 | 1,8794 | 0,2870 | |||
| LIN / Linde plc | 0,00 | 106,90 | 0,41 | 108,72 | 1,7679 | -0,1213 | |||
| PGR / The Progressive Corporation | 0,00 | 52,48 | 0,40 | 43,73 | 1,7415 | -0,9569 | |||
| MSI / Motorola Solutions, Inc. | 0,00 | 0,40 | 1,7375 | 1,7375 | |||||
| BRK.B / Berkshire Hathaway Inc. | 0,00 | 53,71 | 0,39 | 40,50 | 1,6998 | -1,0012 | |||
| EQIX / Equinix, Inc. | 0,00 | 93,94 | 0,36 | 89,36 | 1,5453 | -0,2742 | |||
| ETN / Eaton Corporation plc | 0,00 | 0,35 | 1,5077 | 1,5077 | |||||
| CRM / Salesforce, Inc. | 0,00 | 56,89 | 0,34 | 59,35 | 1,4804 | -0,5884 | |||
| COST / Costco Wholesale Corporation | 0,00 | 80,95 | 0,34 | 89,89 | 1,4680 | -0,2588 | |||
| PH / Parker-Hannifin Corporation | 0,00 | 87,70 | 0,33 | 115,69 | 1,4326 | -0,0472 | |||
| NVS / Novartis AG - Depositary Receipt (Common Stock) | 0,00 | 104,76 | 0,33 | 122,45 | 1,4215 | -0,0033 | |||
| NOW / ServiceNow, Inc. | 0,00 | 144,44 | 0,32 | 216,00 | 1,3730 | 0,4040 | |||
| TMUS / T-Mobile US, Inc. | 0,00 | 104,76 | 0,30 | 83,33 | 1,2883 | -0,2808 | |||
| PG / The Procter & Gamble Company | 0,00 | 7,58 | 0,29 | 0,69 | 1,2642 | -1,5362 | |||
| ABBV / AbbVie Inc. | 0,00 | 104,76 | 0,29 | 81,65 | 1,2459 | -0,2842 | |||
| NFLX / Netflix, Inc. | 0,00 | 226,98 | 0,28 | 374,14 | 1,1962 | 0,6286 | |||
| AWK / American Water Works Company, Inc. | 0,00 | 15,30 | 0,27 | 8,91 | 1,1684 | -1,2258 | |||
| SCI / Service Corporation International | 0,00 | 153,14 | 0,27 | 158,65 | 1,1669 | 0,1551 | |||
| HCA / HCA Healthcare, Inc. | 0,00 | 104,76 | 0,26 | 126,72 | 1,1429 | 0,0213 | |||
| LLY / Eli Lilly and Company | 0,00 | 60,48 | 0,26 | 51,45 | 1,1391 | -0,5364 | |||
| MPC / Marathon Petroleum Corporation | 0,00 | 151,40 | 0,25 | 188,64 | 1,1027 | 0,2456 | |||
| BA / The Boeing Company | 0,00 | 0,22 | 0,9694 | 0,9694 | |||||
| ORLY / O'Reilly Automotive, Inc. | 0,00 | 1 847,62 | 0,22 | 22,78 | 0,9591 | -0,7847 | |||
| DECK / Deckers Outdoor Corporation | 0,00 | 44,93 | 0,22 | 33,33 | 0,9385 | -0,6266 | |||
| TMO / Thermo Fisher Scientific Inc. | 0,00 | 88,28 | 0,21 | 54,07 | 0,9037 | -0,4086 | |||
| CHE / Chemed Corporation | 0,00 | 153,57 | 0,21 | 100,97 | 0,8995 | -0,0992 | |||
| CRH / CRH plc | 0,00 | 104,76 | 0,20 | 114,13 | 0,8558 | -0,0365 | |||
| EXR / Extra Space Storage Inc. | 0,00 | 0,18 | 0,7659 | 0,7659 | |||||
| TSLA / Tesla, Inc. | 0,00 | 0,16 | 0,6997 | 0,6997 | |||||
| GVMXX / State Street Institutional Investment Trust - State Street Institutional US Govt Money Market Fnd Premier Cls | 0,14 | 76,89 | 0,14 | 77,78 | 0,6261 | -0,1625 | |||
| CCJ / Cameco Corporation | 0,00 | 0,14 | 0,5974 | 0,5974 | |||||
| UNH / UnitedHealth Group Incorporated | 0,00 | 54,29 | 0,10 | -7,34 | 0,4383 | -0,6242 | |||
| PR / Permian Resources Corporation | 0,01 | -2,40 | 0,09 | -4,35 | 0,3837 | -0,5070 | |||
| PLD / Prologis, Inc. | 0,00 | -100,00 | 0,00 | -100,00 | -0,9298 | ||||
| FICO / Fair Isaac Corporation | 0,00 | -100,00 | 0,00 | -100,00 | -2,2447 |