Statistiques de base
| Valeur du portefeuille | $ 445 590 310 |
| Positions actuelles | 63 |
Dernières positions, performances, ASG (à partir des dépôts 13F, 13D)
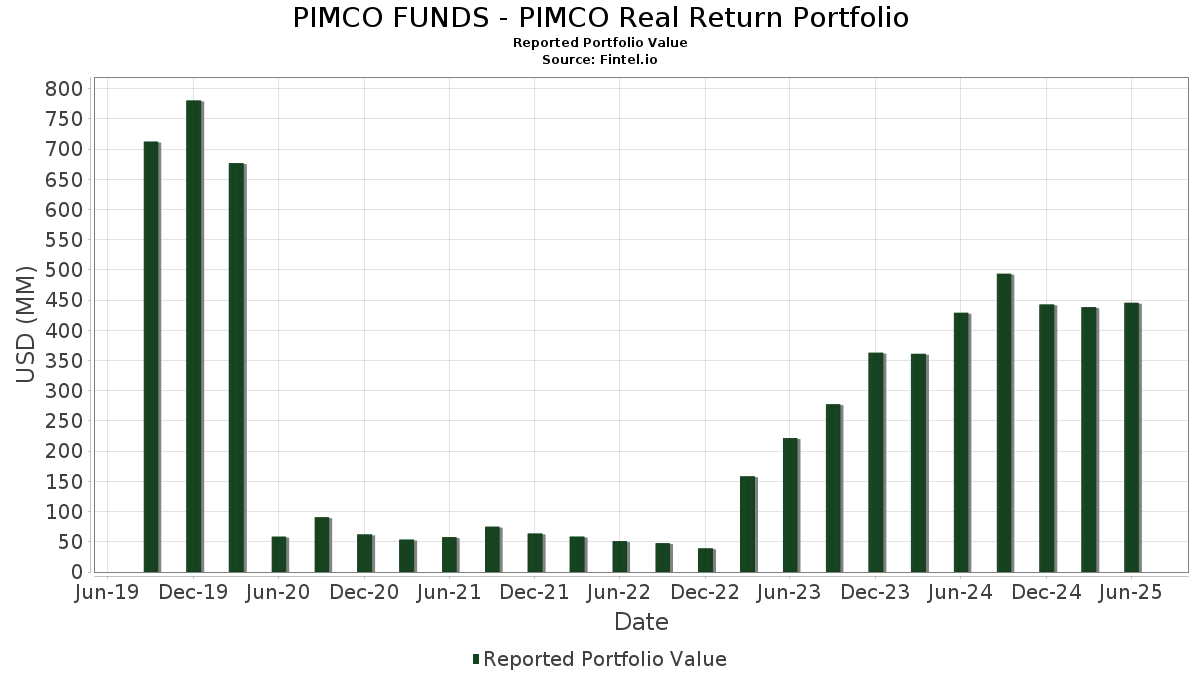
PIMCO FUNDS - PIMCO Real Return Portfolio a déclaré un total de 63 positions dans ses derniers dépôts auprès de la SEC. La valeur la plus récente du portefeuille est calculée à 445 590 310 USD. Les actifs sous gestion réels (ASG) sont cette valeur plus les liquidités (qui ne sont pas divulguées). Les principales positions de PIMCO FUNDS - PIMCO Real Return Portfolio sont United States Treasury Inflation Indexed Bonds (US:US912828S505) , United States Treasury Inflation Indexed Bonds (US:US9128282L36) , United States Treasury Inflation Indexed Bonds (US:US91282CCM10) , U.S. Treasury Inflation Linked Notes (US:US91282CEZ05) , and United States Treasury Inflation Indexed Bonds (US:US91282CBF77) . Les nouvelles positions de PIMCO FUNDS - PIMCO Real Return Portfolio incluent United States Treasury Inflation Indexed Bonds (US:US912828S505) , United States Treasury Inflation Indexed Bonds (US:US9128282L36) , United States Treasury Inflation Indexed Bonds (US:US91282CCM10) , U.S. Treasury Inflation Linked Notes (US:US91282CEZ05) , and United States Treasury Inflation Indexed Bonds (US:US91282CBF77) .
Meilleures augmentations ce trimestre
Nous utilisons la variation de l'allocation du portefeuille car il s'agit de l'indicateur le plus significatif. Les changements peuvent être dus à des transactions ou à des variations de prix des actions.
| Titre | Actions (en millions) |
Valeur ($ en millions) |
% du portefeuille | ΔPortefeuille % |
|---|---|---|---|---|
| 35,91 | 8,0312 | 2,0920 | ||
| 10,32 | 2,3084 | 1,1563 | ||
| 37,55 | 8,3966 | 0,3190 | ||
| 34,93 | 7,8116 | 0,3110 | ||
| 30,65 | 6,8552 | 0,3082 | ||
| 32,70 | 7,3130 | 0,2878 | ||
| 30,80 | 6,8886 | 0,2834 | ||
| 25,79 | 5,7667 | 0,2586 | ||
| 29,61 | 6,6207 | 0,2524 | ||
| 29,76 | 6,6550 | 0,2510 |
Principales baisses ce trimestre
Nous utilisons la variation de l'allocation du portefeuille car il s'agit de l'indicateur le plus significatif. Les changements peuvent être dus à des transactions ou à des variations de prix des actions.
| Titre | Actions (en millions) |
Valeur ($ en millions) |
% du portefeuille | ΔPortefeuille % |
|---|---|---|---|---|
| -260,52 | -58,2604 | -58,2604 | ||
| -79,96 | -17,8812 | -17,8812 | ||
| 7,86 | 1,7583 | -6,2837 | ||
| 3,43 | 0,7671 | -3,3317 | ||
| -4,30 | -0,9605 | -0,9605 | ||
| 27,74 | 6,2046 | -0,4764 | ||
| -2,07 | -0,4624 | -0,4624 | ||
| 28,93 | 6,4693 | -0,4078 | ||
| 6,21 | 1,3893 | -0,2993 | ||
| 11,27 | 2,5193 | -0,2405 |
Déclarations 13F et dépôts de fonds
Ce formulaire a été déposé le 2025-08-28 pour la période de déclaration 2025-06-30. Cet investisseur n'a pas divulgué les titres comptabilisés en actions, les colonnes relatives aux actions dans le tableau ci-dessous sont donc omises. Cliquez sur l'icône du lien pour voir l'historique complet des transactions.
Mettre à niveau pour débloquer les données premium et exporter vers Excel ![]() .
.
| Titre | Type | ΔActions (%) |
Valeur ($ en millions) |
Portefeuille (%) |
ΔPortefeuille (%) |
|
|---|---|---|---|---|---|---|
| US912828S505 / United States Treasury Inflation Indexed Bonds | 37,55 | 0,58 | 8,3966 | 0,3190 | ||
| TSY INFL IX N/B 01/34 1.75 / DBT (US91282CJY84) | 35,91 | 30,85 | 8,0312 | 2,0920 | ||
| US9128282L36 / United States Treasury Inflation Indexed Bonds | 34,93 | 0,78 | 7,8116 | 0,3110 | ||
| TSY INFL IX N/B 04/29 2.125 / DBT (US91282CKL45) | 32,70 | 0,72 | 7,3130 | 0,2878 | ||
| US91282CCM10 / United States Treasury Inflation Indexed Bonds | 31,58 | -5,39 | 7,0615 | -0,1604 | ||
| US91282CEZ05 / U.S. Treasury Inflation Linked Notes | 30,80 | 0,91 | 6,8886 | 0,2834 | ||
| US91282CBF77 / United States Treasury Inflation Indexed Bonds | 30,65 | 1,32 | 6,8552 | 0,3082 | ||
| US91282CHP95 / United States Treasury Inflation Indexed Bonds | 29,76 | 0,55 | 6,6550 | 0,2510 | ||
| US91282CFR79 / United States Treasury Inflation Indexed Bonds | 29,61 | 0,60 | 6,6207 | 0,2524 | ||
| US91282CGK18 / U.S. Treasury Inflation Linked Notes | 28,93 | -8,97 | 6,4693 | -0,4078 | ||
| US912828ZZ63 / United States Treasury Inflation Indexed Bonds | 27,74 | -10,14 | 6,2046 | -0,4764 | ||
| TSY INFL IX N/B 07/34 1.875 / DBT (US91282CLE92) | 27,54 | 0,17 | 6,1578 | 0,2092 | ||
| US91282CJH51 / US TREASURY I/L 2.375% 10-15-28 | 27,38 | 0,55 | 6,1231 | 0,2308 | ||
| US91282CGW55 / United States Treasury Inflation Indexed Bonds | 26,26 | 0,78 | 5,8732 | 0,2338 | ||
| US912828Z377 / United States Treasury Inflation Indexed Bonds | 25,79 | 1,30 | 5,7667 | 0,2586 | ||
| US9128285W63 / United States Treasury Inflation Indexed Bonds | 23,89 | 1,01 | 5,3431 | 0,2243 | ||
| US912828V491 / United States Treasury Inflation Indexed Bonds | 23,84 | 0,65 | 5,3313 | 0,2058 | ||
| US912828Y388 / United States Treasury Inflation Indexed Bonds | 23,61 | 0,95 | 5,2798 | 0,2188 | ||
| US9128283R96 / United States Treasury Inflation Indexed Bonds | 23,36 | 0,91 | 5,2237 | 0,2146 | ||
| US91282CDC29 / UNITED STATES TREASURY INFLATION INDEXED BONDS 0.12500000 | 18,08 | 0,63 | 4,0434 | 0,1554 | ||
| US91282CDX65 / United States Treasury Inflation Indexed Bonds | 17,46 | 1,14 | 3,9045 | 0,1690 | ||
| US91282CEJ62 / United States Treasury Inflation Indexed Bonds | 17,24 | 0,72 | 3,8560 | 0,1515 | ||
| US9128287D64 / United States Treasury Inflation Indexed Bonds | 16,98 | 1,25 | 3,7982 | 0,1684 | ||
| US912810RL44 / United States Treasury Inflation Indexed Bonds | 12,28 | -2,86 | 2,7469 | 0,0110 | ||
| US912810RF75 / United States Treasury Inflation Indexed Bonds | 11,27 | -11,67 | 2,5193 | -0,2405 | ||
| US912810PS15 / United States Treasury Inflation Indexed Bonds | 11,16 | 0,13 | 2,4958 | 0,0838 | ||
| TSY INFL IX N/B 01/35 2.125 / DBT (US91282CML27) | 10,65 | 0,03 | 2,3808 | 0,0776 | ||
| TSY INFL IX N/B 10/29 1.625 / DBT (US91282CLV18) | 10,32 | 93,88 | 2,3084 | 1,1563 | ||
| TSY INFL IX N/B 02/54 2.125 / DBT (US912810TY47) | 9,96 | -3,69 | 2,2265 | -0,0102 | ||
| US912810RR14 / United States Treasury Inflation Indexed Bonds | 9,41 | -3,01 | 2,1054 | 0,0051 | ||
| US912810PV44 / United States Treasury Inflation Indexed Bonds | 9,38 | 0,62 | 2,0980 | 0,0804 | ||
| US912810QV35 / United States Treasury Inflation Indexed Bonds | 8,63 | -13,46 | 1,9294 | -0,2280 | ||
| US91282CCA71 / United States Treasury Inflation Indexed Bonds | 7,86 | -78,85 | 1,7583 | -6,2837 | ||
| US912810TP30 / US TREASURY I/L 1.5% 02-15-53 | 7,27 | -13,99 | 1,6262 | -0,2032 | ||
| US912810RA88 / United States Treasury Inflation Indexed Bonds | 7,06 | -2,41 | 1,5783 | 0,0133 | ||
| US912810RW09 / United States Treasury Inflation Indexed Bonds | 6,87 | -3,33 | 1,5365 | -0,0015 | ||
| US912810SB52 / United States Treasury Inflation Indexed Bonds | 6,66 | -3,36 | 1,4905 | -0,0018 | ||
| US912810QP66 / United States Treasury Inflation Indexed Bonds | 6,21 | -20,39 | 1,3893 | -0,2993 | ||
| US912810FD55 / Usa Treasury Bonds 3 5/8% Tii 30yr Bd 4/15/28 | 5,82 | 0,19 | 1,3019 | 0,0446 | ||
| US912810SM18 / US TII .25 02/15/2050 (TIPS) | 5,06 | -3,93 | 1,1324 | -0,0082 | ||
| US912810SG40 / United States Treasury Inflation Indexed Bonds | 4,91 | -3,71 | 1,0973 | -0,0054 | ||
| US912810TE82 / United States Treasury Inflation Indexed Bonds | 4,13 | -4,80 | 0,9228 | -0,0152 | ||
| US912810SV17 / United States Treasury Inflation Indexed Bonds | 4,05 | -4,37 | 0,9059 | -0,0106 | ||
| US912810FH69 / Usa Treasury Notes 3 7/8% 30yr Notes 04/15/2029 | 3,85 | 0,34 | 0,8610 | 0,0307 | ||
| US72201W1541 / PIMCO PRV SHORT TERM FLT III MUTUAL FUND | 3,43 | -81,89 | 0,7671 | -3,3317 | ||
| US912810QF84 / United States Treasury Inflation Indexed Bonds | 2,20 | -1,35 | 0,4918 | 0,0093 | ||
| TSY INFL IX N/B 02/55 2.375 / DBT (US912810UH94) | 2,07 | -3,55 | 0,4619 | -0,0014 | ||
| US 10YR ULTRA FUT SEP25 XCBT 20250919 / DIR (000000000) | 0,25 | 0,0554 | 0,0554 | |||
| US 5YR NOTE (CBT) SEP25 XCBT 20250930 / DIR (000000000) | 0,18 | 0,0402 | 0,0402 | |||
| US59020UWU59 / MLCC MORTGAGE INVESTORS INC MLCC 2005 B A1 | 0,12 | -4,10 | 0,0264 | -0,0001 | ||
| US16678RAS67 / Chevy Chase Funding LLC Mortgage-Backed Certificates Series 2004-1 | 0,02 | 0,00 | 0,0050 | 0,0000 | ||
| INF SWAP US IT 3.3 06/04/2025-1Y LCH / DIR (EZ4T3WJXC5V3) | 0,00 | 0,0011 | 0,0011 | |||
| BOUGHT EUR SOLD USD 20250702 / DFE (000000000) | 0,00 | 0,0004 | 0,0004 | |||
| SOLD EUR BOUGHT USD 20250804 / DFE (000000000) | -0,00 | -0,0004 | -0,0004 | |||
| SOLD EUR BOUGHT USD 20250702 / DFE (000000000) | -0,00 | -0,0008 | -0,0008 | |||
| INF SWAP US IT 2.38 10/15/24-1Y LCH / DIR (000000000) | -0,00 | -0,0009 | -0,0009 | |||
| INF SWAP US IT 2.70 01/14/25-1Y LCH / DIR (000000000) | -0,02 | -0,0036 | -0,0036 | |||
| US 2YR NOTE (CBT) SEP25 XCBT 20250930 / DIR (000000000) | -0,03 | -0,0070 | -0,0070 | |||
| US ULTRA BOND CBT SEP25 XCBT 20250919 / DIR (000000000) | -0,19 | -0,0420 | -0,0420 | |||
| REVERSE REPO BANK OF AMERICA REVERSE REPO / RA (000000000) | -2,07 | -0,4624 | -0,4624 | |||
| REVERSE REPO JPM CHASE / RA (000000000) | -4,30 | -0,9605 | -0,9605 | |||
| REVERSE REPO THE BANK OF NOVA REVERSE REPO / RA (000000000) | -79,96 | -17,8812 | -17,8812 | |||
| REVERSE REPO BANK OF MONTREAL REVERSE REPO / RA (000000000) | -260,52 | -58,2604 | -58,2604 |