Statistiques de base
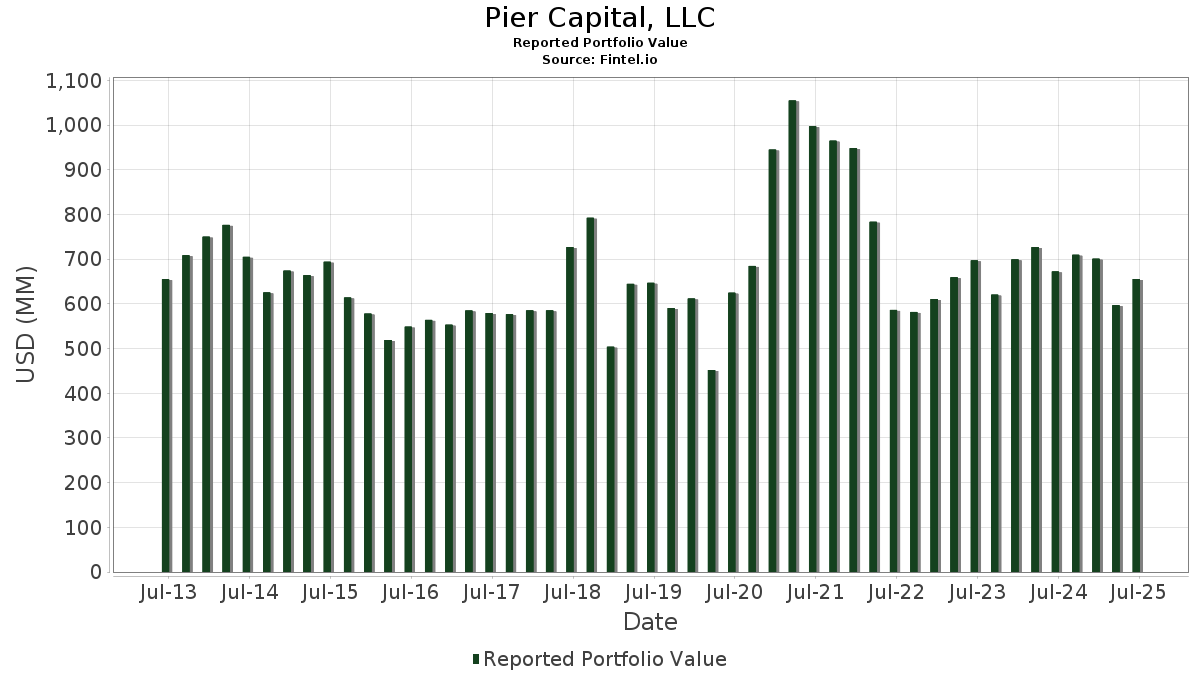
| Valeur du portefeuille | $ 655 504 158 |
| Positions actuelles | 121 |
Dernières positions, performances, ASG (à partir des dépôts 13F, 13D)
Pier Capital, LLC a déclaré un total de 121 positions dans ses derniers dépôts auprès de la SEC. La valeur la plus récente du portefeuille est calculée à 655 504 158 USD. Les actifs sous gestion réels (ASG) sont cette valeur plus les liquidités (qui ne sont pas divulguées). Les principales positions de Pier Capital, LLC sont Mirion Technologies, Inc. (US:MIR) , e.l.f. Beauty, Inc. (US:ELF) , JFrog Ltd. (US:FROG) , Sterling Infrastructure, Inc. (US:STRL) , and Adaptive Biotechnologies Corporation (US:ADPT) . Les nouvelles positions de Pier Capital, LLC incluent Establishment Labs Holdings Inc. (US:ESTA) , Certara, Inc. (US:CERT) , Perella Weinberg Partners (US:PWP) , GRAIL, LLC (US:GRAL.V) , and Oddity Tech Ltd. (US:ODD) .
Meilleures augmentations ce trimestre
Nous utilisons la variation de l'allocation du portefeuille car il s'agit de l'indicateur le plus significatif. Les changements peuvent être dus à des transactions ou à des variations de prix des actions.
| Titre | Actions (en millions) |
Valeur ($ en millions) |
% du portefeuille | ΔPortefeuille % |
|---|---|---|---|---|
| 0,25 | 10,78 | 1,6440 | 1,6440 | |
| 0,29 | 8,10 | 1,2363 | 1,2363 | |
| 0,05 | 11,88 | 1,8125 | 1,1953 | |
| 0,67 | 7,81 | 1,1913 | 1,1913 | |
| 0,39 | 7,65 | 1,1676 | 1,1676 | |
| 0,12 | 14,58 | 2,2235 | 0,9286 | |
| 0,11 | 5,54 | 0,8448 | 0,8448 | |
| 0,10 | 5,51 | 0,8404 | 0,8404 | |
| 0,08 | 5,29 | 0,8070 | 0,8070 | |
| 0,07 | 5,20 | 0,7939 | 0,7939 |
Principales baisses ce trimestre
Nous utilisons la variation de l'allocation du portefeuille car il s'agit de l'indicateur le plus significatif. Les changements peuvent être dus à des transactions ou à des variations de prix des actions.
| Titre | Actions (en millions) |
Valeur ($ en millions) |
% du portefeuille | ΔPortefeuille % |
|---|---|---|---|---|
| 0,00 | 0,01 | 0,0009 | -0,8815 | |
| 0,03 | 5,01 | 0,7636 | -0,8753 | |
| 0,00 | 0,01 | 0,0009 | -0,7036 | |
| 0,06 | 2,02 | 0,3085 | -0,6881 | |
| 0,02 | 3,97 | 0,6061 | -0,5294 | |
| 0,06 | 8,30 | 1,2656 | -0,5189 | |
| 0,03 | 6,97 | 1,0626 | -0,5179 | |
| 0,07 | 7,57 | 1,1550 | -0,4865 | |
| 0,11 | 6,72 | 1,0257 | -0,4789 | |
| 0,25 | 8,49 | 1,2946 | -0,4636 |
Déclarations 13F et dépôts de fonds
Ce formulaire a été déposé le 2025-08-05 pour la période de déclaration 2025-06-30. Cliquez sur l'icône du lien pour voir l'historique complet des transactions.
Mettre à niveau pour débloquer les données premium et exporter vers Excel ![]() .
.
| Titre | Type | Prix moyen de l'action | Actions (en millions) |
ΔActions (%) |
ΔActions (%) |
Valeur ($ en millions) |
Portefeuille (%) |
ΔPortefeuille (%) |
|
|---|---|---|---|---|---|---|---|---|---|
| MIR / Mirion Technologies, Inc. | 0,87 | -7,48 | 18,75 | 37,37 | 2,8609 | 0,5735 | |||
| ELF / e.l.f. Beauty, Inc. | 0,12 | -4,84 | 14,58 | 88,60 | 2,2235 | 0,9286 | |||
| FROG / JFrog Ltd. | 0,29 | -16,20 | 12,66 | 14,92 | 1,9307 | 0,0854 | |||
| STRL / Sterling Infrastructure, Inc. | 0,05 | 58,26 | 11,88 | 222,59 | 1,8125 | 1,1953 | |||
| ADPT / Adaptive Biotechnologies Corporation | 1,02 | -7,34 | 11,85 | 45,30 | 1,8073 | 0,4411 | |||
| CFLT / Confluent, Inc. | 0,46 | 50,62 | 11,58 | 60,20 | 1,7672 | 0,5556 | |||
| ATGE / Adtalem Global Education Inc. | 0,09 | -7,57 | 11,57 | 16,86 | 1,7651 | 0,1061 | |||
| FN / Fabrinet | 0,04 | -5,34 | 11,07 | 41,23 | 1,6886 | 0,3753 | |||
| ESTA / Establishment Labs Holdings Inc. | 0,25 | 10,78 | 1,6440 | 1,6440 | |||||
| IBP / Installed Building Products, Inc. | 0,06 | 25,95 | 9,96 | 32,46 | 1,5197 | 0,2596 | |||
| SBCF / Seacoast Banking Corporation of Florida | 0,35 | -6,41 | 9,71 | 0,47 | 1,4817 | -0,1382 | |||
| HXL / Hexcel Corporation | 0,17 | 25,58 | 9,58 | 29,56 | 1,4611 | 0,2223 | |||
| SIBN / SI-BONE, Inc. | 0,50 | 7,17 | 9,37 | 43,76 | 1,4299 | 0,3374 | |||
| IPAR / Interparfums, Inc. | 0,07 | -4,79 | 9,36 | 9,79 | 1,4276 | -0,0006 | |||
| MC / Moelis & Company | 0,15 | -4,82 | 9,35 | 1,63 | 1,4268 | -0,1151 | |||
| QTWO / Q2 Holdings, Inc. | 0,10 | -4,74 | 9,12 | 11,44 | 1,3913 | 0,0200 | |||
| MSA / MSA Safety Incorporated | 0,05 | -7,41 | 9,08 | 5,74 | 1,3851 | -0,0536 | |||
| GBCI / Glacier Bancorp, Inc. | 0,21 | -6,80 | 9,06 | -9,20 | 1,3822 | -0,2897 | |||
| BWXT / BWX Technologies, Inc. | 0,06 | -5,65 | 9,02 | 37,79 | 1,3756 | 0,2791 | |||
| ALGM / Allegro MicroSystems, Inc. | 0,26 | -7,94 | 8,96 | 25,25 | 1,3673 | 0,1683 | |||
| SITM / SiTime Corporation | 0,04 | -4,37 | 8,92 | 33,29 | 1,3614 | 0,2396 | |||
| WSC / WillScot Holdings Corporation | 0,32 | -7,30 | 8,88 | -8,63 | 1,3550 | -0,2738 | |||
| OSW / OneSpaWorld Holdings Limited | 0,43 | -17,43 | 8,87 | 0,27 | 1,3527 | -0,1289 | |||
| STVN / Stevanato Group S.p.A. | 0,35 | -6,53 | 8,60 | 11,82 | 1,3116 | 0,0234 | |||
| FVRR / Fiverr International Ltd. | 0,29 | -23,49 | 8,49 | -5,25 | 1,2953 | -0,2060 | |||
| UTI / Universal Technical Institute, Inc. | 0,25 | -38,72 | 8,49 | -19,13 | 1,2946 | -0,4636 | |||
| BL / BlackLine, Inc. | 0,15 | -1,38 | 8,43 | 15,32 | 1,2865 | 0,0612 | |||
| GTLB / GitLab Inc. | 0,18 | 36,88 | 8,34 | 31,38 | 1,2722 | 0,2086 | |||
| GOOS / Canada Goose Holdings Inc. | 0,74 | -7,24 | 8,30 | 30,57 | 1,2669 | 0,2012 | |||
| OLLI / Ollie's Bargain Outlet Holdings, Inc. | 0,06 | -31,22 | 8,30 | -22,10 | 1,2656 | -0,5189 | |||
| VERX / Vertex, Inc. | 0,23 | -6,90 | 8,18 | -6,04 | 1,2486 | -0,2108 | |||
| NCNO / nCino, Inc. | 0,29 | 8,10 | 1,2363 | 1,2363 | |||||
| CERT / Certara, Inc. | 0,67 | 7,81 | 1,1913 | 1,1913 | |||||
| LNN / Lindsay Corporation | 0,05 | -6,73 | 7,73 | 6,34 | 1,1794 | -0,0387 | |||
| PTLO / Portillo's Inc. | 0,66 | 153,10 | 7,73 | 148,44 | 1,1792 | 0,6578 | |||
| PWP / Perella Weinberg Partners | 0,39 | 7,65 | 1,1676 | 1,1676 | |||||
| FLS / Flowserve Corporation | 0,14 | -22,49 | 7,59 | -16,93 | 1,1576 | -0,3728 | |||
| LSCC / Lattice Semiconductor Corporation | 0,15 | -7,36 | 7,58 | -13,47 | 1,1565 | -0,3114 | |||
| PNFP / Pinnacle Financial Partners, Inc. | 0,07 | -25,77 | 7,57 | -22,71 | 1,1550 | -0,4865 | |||
| ONTO / Onto Innovation Inc. | 0,07 | 40,97 | 7,46 | 17,25 | 1,1379 | 0,0720 | |||
| FRSH / Freshworks Inc. | 0,50 | -6,84 | 7,43 | -1,55 | 1,1329 | -0,1311 | |||
| FOUR / Shift4 Payments, Inc. | 0,07 | -6,98 | 7,34 | 12,84 | 1,1196 | 0,0297 | |||
| RGEN / Repligen Corporation | 0,06 | -7,37 | 7,34 | -9,44 | 1,1191 | -0,2383 | |||
| VRNS / Varonis Systems, Inc. | 0,14 | -29,94 | 7,23 | -12,11 | 1,1034 | -0,2754 | |||
| ACVA / ACV Auctions Inc. | 0,44 | -32,70 | 7,18 | -22,54 | 1,0955 | -0,4576 | |||
| PRVA / Privia Health Group, Inc. | 0,31 | -24,24 | 7,18 | -22,39 | 1,0947 | -0,4543 | |||
| RDNT / RadNet, Inc. | 0,13 | -22,87 | 7,17 | -11,72 | 1,0944 | -0,2671 | |||
| ADUS / Addus HomeCare Corporation | 0,06 | -7,29 | 7,01 | 7,99 | 1,0698 | -0,0182 | |||
| BILL / BILL Holdings, Inc. | 0,15 | -6,97 | 7,01 | -6,22 | 1,0696 | -0,1831 | |||
| AIT / Applied Industrial Technologies, Inc. | 0,03 | -28,42 | 6,97 | -26,16 | 1,0626 | -0,5179 | |||
| ANGO / AngioDynamics, Inc. | 0,69 | 40,54 | 6,89 | 48,47 | 1,0506 | 0,2734 | |||
| PCOR / Procore Technologies, Inc. | 0,10 | -7,40 | 6,85 | -4,05 | 1,0456 | -0,1512 | |||
| SKY / Champion Homes, Inc. | 0,11 | 13,32 | 6,72 | -25,13 | 1,0257 | -0,4789 | |||
| HRI / Herc Holdings Inc. | 0,05 | -7,21 | 6,46 | -8,99 | 0,9852 | -0,2039 | |||
| CWAN / Clearwater Analytics Holdings, Inc. | 0,29 | -4,81 | 6,33 | -22,12 | 0,9664 | -0,3963 | |||
| BOOT / Boot Barn Holdings, Inc. | 0,04 | -0,30 | 6,01 | 41,08 | 0,9165 | 0,2029 | |||
| ARDT / Ardent Health, Inc. | 0,43 | -6,83 | 5,94 | -7,45 | 0,9063 | -0,1692 | |||
| IMAX / IMAX Corporation | 0,21 | -7,46 | 5,81 | -1,81 | 0,8858 | -0,1050 | |||
| POWL / Powell Industries, Inc. | 0,03 | 8,11 | 5,72 | 33,58 | 0,8721 | 0,1550 | |||
| GRAL.V / GRAIL, LLC | 0,11 | 5,54 | 0,8448 | 0,8448 | |||||
| CCS / Century Communities, Inc. | 0,10 | 5,51 | 0,8404 | 0,8404 | |||||
| MMS / Maximus, Inc. | 0,08 | 5,29 | 0,8070 | 0,8070 | |||||
| AEHR / Aehr Test Systems, Inc. | 0,41 | 15,96 | 5,25 | 105,64 | 0,8007 | 0,3731 | |||
| ODD / Oddity Tech Ltd. | 0,07 | 5,20 | 0,7939 | 0,7939 | |||||
| OMCL / Omnicell, Inc. | 0,18 | 81,32 | 5,20 | 52,48 | 0,7935 | 0,2219 | |||
| ETOR / eToro Group Ltd. | 0,08 | 5,18 | 0,7898 | 0,7898 | |||||
| BE / Bloom Energy Corporation | 0,21 | -36,92 | 5,02 | -23,24 | 0,7658 | -0,3301 | |||
| HLI / Houlihan Lokey, Inc. | 0,03 | -54,07 | 5,01 | -48,82 | 0,7636 | -0,8753 | |||
| SXT / Sensient Technologies Corporation | 0,05 | 4,92 | 0,7499 | 0,7499 | |||||
| CDXS / Codexis, Inc. | 1,92 | 14,73 | 4,67 | 4,05 | 0,7129 | -0,0395 | |||
| FRPT / Freshpet, Inc. | 0,07 | 4,48 | 0,6839 | 0,6839 | |||||
| ROIV / Roivant Sciences Ltd. | 0,40 | -7,44 | 4,47 | 3,40 | 0,6814 | -0,0425 | |||
| DNLI / Denali Therapeutics Inc. | 0,31 | -6,17 | 4,40 | -3,46 | 0,6718 | -0,0924 | |||
| WNS / WNS (Holdings) Limited | 0,07 | 10,37 | 4,40 | 13,53 | 0,6710 | 0,0218 | |||
| ACLX / Arcellx, Inc. | 0,06 | -6,39 | 4,19 | -6,03 | 0,6392 | -0,1079 | |||
| GPCR / Structure Therapeutics Inc. - Depositary Receipt (Common Stock) | 0,20 | -6,61 | 4,12 | 11,91 | 0,6280 | 0,0116 | |||
| CRNX / Crinetics Pharmaceuticals, Inc. | 0,14 | 25,75 | 4,10 | 7,84 | 0,6257 | -0,0117 | |||
| SAIA / Saia, Inc. | 0,01 | 4,06 | 0,6194 | 0,6194 | |||||
| GTLS / Chart Industries, Inc. | 0,02 | -48,60 | 3,97 | -41,38 | 0,6061 | -0,5294 | |||
| AVXL / Anavex Life Sciences Corp. | 0,42 | -6,87 | 3,91 | 0,08 | 0,5966 | -0,0581 | |||
| SGRY / Surgery Partners, Inc. | 0,17 | 22 334,96 | 3,88 | 21 455,56 | 0,5919 | 0,5888 | |||
| GH / Guardant Health, Inc. | 0,07 | -41,12 | 3,77 | -28,07 | 0,5748 | -0,3029 | |||
| CORZ / Core Scientific, Inc. | 0,22 | 3,73 | 0,5691 | 0,5691 | |||||
| CAPR / Capricor Therapeutics, Inc. | 0,37 | 3,82 | 3,65 | 8,63 | 0,5570 | -0,0061 | |||
| XMTR / Xometry, Inc. | 0,11 | 3,60 | 0,5491 | 0,5491 | |||||
| LNTH / Lantheus Holdings, Inc. | 0,04 | -13,25 | 3,59 | -27,23 | 0,5483 | -0,2794 | |||
| OLMA / Olema Pharmaceuticals, Inc. | 0,77 | -5,73 | 3,28 | 6,80 | 0,5011 | -0,0142 | |||
| CECO / CECO Environmental Corp. | 0,11 | 3,23 | 0,4921 | 0,4921 | |||||
| TLX / Telix Pharmaceuticals Limited - Depositary Receipt (Common Stock) | 0,19 | 3,04 | 0,4633 | 0,4633 | |||||
| TREX / Trex Company, Inc. | 0,06 | -4,97 | 3,00 | -11,07 | 0,4572 | -0,1074 | |||
| KGS / Kodiak Gas Services, Inc. | 0,06 | -63,00 | 2,02 | -66,00 | 0,3085 | -0,6881 | |||
| TW / Tradeweb Markets Inc. | 0,01 | -3,93 | 1,24 | -5,28 | 0,1889 | -0,0301 | |||
| FIX / Comfort Systems USA, Inc. | 0,00 | -2,56 | 1,14 | 62,13 | 0,1744 | 0,0562 | |||
| PINS / Pinterest, Inc. | 0,03 | -2,71 | 1,13 | 12,61 | 0,1730 | 0,0042 | |||
| EVR / Evercore Inc. | 0,00 | -2,33 | 1,00 | 32,14 | 0,1518 | 0,0255 | |||
| TXRH / Texas Roadhouse, Inc. | 0,01 | -2,51 | 0,98 | 9,66 | 0,1489 | -0,0002 | |||
| LNG / Cheniere Energy, Inc. | 0,00 | -2,30 | 0,97 | 2,75 | 0,1484 | -0,0101 | |||
| MDB / MongoDB, Inc. | 0,00 | -2,29 | 0,94 | 17,08 | 0,1433 | 0,0087 | |||
| DT / Dynatrace, Inc. | 0,02 | -2,31 | 0,90 | 14,39 | 0,1371 | 0,0055 | |||
| CYBR / CyberArk Software Ltd. | 0,00 | -4,03 | 0,62 | 15,49 | 0,0945 | 0,0047 | |||
| AXON / Axon Enterprise, Inc. | 0,00 | -5,71 | 0,56 | 48,54 | 0,0855 | 0,0222 | |||
| MSCI / MSCI Inc. | 0,00 | -1,14 | 0,50 | 0,80 | 0,0765 | -0,0068 | |||
| MPWR / Monolithic Power Systems, Inc. | 0,00 | -4,46 | 0,42 | 20,57 | 0,0645 | 0,0057 | |||
| PEN / Penumbra, Inc. | 0,00 | 0,39 | 0,0601 | 0,0601 | |||||
| WST / West Pharmaceutical Services, Inc. | 0,00 | -98,18 | 0,01 | -98,35 | 0,0018 | -0,1097 | |||
| PGNY / Progyny, Inc. | 0,00 | 0,00 | 0,01 | 0,00 | 0,0017 | -0,0002 | |||
| ULTA / Ulta Beauty, Inc. | 0,00 | 0,00 | 0,01 | 37,50 | 0,0017 | 0,0002 | |||
| FTI / TechnipFMC plc | 0,00 | 0,00 | 0,01 | 10,00 | 0,0017 | -0,0000 | |||
| WMS / Advanced Drainage Systems, Inc. | 0,00 | 0,00 | 0,01 | 14,29 | 0,0013 | -0,0000 | |||
| IEX / IDEX Corporation | 0,00 | 0,00 | 0,01 | -12,50 | 0,0012 | -0,0002 | |||
| DXCM / DexCom, Inc. | 0,00 | 0,00 | 0,01 | 16,67 | 0,0012 | 0,0002 | |||
| BLD / TopBuild Corp. | 0,00 | 0,00 | 0,01 | 0,00 | 0,0012 | -0,0000 | |||
| ENTG / Entegris, Inc. | 0,00 | 0,00 | 0,01 | -14,29 | 0,0010 | -0,0002 | |||
| IQV / IQVIA Holdings Inc. | 0,00 | 0,00 | 0,01 | -14,29 | 0,0010 | -0,0002 | |||
| IDXX / IDEXX Laboratories, Inc. | 0,00 | 0,00 | 0,01 | 20,00 | 0,0010 | 0,0001 | |||
| ESTC / Elastic N.V. | 0,00 | 0,00 | 0,01 | 0,00 | 0,0010 | -0,0002 | |||
| SG / Sweetgreen, Inc. | 0,00 | -99,76 | 0,01 | -99,88 | 0,0009 | -0,7036 | |||
| FIVN / Five9, Inc. | 0,00 | -99,77 | 0,01 | -99,81 | 0,0009 | -0,4430 | |||
| GLOB / Globant S.A. | 0,00 | -99,86 | 0,01 | -99,91 | 0,0009 | -0,8815 | |||
| VIK / Viking Holdings Ltd | 0,00 | 0,00 | 0,00 | 33,33 | 0,0007 | 0,0001 | |||
| FIVE / Five Below, Inc. | 0,00 | 0,00 | 0,00 | 100,00 | 0,0007 | 0,0002 | |||
| SKX / Skechers U.S.A., Inc. | 0,00 | -100,00 | 0,00 | 0,0000 | |||||
| EXPO / Exponent, Inc. | 0,00 | -100,00 | 0,00 | 0,0000 | |||||
| QTRX / Quanterix Corporation | 0,00 | -100,00 | 0,00 | 0,0000 | |||||
| LEVI / Levi Strauss & Co. | 0,00 | -100,00 | 0,00 | 0,0000 | |||||
| AMN / AMN Healthcare Services, Inc. | 0,00 | -100,00 | 0,00 | 0,0000 | |||||
| EXLS / ExlService Holdings, Inc. | 0,00 | -100,00 | 0,00 | 0,0000 | |||||
| NXT / Nextracker Inc. | 0,00 | -100,00 | 0,00 | 0,0000 | |||||
| BECN / Beacon Roofing Supply, Inc. | 0,00 | -100,00 | 0,00 | 0,0000 | |||||
| VEEV / Veeva Systems Inc. | 0,00 | -100,00 | 0,00 | 0,0000 | |||||
| BROS / Dutch Bros Inc. | 0,00 | -100,00 | 0,00 | 0,0000 | |||||
| CART / Maplebear Inc. | 0,00 | -100,00 | 0,00 | 0,0000 | |||||
| COCO / The Vita Coco Company, Inc. | 0,00 | -100,00 | 0,00 | 0,0000 |