Statistiques de base
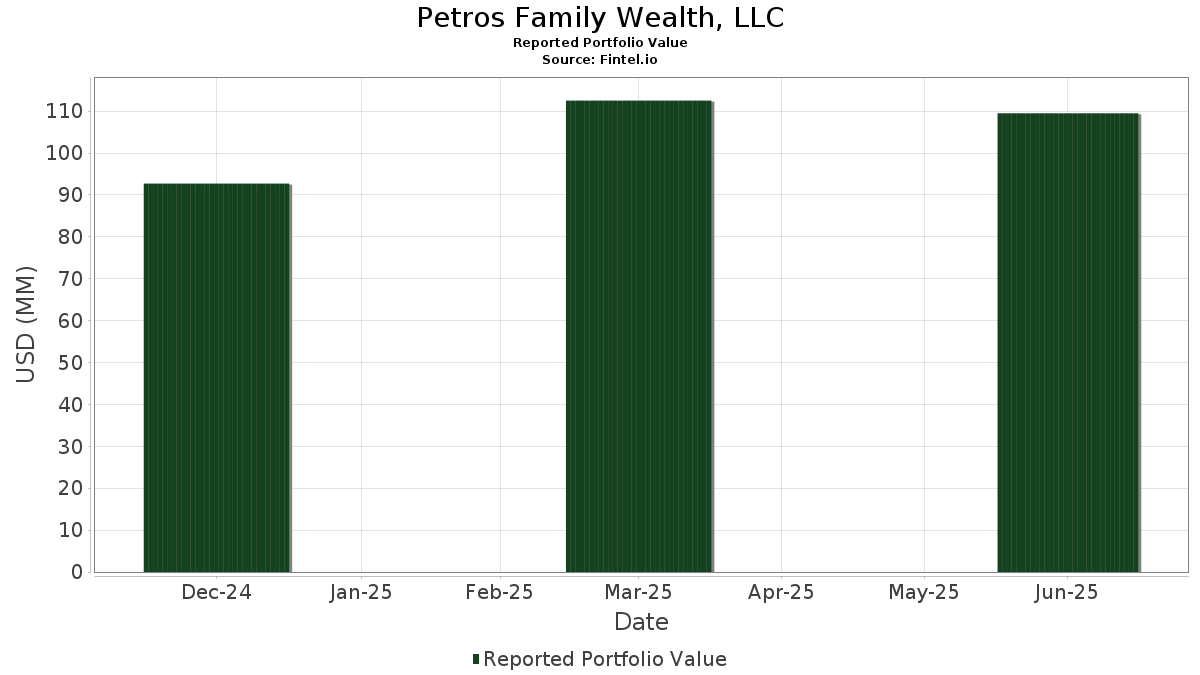
| Valeur du portefeuille | $ 109 486 993 |
| Positions actuelles | 132 |
Dernières positions, performances, ASG (à partir des dépôts 13F, 13D)
Petros Family Wealth, LLC a déclaré un total de 132 positions dans ses derniers dépôts auprès de la SEC. La valeur la plus récente du portefeuille est calculée à 109 486 993 USD. Les actifs sous gestion réels (ASG) sont cette valeur plus les liquidités (qui ne sont pas divulguées). Les principales positions de Petros Family Wealth, LLC sont SPDR S&P 500 ETF (US:SPY) , American Century ETF Trust - American Century U.S. Quality Growth ETF (US:QGRO) , Apple Inc. (US:AAPL) , Microsoft Corporation (US:MSFT) , and American Century ETF Trust - Avantis International Equity ETF (US:AVDE) . Les nouvelles positions de Petros Family Wealth, LLC incluent American Century ETF Trust - Avantis International Equity ETF (US:AVDE) , American Century ETF Trust - Avantis Emerging Markets Equity ETF (US:AVEM) , Harbor ETF Trust - Harbor Small Cap Earners ETF (US:EBIT) , Robinhood Markets, Inc. (US:HOOD) , and General Electric Company (US:GE) .
Meilleures augmentations ce trimestre
Nous utilisons la variation de l'allocation du portefeuille car il s'agit de l'indicateur le plus significatif. Les changements peuvent être dus à des transactions ou à des variations de prix des actions.
| Titre | Actions (en millions) |
Valeur ($ en millions) |
% du portefeuille | ΔPortefeuille % |
|---|---|---|---|---|
| 0,05 | 3,58 | 3,2731 | 3,2731 | |
| 0,02 | 1,28 | 1,1728 | 1,1728 | |
| 0,01 | 4,48 | 4,0894 | 1,1342 | |
| 0,04 | 1,15 | 1,0518 | 1,0518 | |
| 0,04 | 4,72 | 3,5342 | 0,7644 | |
| 0,02 | 3,15 | 2,3597 | 0,5656 | |
| 0,01 | 0,56 | 0,5139 | 0,5139 | |
| 0,00 | 0,54 | 0,4045 | 0,4045 | |
| 0,01 | 0,37 | 0,3347 | 0,3347 | |
| 0,00 | 0,62 | 0,5700 | 0,3273 |
Principales baisses ce trimestre
Nous utilisons la variation de l'allocation du portefeuille car il s'agit de l'indicateur le plus significatif. Les changements peuvent être dus à des transactions ou à des variations de prix des actions.
| Titre | Actions (en millions) |
Valeur ($ en millions) |
% du portefeuille | ΔPortefeuille % |
|---|---|---|---|---|
| 0,01 | 2,64 | 2,4142 | -1,4322 | |
| 0,00 | 0,90 | 0,8247 | -0,3442 | |
| 0,00 | 1,46 | 1,0928 | -0,3269 | |
| 0,02 | 4,59 | 4,1952 | -0,2678 | |
| 0,00 | 0,52 | 0,4742 | -0,2359 | |
| 0,03 | 0,64 | 0,4791 | -0,1782 | |
| 0,01 | 1,00 | 0,7504 | -0,1739 | |
| 0,00 | 0,73 | 0,5455 | -0,1642 | |
| 0,00 | 0,56 | 0,4179 | -0,1589 | |
| 0,00 | 0,78 | 0,5820 | -0,1582 |
Déclarations 13F et dépôts de fonds
Ce formulaire a été déposé le 2025-07-22 pour la période de déclaration 2025-06-30. Cliquez sur l'icône du lien pour voir l'historique complet des transactions.
Mettre à niveau pour débloquer les données premium et exporter vers Excel ![]() .
.
| Titre | Type | Prix moyen de l'action | Actions (en millions) |
ΔActions (%) |
ΔActions (%) |
Valeur ($ en millions) |
Portefeuille (%) |
ΔPortefeuille (%) |
|
|---|---|---|---|---|---|---|---|---|---|
| SPY / SPDR S&P 500 ETF | 0,01 | 12,34 | 6,95 | 24,07 | 5,2043 | 0,2233 | |||
| QGRO / American Century ETF Trust - American Century U.S. Quality Growth ETF | 0,04 | 30,07 | 4,72 | 51,54 | 3,5342 | 0,7644 | |||
| AAPL / Apple Inc. | 0,02 | -0,97 | 4,59 | -8,52 | 4,1952 | -0,2678 | |||
| MSFT / Microsoft Corporation | 0,01 | 1,61 | 4,48 | 34,65 | 4,0894 | 1,1342 | |||
| AVDE / American Century ETF Trust - Avantis International Equity ETF | 0,05 | 3,58 | 3,2731 | 3,2731 | |||||
| NVDD / Direxion Shares ETF Trust - Direxion Daily NVDA Bear 1X Shares | 0,02 | 7,14 | 3,15 | 56,19 | 2,3597 | 0,5656 | |||
| UNH / UnitedHealth Group Incorporated | 0,01 | 2,54 | 2,64 | -38,92 | 2,4142 | -1,4322 | |||
| GOOGL / Alphabet Inc. | 0,01 | 0,87 | 2,63 | 14,52 | 1,9656 | -0,0725 | |||
| IJH / iShares Trust - iShares Core S&P Mid-Cap ETF | 0,04 | 7,68 | 2,54 | 14,45 | 1,8975 | -0,0712 | |||
| COWZ / Pacer Funds Trust - Pacer US Cash Cows 100 ETF | 0,04 | 10,15 | 2,32 | 10,82 | 1,7398 | -0,1241 | |||
| CSCO / Cisco Systems, Inc. | 0,03 | -2,10 | 2,04 | 10,10 | 1,5254 | -0,1203 | |||
| AMZN / Amazon.com, Inc. | 0,01 | 25,10 | 2,01 | 44,22 | 1,5042 | 0,2660 | |||
| BLK / BlackRock, Inc. | 0,00 | 4,29 | 1,89 | 15,62 | 1,4136 | -0,0383 | |||
| KLAC / KLA Corporation | 0,00 | 14,85 | 1,86 | 51,42 | 1,3951 | 0,3004 | |||
| SYK / Stryker Corporation | 0,00 | 3,82 | 1,79 | 10,33 | 1,6390 | 0,1937 | |||
| JPM / JPMorgan Chase & Co. | 0,01 | 5,37 | 1,67 | 24,57 | 1,2524 | 0,0581 | |||
| IWM / iShares Trust - iShares Russell 2000 ETF | 0,01 | 7,26 | 1,65 | 16,02 | 1,2362 | -0,0291 | |||
| COST / Costco Wholesale Corporation | 0,00 | -12,67 | 1,46 | -8,58 | 1,0928 | -0,3269 | |||
| AVEM / American Century ETF Trust - Avantis Emerging Markets Equity ETF | 0,02 | 1,28 | 1,1728 | 1,1728 | |||||
| ISRG / Intuitive Surgical, Inc. | 0,00 | 8,43 | 1,27 | 18,99 | 0,9521 | 0,0018 | |||
| META / Meta Platforms, Inc. | 0,00 | 12,13 | 1,27 | 43,55 | 0,9501 | 0,1644 | |||
| EMR / Emerson Electric Co. | 0,01 | 0,87 | 1,24 | 22,73 | 0,9299 | 0,0297 | |||
| IBM / International Business Machines Corporation | 0,00 | -3,23 | 1,22 | 14,70 | 1,1124 | 0,1688 | |||
| CRWD / CrowdStrike Holdings, Inc. | 0,00 | 1,45 | 1,21 | 46,61 | 0,9068 | 0,1720 | |||
| EBIT / Harbor ETF Trust - Harbor Small Cap Earners ETF | 0,04 | 1,15 | 1,0518 | 1,0518 | |||||
| MMM / 3M Company | 0,01 | -0,99 | 1,02 | 2,63 | 0,9276 | 0,0482 | |||
| ICE / Intercontinental Exchange, Inc. | 0,01 | -9,35 | 1,00 | -3,65 | 0,7504 | -0,1739 | |||
| RTX / RTX Corporation | 0,01 | -1,50 | 0,99 | 8,55 | 0,7416 | -0,0694 | |||
| TSLA / Tesla, Inc. | 0,00 | 4,74 | 0,98 | 28,50 | 0,8980 | 0,2174 | |||
| GOOGL / Alphabet Inc. | 0,01 | 14,88 | 0,96 | 30,97 | 0,8772 | 0,2251 | |||
| BAC / Bank of America Corporation | 0,02 | -3,21 | 0,93 | 9,67 | 0,6966 | -0,0571 | |||
| AMGN / Amgen Inc. | 0,00 | -0,79 | 0,91 | -11,09 | 0,8356 | -0,0787 | |||
| ACN / Accenture plc | 0,00 | -28,33 | 0,90 | -31,41 | 0,8247 | -0,3442 | |||
| NFLX / Netflix, Inc. | 0,00 | -7,97 | 0,90 | 32,30 | 0,8195 | 0,2161 | |||
| TMUS / T-Mobile US, Inc. | 0,00 | 56,89 | 0,83 | 40,17 | 0,6191 | 0,0946 | |||
| PANW / Palo Alto Networks, Inc. | 0,00 | 7,12 | 0,82 | 28,41 | 0,6126 | 0,0464 | |||
| LHX / L3Harris Technologies, Inc. | 0,00 | -6,72 | 0,82 | 11,80 | 0,6100 | -0,0380 | |||
| AVGO / Broadcom Inc. | 0,00 | 2,77 | 0,80 | 69,21 | 0,7281 | 0,3094 | |||
| TXN / Texas Instruments Incorporated | 0,00 | 4,41 | 0,79 | 20,74 | 0,7181 | 0,1389 | |||
| LOW / Lowe's Companies, Inc. | 0,00 | -1,85 | 0,78 | -6,61 | 0,5820 | -0,1582 | |||
| ADI / Analog Devices, Inc. | 0,00 | -10,13 | 0,77 | 6,03 | 0,5799 | -0,0693 | |||
| ANET / Arista Networks Inc | 0,01 | 64,55 | 0,75 | 117,39 | 0,5620 | 0,2548 | |||
| BRK.B / Berkshire Hathaway Inc. | 0,00 | 9,66 | 0,73 | 0,00 | 0,5490 | -0,1028 | |||
| BRK.A / Berkshire Hathaway Inc. | 0,00 | 0,00 | 0,73 | -8,77 | 0,5455 | -0,1642 | |||
| ORCL / Oracle Corporation | 0,00 | -4,54 | 0,69 | 49,35 | 0,6338 | 0,2207 | |||
| AMT / American Tower Corporation | 0,00 | -1,66 | 0,67 | 0,00 | 0,6113 | 0,0159 | |||
| NEE / NextEra Energy, Inc. | 0,01 | 35,56 | 0,64 | 32,92 | 0,4805 | 0,0507 | |||
| PFE / Pfizer Inc. | 0,03 | -9,52 | 0,64 | -13,40 | 0,4791 | -0,1782 | |||
| PLTR / Palantir Technologies Inc. | 0,00 | 41,47 | 0,62 | 128,57 | 0,5700 | 0,3273 | |||
| ABBV / AbbVie Inc. | 0,00 | 1,36 | 0,61 | -10,19 | 0,4552 | -0,1468 | |||
| PSX / Phillips 66 | 0,01 | -1,35 | 0,60 | -4,60 | 0,4500 | -0,1106 | |||
| WMT / Walmart Inc. | 0,01 | -0,58 | 0,60 | 10,72 | 0,5472 | 0,0663 | |||
| CAT / Caterpillar Inc. | 0,00 | 10,38 | 0,60 | 30,00 | 0,5468 | 0,1373 | |||
| AXP / American Express Company | 0,00 | 12,28 | 0,59 | 33,18 | 0,5434 | 0,1462 | |||
| GSCE / GS Connect S&P GSCI Enhanced Commodity Total Return ETN | 0,00 | 3,35 | 0,59 | 33,94 | 0,4407 | 0,0499 | |||
| PGR / The Progressive Corporation | 0,00 | 16,73 | 0,59 | 10,15 | 0,4390 | -0,0346 | |||
| AMD / Advanced Micro Devices, Inc. | 0,00 | 5,58 | 0,57 | 45,88 | 0,5175 | 0,1722 | |||
| ABT / Abbott Laboratories | 0,00 | 0,53 | 0,57 | 3,10 | 0,4234 | -0,0644 | |||
| HOOD / Robinhood Markets, Inc. | 0,01 | 0,56 | 0,5139 | 0,5139 | |||||
| HD / The Home Depot, Inc. | 0,00 | -14,00 | 0,56 | -13,89 | 0,4179 | -0,1589 | |||
| GEV / GE Vernova Inc. | 0,00 | -3,59 | 0,55 | 67,37 | 0,4150 | 0,1201 | |||
| PEP / PepsiCo, Inc. | 0,00 | -9,58 | 0,55 | -20,43 | 0,5056 | -0,1124 | |||
| SPGI / S&P Global Inc. | 0,00 | -0,86 | 0,55 | 2,81 | 0,4108 | -0,0633 | |||
| GE / General Electric Company | 0,00 | 0,54 | 0,4045 | 0,4045 | |||||
| ETN / Eaton Corporation plc | 0,00 | 1,42 | 0,54 | 33,33 | 0,4016 | 0,0435 | |||
| GGG / Graco Inc. | 0,01 | -1,32 | 0,53 | 1,52 | 0,3992 | -0,0674 | |||
| QCOM / QUALCOMM Incorporated | 0,00 | -37,32 | 0,52 | -34,96 | 0,4742 | -0,2359 | |||
| TJX / The TJX Companies, Inc. | 0,00 | -9,22 | 0,49 | -8,01 | 0,4521 | -0,0259 | |||
| HRL / Hormel Foods Corporation | 0,02 | 0,00 | 0,48 | -2,22 | 0,3625 | -0,0778 | |||
| AXON / Axon Enterprise, Inc. | 0,00 | -1,69 | 0,48 | 54,84 | 0,4386 | 0,1628 | |||
| WFC / Wells Fargo & Company | 0,01 | -16,02 | 0,46 | -6,11 | 0,3450 | -0,0921 | |||
| V / Visa Inc. | 0,00 | 5,33 | 0,44 | 6,88 | 0,3258 | -0,0368 | |||
| IBTP / iShares Trust - iShares iBonds Dec 2034 Term Treasury ETF | 0,02 | 23,12 | 0,42 | 23,24 | 0,3138 | 0,0116 | |||
| BMY / Bristol-Myers Squibb Company | 0,01 | -8,50 | 0,41 | -30,49 | 0,3726 | -0,1495 | |||
| PWR / Quanta Services, Inc. | 0,00 | -5,44 | 0,41 | 40,83 | 0,3048 | 0,0475 | |||
| HON / Honeywell International Inc. | 0,00 | 1,94 | 0,40 | 11,91 | 0,3029 | -0,0179 | |||
| PRI / Primerica, Inc. | 0,00 | 0,00 | 0,40 | -3,86 | 0,3647 | -0,0043 | |||
| CDNS / Cadence Design Systems, Inc. | 0,00 | 2,57 | 0,39 | 24,37 | 0,3594 | 0,0780 | |||
| GRMN / Garmin Ltd. | 0,00 | 10,83 | 0,39 | 6,56 | 0,2924 | -0,0335 | |||
| NUMG / Nushares ETF Trust - Nuveen ESG Mid-Cap Growth ETF | 0,01 | 0,39 | 0,2921 | 0,2921 | |||||
| LDOS / Leidos Holdings, Inc. | 0,00 | 11,75 | 0,39 | 30,87 | 0,2920 | 0,0266 | |||
| BK / The Bank of New York Mellon Corporation | 0,00 | -6,35 | 0,39 | 1,84 | 0,2906 | -0,0486 | |||
| MA / Mastercard Incorporated | 0,00 | 10,66 | 0,38 | 13,27 | 0,2881 | -0,0134 | |||
| PYPL / PayPal Holdings, Inc. | 0,01 | 8,46 | 0,38 | 23,78 | 0,2845 | 0,0110 | |||
| JNJ / Johnson & Johnson | 0,00 | -14,70 | 0,38 | -21,37 | 0,3465 | -0,0828 | |||
| MNST / Monster Beverage Corporation | 0,01 | 0,37 | 0,3347 | 0,3347 | |||||
| SSD / Simpson Manufacturing Co., Inc. | 0,00 | 0,30 | 0,36 | -0,82 | 0,3329 | 0,0063 | |||
| USB / U.S. Bancorp | 0,01 | -3,34 | 0,35 | 3,57 | 0,2611 | -0,0382 | |||
| FICO / Fair Isaac Corporation | 0,00 | 0,35 | 0,3172 | 0,3172 | |||||
| LIN / Linde plc | 0,00 | -3,15 | 0,35 | -2,26 | 0,2591 | -0,0562 | |||
| VO / Vanguard Index Funds - Vanguard Mid-Cap ETF | 0,00 | 0,35 | 0,3154 | 0,3154 | |||||
| IEFA / iShares Trust - iShares Core MSCI EAFE ETF | 0,00 | -30,59 | 0,34 | -23,34 | 0,2509 | -0,1381 | |||
| SBUX / Starbucks Corporation | 0,00 | -7,23 | 0,33 | -13,33 | 0,2976 | -0,0365 | |||
| NXPI / NXP Semiconductors N.V. | 0,00 | -11,86 | 0,32 | 1,27 | 0,2383 | -0,0410 | |||
| EME / EMCOR Group, Inc. | 0,00 | -12,46 | 0,32 | 26,51 | 0,2362 | 0,0148 | |||
| WTS / Watts Water Technologies, Inc. | 0,00 | 0,00 | 0,31 | 20,54 | 0,2334 | 0,0035 | |||
| CEG / Constellation Energy Corporation | 0,00 | 0,31 | 0,2818 | 0,2818 | |||||
| SO / The Southern Company | 0,00 | 0,43 | 0,30 | 0,34 | 0,2236 | -0,0411 | |||
| BR / Broadridge Financial Solutions, Inc. | 0,00 | -0,41 | 0,30 | 0,00 | 0,2706 | 0,0068 | |||
| GOLF / Acushnet Holdings Corp. | 0,00 | -0,32 | 0,29 | 5,76 | 0,2686 | 0,0214 | |||
| TTC / The Toro Company | 0,00 | 16,76 | 0,29 | 13,28 | 0,2174 | -0,0102 | |||
| FCN / FTI Consulting, Inc. | 0,00 | 0,00 | 0,29 | -1,37 | 0,2164 | -0,0447 | |||
| IWR / iShares Trust - iShares Russell Mid-Cap ETF | 0,00 | 0,00 | 0,28 | 7,98 | 0,2131 | -0,0210 | |||
| LLY / Eli Lilly and Company | 0,00 | -0,56 | 0,28 | -6,08 | 0,2542 | -0,0093 | |||
| SLV / iShares Silver Trust | 0,01 | 2,74 | 0,28 | 8,66 | 0,2529 | 0,0267 | |||
| XLK / The Select Sector SPDR Trust - The Technology Select Sector SPDR Fund | 0,00 | 0,00 | 0,26 | 22,97 | 0,1926 | 0,0061 | |||
| ECL / Ecolab Inc. | 0,00 | -13,36 | 0,25 | -8,06 | 0,2298 | -0,0131 | |||
| QQQ / Invesco QQQ Trust, Series 1 | 0,00 | 0,25 | 0,1883 | 0,1883 | |||||
| ITOT / iShares Trust - iShares Core S&P Total U.S. Stock Market ETF | 0,00 | -14,90 | 0,25 | -6,11 | 0,1848 | -0,0482 | |||
| EBGEF / Enbridge Inc. - Preferred Stock | 0,01 | 0,24 | 0,2233 | 0,2233 | |||||
| MC / Moelis & Company | 0,00 | 0,70 | 0,24 | 7,56 | 0,2218 | 0,0211 | |||
| CRVL / CorVel Corporation | 0,00 | 0,00 | 0,24 | -8,20 | 0,1760 | -0,0517 | |||
| SOLV / Solventum Corporation | 0,00 | -1,61 | 0,23 | -1,70 | 0,1730 | -0,0364 | |||
| FDX / FedEx Corporation | 0,00 | -12,32 | 0,23 | -18,12 | 0,1694 | -0,0767 | |||
| RBC / RBC Bearings Incorporated | 0,00 | -14,77 | 0,22 | 1,82 | 0,1679 | -0,0277 | |||
| LSTR / Landstar System, Inc. | 0,00 | 10,43 | 0,22 | 2,29 | 0,2044 | 0,0098 | |||
| KAI / Kadant Inc. | 0,00 | 0,00 | 0,22 | -5,93 | 0,2035 | -0,0067 | |||
| KMI / Kinder Morgan, Inc. | 0,01 | -26,45 | 0,22 | -24,23 | 0,2033 | -0,0577 | |||
| SPYG / SPDR Series Trust - SPDR Portfolio S&P 500 Growth ETF | 0,00 | 0,22 | 0,2027 | 0,2027 | |||||
| NUSC / Nushares ETF Trust - Nuveen ESG Small-Cap ETF | 0,01 | 0,22 | 0,1984 | 0,1984 | |||||
| ESGD / iShares Trust - iShares ESG Aware MSCI EAFE ETF | 0,00 | 0,21 | 0,1608 | 0,1608 | |||||
| MDT / Medtronic plc | 0,00 | -23,08 | 0,21 | -25,45 | 0,1561 | -0,0923 | |||
| XEL / Xcel Energy Inc. | 0,00 | 0,21 | 0,1887 | 0,1887 | |||||
| SAIC / Science Applications International Corporation | 0,00 | 0,00 | 0,20 | 0,50 | 0,1516 | -0,0279 | |||
| ZETA / Zeta Global Holdings Corp. | 0,01 | 0,20 | 0,1797 | 0,1797 | |||||
| PKE / Park Aerospace Corp. | 0,01 | 0,00 | 0,15 | 10,14 | 0,1391 | 0,0158 | |||
| ELAN / Elanco Animal Health Incorporated | 0,01 | 0,15 | 0,1364 | 0,1364 | |||||
| ORN / Orion Group Holdings, Inc. | 0,01 | 0,00 | 0,12 | 74,63 | 0,0880 | 0,0278 | |||
| HBI / Hanesbrands Inc. | 0,02 | 15,49 | 0,08 | -8,99 | 0,0611 | -0,0180 | |||
| UNH / UnitedHealth Group Incorporated | Call | 0,00 | 0,03 | 0,0285 | 0,0285 | ||||
| ZETA / Zeta Global Holdings Corp. | Call | 0,00 | 0,02 | 0,0170 | 0,0170 | ||||
| XTNT / Xtant Medical Holdings, Inc. | 0,02 | 0,00 | 0,01 | 55,56 | 0,0111 | 0,0027 | |||
| TMO / Thermo Fisher Scientific Inc. | 0,00 | -100,00 | 0,00 | 0,0000 | |||||
| DE / Deere & Company | 0,00 | -100,00 | 0,00 | 0,0000 | |||||
| CVS / CVS Health Corporation | 0,00 | -100,00 | 0,00 | 0,0000 | |||||
| LDOS / Leidos Holdings, Inc. | Call | 0,00 | -100,00 | 0,00 | -100,00 | -0,0240 | |||
| CVX / Chevron Corporation | 0,00 | -100,00 | 0,00 | 0,0000 | |||||
| LYG / Lloyds Banking Group plc - Depositary Receipt (Common Stock) | 0,00 | -100,00 | 0,00 | 0,0000 | |||||
| UFPI / UFP Industries, Inc. | 0,00 | -100,00 | 0,00 | 0,0000 | |||||
| TT / Trane Technologies plc | 0,00 | -100,00 | 0,00 | 0,0000 | |||||
| PFE / Pfizer Inc. | Call | 0,00 | -100,00 | 0,00 | -100,00 | -0,1126 | |||
| FI / Fiserv, Inc. | 0,00 | -100,00 | 0,00 | 0,0000 | |||||
| LMT / Lockheed Martin Corporation | 0,00 | -100,00 | 0,00 | 0,0000 |