Statistiques de base
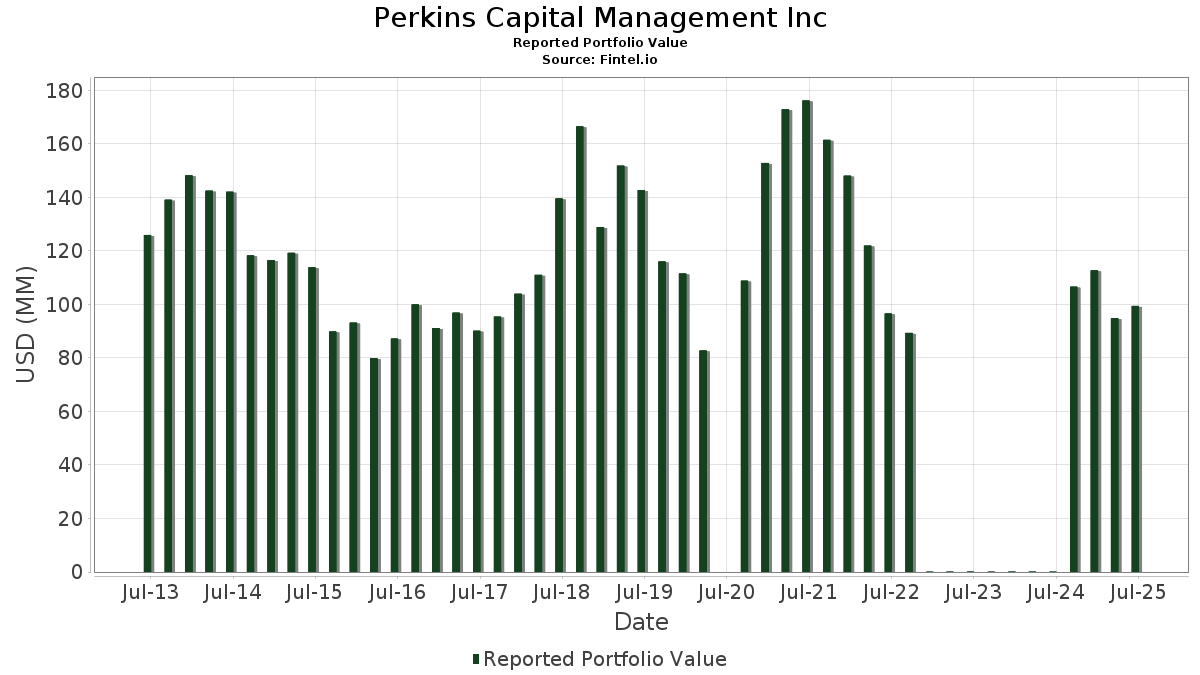
| Valeur du portefeuille | $ 99 456 788 |
| Positions actuelles | 83 |
Dernières positions, performances, ASG (à partir des dépôts 13F, 13D)
Perkins Capital Management Inc a déclaré un total de 83 positions dans ses derniers dépôts auprès de la SEC. La valeur la plus récente du portefeuille est calculée à 99 456 788 USD. Les actifs sous gestion réels (ASG) sont cette valeur plus les liquidités (qui ne sont pas divulguées). Les principales positions de Perkins Capital Management Inc sont Natera, Inc. (US:NTRA) , Eli Lilly and Company (US:LLY) , Microsoft Corporation (US:MSFT) , IDEXX Laboratories, Inc. (US:IDXX) , and Magnite, Inc. (US:MGNI) . Les nouvelles positions de Perkins Capital Management Inc incluent Inuvo, Inc. (US:INUV) , Ondas Holdings Inc. (US:ONDS) , CVRx, Inc. (US:CVRX) , Pulmonx Corporation (US:LUNG) , and .
Meilleures augmentations ce trimestre
Nous utilisons la variation de l'allocation du portefeuille car il s'agit de l'indicateur le plus significatif. Les changements peuvent être dus à des transactions ou à des variations de prix des actions.
| Titre | Actions (en millions) |
Valeur ($ en millions) |
% du portefeuille | ΔPortefeuille % |
|---|---|---|---|---|
| 0,70 | 3,20 | 3,2159 | 3,2159 | |
| 0,14 | 3,26 | 3,2770 | 1,5310 | |
| 0,12 | 2,50 | 2,5141 | 1,5238 | |
| 0,74 | 1,43 | 1,4363 | 1,4363 | |
| 1,42 | 3,14 | 3,1554 | 1,3864 | |
| 0,01 | 6,11 | 6,1441 | 1,2418 | |
| 0,39 | 2,32 | 2,3290 | 1,2194 | |
| 0,15 | 1,04 | 1,0465 | 1,0465 | |
| 1,50 | 1,02 | 1,0230 | 1,0230 | |
| 0,01 | 5,20 | 5,2309 | 0,9357 |
Principales baisses ce trimestre
Nous utilisons la variation de l'allocation du portefeuille car il s'agit de l'indicateur le plus significatif. Les changements peuvent être dus à des transactions ou à des variations de prix des actions.
| Titre | Actions (en millions) |
Valeur ($ en millions) |
% du portefeuille | ΔPortefeuille % |
|---|---|---|---|---|
| 0,24 | 2,59 | 2,6044 | -2,3413 | |
| 0,18 | 0,05 | 0,0498 | -1,8803 | |
| 0,01 | 7,42 | 7,4617 | -1,0684 | |
| 1,15 | 2,28 | 2,2974 | -0,7342 | |
| 0,17 | 1,23 | 1,2344 | -0,5623 | |
| 0,08 | 2,22 | 2,2272 | -0,4787 | |
| 0,13 | 0,19 | 0,1914 | -0,4003 | |
| 1,06 | 0,30 | 0,3007 | -0,3979 | |
| 0,01 | 0,32 | 0,3167 | -0,3865 | |
| 0,01 | 0,48 | 0,4854 | -0,3332 |
Déclarations 13F et dépôts de fonds
Ce formulaire a été déposé le 2025-08-07 pour la période de déclaration 2025-06-30. Cliquez sur l'icône du lien pour voir l'historique complet des transactions.
Mettre à niveau pour débloquer les données premium et exporter vers Excel ![]() .
.
| Titre | Type | Prix moyen de l'action | Actions (en millions) |
ΔActions (%) |
ΔActions (%) |
Valeur ($ en millions) |
Portefeuille (%) |
ΔPortefeuille (%) |
|
|---|---|---|---|---|---|---|---|---|---|
| NTRA / Natera, Inc. | 0,05 | -8,18 | 7,73 | 9,71 | 7,7712 | 0,3420 | |||
| LLY / Eli Lilly and Company | 0,01 | -2,81 | 7,42 | -8,26 | 7,4617 | -1,0684 | |||
| MSFT / Microsoft Corporation | 0,01 | -0,81 | 6,11 | 31,43 | 6,1441 | 1,2418 | |||
| IDXX / IDEXX Laboratories, Inc. | 0,01 | 0,00 | 5,20 | 27,72 | 5,2309 | 0,9357 | |||
| MGNI / Magnite, Inc. | 0,14 | -6,89 | 3,26 | 96,92 | 3,2770 | 1,5310 | |||
| INUV / Inuvo, Inc. | 0,70 | 3,20 | 3,2159 | 3,2159 | |||||
| MDXH / MDxHealth SA | 1,42 | 20,19 | 3,14 | 87,12 | 3,1554 | 1,3864 | |||
| ABT / Abbott Laboratories | 0,02 | -2,63 | 2,96 | -0,17 | 2,9734 | -0,1499 | |||
| AMD / Advanced Micro Devices, Inc. | 0,02 | -7,21 | 2,74 | 28,17 | 2,7542 | 0,5005 | |||
| AXGN / Axogen, Inc. | 0,24 | -5,84 | 2,59 | -44,78 | 2,6044 | -2,3413 | |||
| LMAT / LeMaitre Vascular, Inc. | 0,03 | -5,17 | 2,55 | -6,15 | 2,5645 | -0,3006 | |||
| BKSY / BlackSky Technology Inc. | 0,12 | 0,00 | 2,50 | 166,24 | 2,5141 | 1,5238 | |||
| OOMA / Ooma, Inc. | 0,19 | -0,20 | 2,46 | -1,64 | 2,4748 | -0,1639 | |||
| APPS / Digital Turbine, Inc. | 0,39 | 1,29 | 2,32 | 120,15 | 2,3290 | 1,2194 | |||
| ELUT / Elutia Inc. | 1,15 | 1,55 | 2,28 | -20,56 | 2,2974 | -0,7342 | |||
| VCYT / Veracyte, Inc. | 0,08 | -5,31 | 2,22 | -13,68 | 2,2272 | -0,4787 | |||
| TELA / TELA Bio, Inc. | 0,88 | -3,82 | 1,70 | 53,06 | 1,7085 | 0,5370 | |||
| PSNL / Personalis, Inc. | 0,25 | -1,87 | 1,66 | 83,39 | 1,6654 | 0,7131 | |||
| XGN / Exagen Inc. | 0,23 | -45,18 | 1,62 | 6,59 | 1,6272 | 0,0261 | |||
| BLZE / Backblaze, Inc. | 0,29 | 0,00 | 1,57 | 13,85 | 1,5790 | 0,1248 | |||
| USIO / Usio, Inc. | 0,99 | -0,40 | 1,52 | 4,40 | 1,5256 | -0,0073 | |||
| ONDS / Ondas Holdings Inc. | 0,74 | 1,43 | 1,4363 | 1,4363 | |||||
| PERI / Perion Network Ltd. | 0,13 | 132,06 | 1,31 | 189,58 | 1,3132 | 0,8373 | |||
| CYRX / Cryoport, Inc. | 0,17 | 6,75 | 1,27 | 30,99 | 1,2755 | 0,2542 | |||
| QUIK / QuickLogic Corporation | 0,20 | 0,00 | 1,25 | 20,54 | 1,2570 | 0,1635 | |||
| NEO / NeoGenomics, Inc. | 0,17 | -6,46 | 1,23 | -27,95 | 1,2344 | -0,5623 | |||
| VCEL / Vericel Corporation | 0,03 | -1,88 | 1,11 | -6,41 | 1,1166 | -0,1349 | |||
| ABBV / AbbVie Inc. | 0,01 | -5,43 | 1,09 | -16,25 | 1,0996 | -0,2767 | |||
| INGN / Inogen, Inc. | 0,15 | 1,04 | 1,0465 | 1,0465 | |||||
| CXDO / Crexendo, Inc. | 0,17 | 0,00 | 1,04 | 24,70 | 1,0412 | 0,1652 | |||
| NMTC / NeuroOne Medical Technologies Corporation | 1,50 | 1,02 | 1,0230 | 1,0230 | |||||
| LFVN / LifeVantage Corporation | 0,08 | 0,00 | 0,99 | -10,27 | 0,9930 | -0,1678 | |||
| PFE / Pfizer Inc. | 0,04 | -0,92 | 0,98 | -5,22 | 0,9861 | -0,1050 | |||
| AAPL / Apple Inc. | 0,00 | 0,00 | 0,95 | -7,56 | 0,9593 | -0,1299 | |||
| ATRC / AtriCure, Inc. | 0,03 | -2,67 | 0,95 | -1,14 | 0,9589 | -0,0582 | |||
| GILD / Gilead Sciences, Inc. | 0,01 | -19,36 | 0,92 | -20,22 | 0,9289 | -0,2919 | |||
| SKYT / SkyWater Technology, Inc. | 0,09 | -12,47 | 0,90 | 21,38 | 0,9028 | 0,1234 | |||
| T / AT&T Inc. | 0,03 | -3,96 | 0,88 | -1,68 | 0,8829 | -0,0592 | |||
| CIEN / Ciena Corporation | 0,01 | -31,80 | 0,78 | -8,30 | 0,7891 | -0,1125 | |||
| CDXS / Codexis, Inc. | 0,31 | -2,13 | 0,76 | -11,20 | 0,7654 | -0,1388 | |||
| MRK / Merck & Co., Inc. | 0,01 | -16,67 | 0,69 | -26,54 | 0,6964 | -0,2973 | |||
| BFLY / Butterfly Network, Inc. | 0,30 | 7,37 | 0,59 | -5,90 | 0,5937 | -0,0674 | |||
| USB / U.S. Bancorp | 0,01 | -1,51 | 0,59 | 5,55 | 0,5937 | 0,0039 | |||
| CSTL / Castle Biosciences, Inc. | 0,03 | -17,58 | 0,57 | -15,91 | 0,5748 | -0,1422 | |||
| ANIP / ANI Pharmaceuticals, Inc. | 0,01 | 0,00 | 0,55 | -2,65 | 0,5538 | -0,0421 | |||
| OPRX / OptimizeRx Corporation | 0,04 | -10,32 | 0,53 | 39,79 | 0,5307 | 0,1326 | |||
| VZ / Verizon Communications Inc. | 0,01 | 0,00 | 0,51 | -4,67 | 0,5137 | -0,0510 | |||
| APYX / Apyx Medical Corporation | 0,23 | 10,46 | 0,51 | 81,49 | 0,5135 | 0,2167 | |||
| VTRS / Viatris Inc. | 0,06 | -5,01 | 0,51 | -2,69 | 0,5107 | -0,0392 | |||
| NXPI / NXP Semiconductors N.V. | 0,00 | 0,00 | 0,50 | 14,87 | 0,5053 | 0,0443 | |||
| TGT / Target Corporation | 0,00 | -9,26 | 0,48 | -14,21 | 0,4860 | -0,1082 | |||
| BMY / Bristol-Myers Squibb Company | 0,01 | -18,07 | 0,48 | -37,89 | 0,4854 | -0,3332 | |||
| COP / ConocoPhillips | 0,01 | -19,23 | 0,47 | -30,94 | 0,4737 | -0,2461 | |||
| GIS / General Mills, Inc. | 0,01 | -22,27 | 0,46 | -32,60 | 0,4636 | -0,2582 | |||
| SERA / Sera Prognostics, Inc. | 0,13 | -12,67 | 0,36 | -30,65 | 0,3649 | -0,1856 | |||
| PLUS / ePlus inc. | 0,01 | 0,00 | 0,36 | 18,03 | 0,3625 | 0,0407 | |||
| DGII / Digi International Inc. | 0,01 | 0,00 | 0,36 | 25,44 | 0,3622 | 0,0590 | |||
| INTC / Intel Corporation | 0,01 | 0,00 | 0,33 | -1,20 | 0,3311 | -0,0209 | |||
| FAST / Fastenal Company | 0,01 | -12,79 | 0,32 | -52,70 | 0,3167 | -0,3865 | |||
| DCI / Donaldson Company, Inc. | 0,00 | -36,23 | 0,31 | -33,98 | 0,3068 | -0,1811 | |||
| BDSX / Biodesix, Inc. | 1,06 | 0,00 | 0,30 | -54,83 | 0,3007 | -0,3979 | |||
| BP / BP p.l.c. - Depositary Receipt (Common Stock) | 0,01 | 0,00 | 0,28 | -11,29 | 0,2769 | -0,0509 | |||
| BLFS / BioLife Solutions, Inc. | 0,01 | -7,41 | 0,27 | -12,66 | 0,2707 | -0,0544 | |||
| COST / Costco Wholesale Corporation | 0,00 | 0,00 | 0,25 | 4,66 | 0,2488 | -0,0005 | |||
| JNJ / Johnson & Johnson | 0,00 | 0,00 | 0,24 | -7,92 | 0,2457 | -0,0341 | |||
| ASUR / Asure Software, Inc. | 0,03 | 0,00 | 0,24 | 2,52 | 0,2453 | -0,0064 | |||
| FPAY / FlexShopper, Inc. | 0,19 | 0,00 | 0,22 | -6,33 | 0,2239 | -0,0266 | |||
| DGX / Quest Diagnostics Incorporated | 0,00 | 0,00 | 0,22 | 5,91 | 0,2167 | 0,0026 | |||
| BAX / Baxter International Inc. | 0,01 | -36,11 | 0,21 | -43,63 | 0,2101 | -0,1797 | |||
| HAIN / The Hain Celestial Group, Inc. | 0,13 | -7,40 | 0,19 | -66,13 | 0,1914 | -0,4003 | |||
| CELC / Celcuity Inc. | 0,01 | 3,08 | 0,16 | 36,84 | 0,1570 | 0,0361 | |||
| MYO / Myomo, Inc. | 0,06 | -18,13 | 0,13 | -63,33 | 0,1333 | -0,2470 | |||
| TCMD / Tactile Systems Technology, Inc. | 0,01 | -52,74 | 0,11 | -63,90 | 0,1142 | -0,2162 | |||
| CVRX / CVRx, Inc. | 0,02 | 0,10 | 0,0967 | 0,0967 | |||||
| ARAY / Accuray Incorporated | 0,07 | 6,87 | 0,10 | -18,80 | 0,0964 | -0,0272 | |||
| RMTI / Rockwell Medical, Inc. | 0,07 | 0,00 | 0,06 | -25,93 | 0,0613 | -0,0244 | |||
| SCPH / scPharmaceuticals Inc. | 0,01 | -21,51 | 0,05 | 13,33 | 0,0517 | 0,0040 | |||
| ATEC / Alphatec Holdings, Inc. | 0,18 | -0,39 | 0,05 | -97,32 | 0,0498 | -1,8803 | |||
| DYAI / Dyadic International, Inc. | 0,05 | 0,00 | 0,05 | -26,56 | 0,0476 | -0,0205 | |||
| IRIX / IRIDEX Corporation | 0,05 | 0,00 | 0,04 | -10,87 | 0,0419 | -0,0074 | |||
| SENS / Senseonics Holdings, Inc. | 0,08 | 21,21 | 0,04 | -11,63 | 0,0383 | -0,0073 | |||
| LUNG / Pulmonx Corporation | 0,01 | 0,03 | 0,0260 | 0,0260 | |||||
| AIRG / Airgain, Inc. | 0,04 | 0,00 | 0,01 | -95,93 | 0,0054 | -0,1243 | |||
| VFF / Village Farms International, Inc. | 0,00 | -100,00 | 0,00 | 0,0000 | |||||
| XOM / Exxon Mobil Corporation | 0,00 | -100,00 | 0,00 | 0,0000 | |||||
| INUV / Inuvo, Inc. | 0,00 | -100,00 | 0,00 | 0,0000 | |||||
| CTLP / Cantaloupe, Inc. | 0,00 | -100,00 | 0,00 | 0,0000 | |||||
| STRM / Streamline Health Solutions, Inc. | 0,00 | -100,00 | 0,00 | 0,0000 |