Statistiques de base
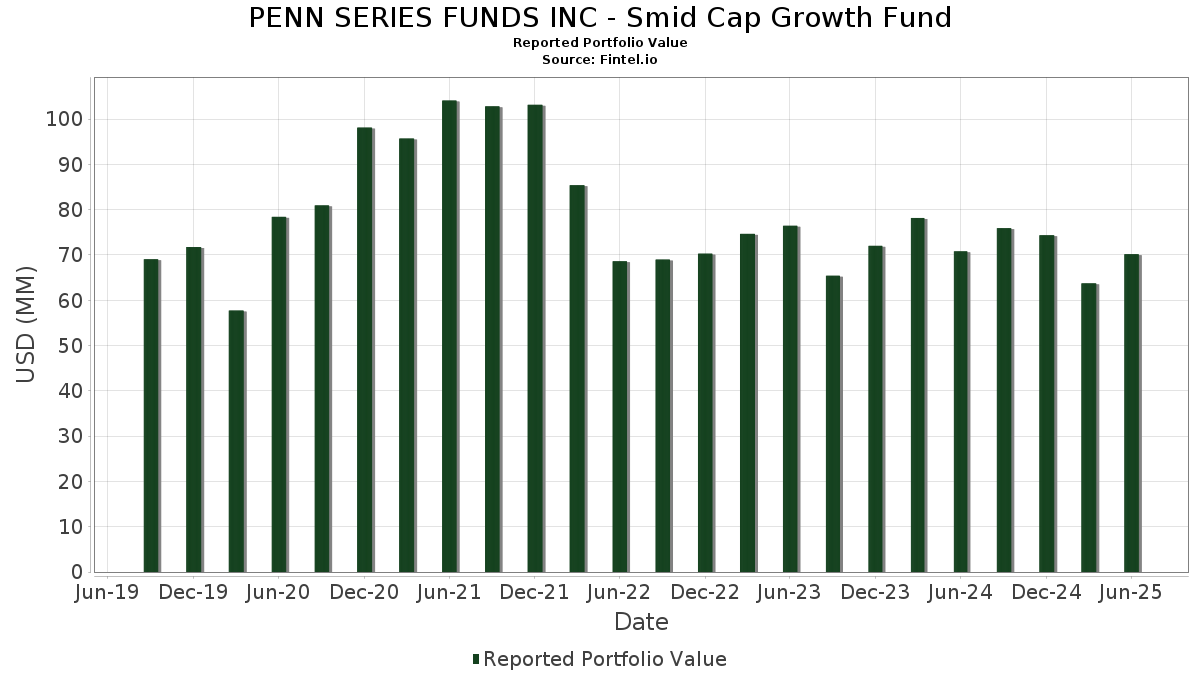
| Valeur du portefeuille | $ 70 172 815 |
| Positions actuelles | 84 |
Dernières positions, performances, ASG (à partir des dépôts 13F, 13D)
PENN SERIES FUNDS INC - Smid Cap Growth Fund a déclaré un total de 84 positions dans ses derniers dépôts auprès de la SEC. La valeur la plus récente du portefeuille est calculée à 70 172 815 USD. Les actifs sous gestion réels (ASG) sont cette valeur plus les liquidités (qui ne sont pas divulguées). Les principales positions de PENN SERIES FUNDS INC - Smid Cap Growth Fund sont Toast, Inc. (US:TOST) , Natera, Inc. (US:NTRA) , Loar Holdings Inc. (US:LOAR) , Texas Roadhouse, Inc. (US:TXRH) , and Credo Technology Group Holding Ltd (US:CRDO) . Les nouvelles positions de PENN SERIES FUNDS INC - Smid Cap Growth Fund incluent Equitable Holdings, Inc. (US:EQH) , Brinker International, Inc. (US:EAT) , Rubrik, Inc. (US:RBRK) , Fabrinet (US:FN) , and Waystar Holding Corp. (US:WAY) .
Meilleures augmentations ce trimestre
Nous utilisons la variation de l'allocation du portefeuille car il s'agit de l'indicateur le plus significatif. Les changements peuvent être dus à des transactions ou à des variations de prix des actions.
| Titre | Actions (en millions) |
Valeur ($ en millions) |
% du portefeuille | ΔPortefeuille % |
|---|---|---|---|---|
| 0,02 | 1,06 | 1,5198 | 1,5198 | |
| 0,01 | 1,05 | 1,5046 | 1,5046 | |
| 0,01 | 0,95 | 1,3610 | 1,3610 | |
| 0,01 | 1,38 | 1,9736 | 1,1178 | |
| 0,00 | 0,78 | 1,1143 | 1,1143 | |
| 0,01 | 1,30 | 1,8574 | 1,0671 | |
| 0,02 | 0,72 | 1,0298 | 1,0298 | |
| 0,01 | 0,70 | 0,9969 | 0,9969 | |
| 0,04 | 1,69 | 2,4121 | 0,9708 | |
| 0,03 | 0,99 | 1,4102 | 0,8065 |
Principales baisses ce trimestre
Nous utilisons la variation de l'allocation du portefeuille car il s'agit de l'indicateur le plus significatif. Les changements peuvent être dus à des transactions ou à des variations de prix des actions.
| Titre | Actions (en millions) |
Valeur ($ en millions) |
% du portefeuille | ΔPortefeuille % |
|---|---|---|---|---|
| 0,00 | 0,00 | -1,1681 | ||
| 0,01 | 0,86 | 1,2284 | -0,4980 | |
| 0,01 | 0,42 | 0,6028 | -0,4725 | |
| 0,01 | 0,55 | 0,7843 | -0,4342 | |
| 0,00 | 1,28 | 1,8257 | -0,4196 | |
| 0,01 | 0,64 | 0,9147 | -0,3868 | |
| 0,00 | 0,54 | 0,7681 | -0,3480 | |
| 0,00 | 0,64 | 0,9209 | -0,3124 | |
| 0,00 | 0,41 | 0,5889 | -0,2689 | |
| 0,95 | 0,95 | 1,3626 | -0,2640 |
Déclarations 13F et dépôts de fonds
Ce formulaire a été déposé le 2025-08-26 pour la période de déclaration 2025-06-30. Cliquez sur l'icône du lien pour voir l'historique complet des transactions.
Mettre à niveau pour débloquer les données premium et exporter vers Excel ![]() .
.
| Titre | Type | Prix moyen de l'action | Actions (en millions) |
ΔActions (%) |
ΔActions (%) |
Valeur ($ en millions) |
Portefeuille (%) |
ΔPortefeuille (%) |
|
|---|---|---|---|---|---|---|---|---|---|
| TOST / Toast, Inc. | 0,04 | 38,06 | 1,69 | 84,39 | 2,4121 | 0,9708 | |||
| NTRA / Natera, Inc. | 0,01 | 27,51 | 1,49 | 52,36 | 2,1237 | 0,5881 | |||
| LOAR / Loar Holdings Inc. | 0,02 | -1,65 | 1,42 | 19,90 | 2,0317 | 0,1662 | |||
| TXRH / Texas Roadhouse, Inc. | 0,01 | -1,16 | 1,39 | 11,17 | 1,9892 | 0,0184 | |||
| CRDO / Credo Technology Group Holding Ltd | 0,01 | 10,17 | 1,38 | 154,04 | 1,9736 | 1,1178 | |||
| GWRE / Guidewire Software, Inc. | 0,01 | 30,97 | 1,37 | 64,63 | 1,9609 | 0,6486 | |||
| AIT / Applied Industrial Technologies, Inc. | 0,01 | -1,35 | 1,35 | 1,74 | 1,9213 | -0,1582 | |||
| SN / SharkNinja, Inc. | 0,01 | 43,90 | 1,31 | 70,96 | 1,8753 | 0,6658 | |||
| SHAK / Shake Shack Inc. | 0,01 | 62,33 | 1,30 | 158,96 | 1,8574 | 1,0671 | |||
| KNSL / Kinsale Capital Group, Inc. | 0,00 | -9,92 | 1,28 | -10,44 | 1,8257 | -0,4196 | |||
| BIRK / Birkenstock Holding plc | 0,03 | 78,03 | 1,25 | 91,15 | 1,7885 | 0,7569 | |||
| CWST / Casella Waste Systems, Inc. | 0,01 | 48,23 | 1,16 | 53,38 | 1,6544 | 0,4663 | |||
| MTSI / MACOM Technology Solutions Holdings, Inc. | 0,01 | 26,70 | 1,13 | 80,99 | 1,6187 | 0,6329 | |||
| DT / Dynatrace, Inc. | 0,02 | 26,18 | 1,13 | 47,77 | 1,6126 | 0,4105 | |||
| 6B6 / monday.com Ltd. | 0,00 | 49,01 | 1,09 | 92,91 | 1,5538 | 0,6658 | |||
| INSM / Insmed Incorporated | 0,01 | -1,35 | 1,08 | 30,23 | 1,5383 | 0,2364 | |||
| SPXC / SPX Technologies, Inc. | 0,01 | 23,64 | 1,08 | 61,08 | 1,5368 | 0,4853 | |||
| NOVT / Novanta Inc. | 0,01 | 18,11 | 1,07 | 19,02 | 1,5289 | 0,1148 | |||
| EQH / Equitable Holdings, Inc. | 0,02 | 1,06 | 1,5198 | 1,5198 | |||||
| MANH / Manhattan Associates, Inc. | 0,01 | 25,80 | 1,06 | -8,07 | 1,5137 | -0,0426 | |||
| RBC / RBC Bearings Incorporated | 0,00 | 47,45 | 1,06 | 76,46 | 1,5095 | 0,5666 | |||
| MMSI / Merit Medical Systems, Inc. | 0,01 | 6,96 | 1,05 | -5,48 | 1,5051 | -0,2475 | |||
| EAT / Brinker International, Inc. | 0,01 | 1,05 | 1,5046 | 1,5046 | |||||
| HLI / Houlihan Lokey, Inc. | 0,01 | 50,32 | 1,03 | 67,48 | 1,4640 | 0,5012 | |||
| JEF / Jefferies Financial Group Inc. | 0,02 | 83,82 | 1,01 | 87,90 | 1,4416 | 0,5955 | |||
| HUBB / Hubbell Incorporated | 0,00 | 44,26 | 1,01 | 78,05 | 1,4370 | 0,5481 | |||
| KVYO / Klaviyo, Inc. | 0,03 | 131,87 | 0,99 | 157,70 | 1,4102 | 0,8065 | |||
| MOGA / Moog, Inc. - Class A | 0,01 | 30,32 | 0,98 | 35,96 | 1,4051 | 0,2675 | |||
| ALAB / Astera Labs, Inc. | 0,01 | 27,48 | 0,97 | 93,04 | 1,3879 | 0,5966 | |||
| PSN / Parsons Corporation | 0,01 | -2,43 | 0,96 | 18,32 | 1,3657 | 0,0938 | |||
| TFDXX / Blackrock Liquidity Funds - BlackRock Liquidity Funds FedFund Portfolio Institutional Class | 0,95 | -7,73 | 0,95 | -7,74 | 1,3626 | -0,2640 | |||
| RBRK / Rubrik, Inc. | 0,01 | 0,95 | 1,3610 | 1,3610 | |||||
| LSCC / Lattice Semiconductor Corporation | 0,02 | -1,23 | 0,95 | -7,77 | 1,3566 | -0,2630 | |||
| NDSN / Nordson Corporation | 0,00 | 39,21 | 0,94 | 48,10 | 1,3368 | 0,3415 | |||
| BMI / Badger Meter, Inc. | 0,00 | -23,83 | 0,91 | -1,93 | 1,3047 | -0,1606 | |||
| AS / Amer Sports, Inc. | 0,02 | -0,89 | 0,89 | 43,73 | 1,2775 | 0,2984 | |||
| GMED / Globus Medical, Inc. | 0,01 | 20,71 | 0,87 | -2,68 | 1,2458 | -0,1641 | |||
| RPM / RPM International Inc. | 0,01 | -1,05 | 0,87 | -6,05 | 1,2432 | -0,2142 | |||
| SFM / Sprouts Farmers Market, Inc. | 0,01 | -27,34 | 0,86 | -21,60 | 1,2284 | -0,4980 | |||
| NBIX / Neurocrine Biosciences, Inc. | 0,01 | 30,20 | 0,85 | 47,92 | 1,2180 | 0,3113 | |||
| ENSG / The Ensign Group, Inc. | 0,01 | 2,77 | 0,84 | 19,26 | 1,2030 | 0,2501 | |||
| LECO / Lincoln Electric Holdings, Inc. | 0,00 | -16,55 | 0,84 | -8,50 | 1,2002 | -0,2452 | |||
| CASY / Casey's General Stores, Inc. | 0,00 | -1,16 | 0,83 | 16,17 | 1,1804 | 0,0615 | |||
| OLLI / Ollie's Bargain Outlet Holdings, Inc. | 0,01 | -15,75 | 0,80 | -4,52 | 1,1457 | -0,1768 | |||
| FN / Fabrinet | 0,00 | 0,78 | 1,1143 | 1,1143 | |||||
| AAON / AAON, Inc. | 0,01 | -2,18 | 0,78 | -7,61 | 1,1096 | -0,2140 | |||
| FWONK / Formula One Group | 0,01 | -1,60 | 0,77 | 14,37 | 1,1026 | 0,0396 | |||
| CYBR / CyberArk Software Ltd. | 0,00 | -1,25 | 0,77 | 19,01 | 1,0999 | 0,0808 | |||
| EME / EMCOR Group, Inc. | 0,00 | -1,18 | 0,76 | 42,96 | 1,0892 | 0,2503 | |||
| Viking Holdings Ltd / EC (BMG93A5A1010) | 0,01 | -1,09 | 0,76 | 32,57 | 1,0813 | 0,1832 | |||
| EHC / Encompass Health Corporation | 0,01 | -4,31 | 0,75 | 15,90 | 1,0733 | 0,0530 | |||
| VRNS / Varonis Systems, Inc. | 0,01 | -1,24 | 0,75 | 23,92 | 1,0658 | 0,1184 | |||
| CH1134540470 / On Holding AG | 0,01 | 8,38 | 0,75 | 28,45 | 1,0647 | 0,1517 | |||
| NTNX / Nutanix, Inc. | 0,01 | -17,67 | 0,74 | 2,91 | 1,0614 | 0,0862 | |||
| WAY / Waystar Holding Corp. | 0,02 | 0,72 | 1,0298 | 1,0298 | |||||
| FSS / Federal Signal Corporation | 0,01 | -1,36 | 0,70 | 42,80 | 1,0065 | 0,2298 | |||
| RDNT / RadNet, Inc. | 0,01 | 0,70 | 0,9969 | 0,9969 | |||||
| DKS / DICK'S Sporting Goods, Inc. | 0,00 | -0,88 | 0,69 | -2,81 | 0,9892 | -0,1308 | |||
| ESAB / ESAB Corporation | 0,01 | -1,28 | 0,68 | 2,11 | 0,9680 | -0,0757 | |||
| EXEL / Exelixis, Inc. | 0,02 | -1,79 | 0,66 | 17,14 | 0,9479 | 0,0574 | |||
| CR / Crane Company | 0,00 | -33,66 | 0,64 | -17,86 | 0,9209 | -0,3124 | |||
| BJ / BJ's Wholesale Club Holdings, Inc. | 0,01 | -18,09 | 0,64 | -22,61 | 0,9147 | -0,3868 | |||
| BRKR / Bruker Corporation | 0,01 | 10,00 | 0,61 | 8,73 | 0,8712 | -0,0126 | |||
| BROS / Dutch Bros Inc. | 0,01 | 50,54 | 0,60 | 66,95 | 0,8513 | 0,2888 | |||
| IONS / Ionis Pharmaceuticals, Inc. | 0,01 | 14,89 | 0,59 | 50,77 | 0,8358 | 0,2239 | |||
| DECK / Deckers Outdoor Corporation | 0,01 | -23,09 | 0,55 | -29,07 | 0,7843 | -0,4342 | |||
| WSO / Watsco, Inc. | 0,00 | -12,75 | 0,54 | -24,26 | 0,7681 | -0,3480 | |||
| KRMN / Karman Holdings Inc. | 0,01 | 0,50 | 0,7094 | 0,7094 | |||||
| BBIO / BridgeBio Pharma, Inc. | 0,01 | -1,50 | 0,48 | 23,02 | 0,6876 | 0,0720 | |||
| TECH / Bio-Techne Corporation | 0,01 | 16,17 | 0,48 | 1,91 | 0,6861 | -0,0552 | |||
| SAIL / SailPoint, Inc. | 0,02 | 53,72 | 0,48 | 87,45 | 0,6829 | 0,2815 | |||
| TTAN / ServiceTitan, Inc. | 0,00 | -20,49 | 0,48 | -10,36 | 0,6806 | -0,1561 | |||
| ROIV / Roivant Sciences Ltd. | 0,04 | -1,28 | 0,46 | 10,39 | 0,6532 | 0,0007 | |||
| RVMD / Revolution Medicines, Inc. | 0,01 | -1,15 | 0,43 | 2,86 | 0,6176 | -0,0438 | |||
| JAZZ / Jazz Pharmaceuticals plc | 0,00 | -1,63 | 0,43 | -16,08 | 0,6125 | -0,1898 | |||
| GKOS / Glaukos Corporation | 0,00 | -1,11 | 0,42 | 3,92 | 0,6055 | -0,0371 | |||
| CAVA / CAVA Group, Inc. | 0,01 | -36,65 | 0,42 | -38,21 | 0,6028 | -0,4725 | |||
| MDGL / Madrigal Pharmaceuticals, Inc. | 0,00 | -1,09 | 0,41 | -9,63 | 0,5908 | -0,1292 | |||
| PEN / Penumbra, Inc. | 0,00 | -52,26 | 0,41 | -31,90 | 0,5889 | -0,2689 | |||
| ASND / Ascendis Pharma A/S - Depositary Receipt (Common Stock) | 0,00 | 17,12 | 0,41 | 29,65 | 0,5883 | 0,0887 | |||
| WCC / WESCO International, Inc. | 0,00 | -26,10 | 0,37 | -11,96 | 0,5263 | -0,1315 | |||
| EXE / Expand Energy Corporation | 0,00 | -1,43 | 0,21 | 3,47 | 0,2996 | -0,0191 | |||
| CHYM / Chime Financial, Inc. | 0,01 | 0,19 | 0,2684 | 0,2684 | |||||
| CAI / Caris Life Sciences, Inc. | 0,00 | 0,09 | 0,1292 | 0,1292 | |||||
| BCPC / Balchem Corporation | 0,00 | -100,00 | 0,00 | -100,00 | -1,1681 |