Statistiques de base
| Valeur du portefeuille | $ 160 455 539 |
| Positions actuelles | 74 |
Dernières positions, performances, ASG (à partir des dépôts 13F, 13D)
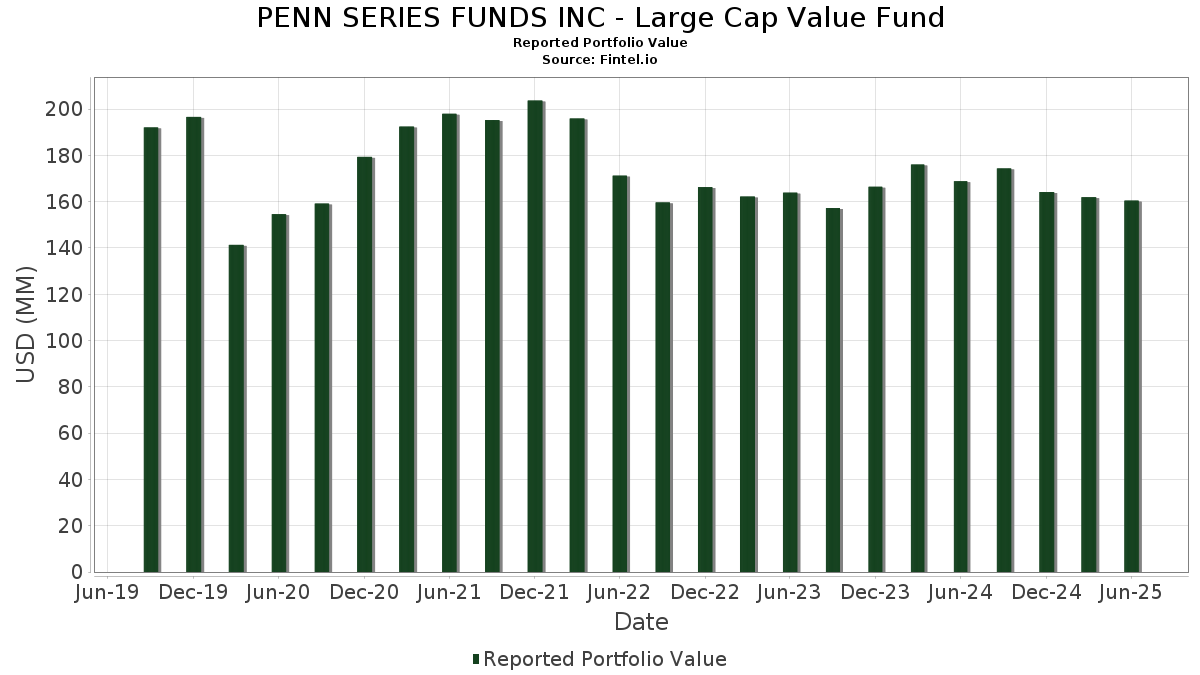
PENN SERIES FUNDS INC - Large Cap Value Fund a déclaré un total de 74 positions dans ses derniers dépôts auprès de la SEC. La valeur la plus récente du portefeuille est calculée à 160 455 539 USD. Les actifs sous gestion réels (ASG) sont cette valeur plus les liquidités (qui ne sont pas divulguées). Les principales positions de PENN SERIES FUNDS INC - Large Cap Value Fund sont JPMorgan Chase & Co. (US:JPM) , Berkshire Hathaway Inc. (US:BRK.B) , Philip Morris International Inc. (US:PM) , Johnson & Johnson (US:JNJ) , and Walmart Inc. (US:WMT) . Les nouvelles positions de PENN SERIES FUNDS INC - Large Cap Value Fund incluent The Walt Disney Company (US:DIS) , AT&T Inc. (US:T) , Agilent Technologies, Inc. (US:A) , Uber Technologies, Inc. (US:UBER) , and Mondelez International, Inc. (US:MDLZ) .
Meilleures augmentations ce trimestre
Nous utilisons la variation de l'allocation du portefeuille car il s'agit de l'indicateur le plus significatif. Les changements peuvent être dus à des transactions ou à des variations de prix des actions.
| Titre | Actions (en millions) |
Valeur ($ en millions) |
% du portefeuille | ΔPortefeuille % |
|---|---|---|---|---|
| 0,02 | 2,67 | 1,6593 | 1,6593 | |
| 0,07 | 1,90 | 1,1829 | 1,1829 | |
| 0,01 | 1,60 | 0,9964 | 0,9964 | |
| 0,02 | 1,54 | 0,9578 | 0,9578 | |
| 0,02 | 6,79 | 4,2222 | 0,9243 | |
| 0,02 | 1,17 | 0,7246 | 0,7246 | |
| 0,03 | 2,38 | 1,4782 | 0,6054 | |
| 4,67 | 4,67 | 2,9034 | 0,5486 | |
| 0,00 | 0,82 | 0,5127 | 0,5127 | |
| 0,01 | 0,80 | 0,5000 | 0,5000 |
Principales baisses ce trimestre
Nous utilisons la variation de l'allocation du portefeuille car il s'agit de l'indicateur le plus significatif. Les changements peuvent être dus à des transactions ou à des variations de prix des actions.
| Titre | Actions (en millions) |
Valeur ($ en millions) |
% du portefeuille | ΔPortefeuille % |
|---|---|---|---|---|
| 0,02 | 3,45 | 2,1421 | -1,2614 | |
| 0,04 | 3,11 | 1,9365 | -1,0923 | |
| 0,03 | 6,00 | 3,7327 | -1,0100 | |
| 0,02 | 1,29 | 0,8032 | -0,8406 | |
| 0,01 | 1,17 | 0,7263 | -0,8056 | |
| 0,01 | 0,97 | 0,6044 | -0,6880 | |
| 0,03 | 2,99 | 1,8588 | -0,6484 | |
| 0,01 | 3,06 | 1,9005 | -0,6172 | |
| 0,01 | 3,47 | 2,1595 | -0,6022 | |
| 0,01 | 1,88 | 1,1716 | -0,5753 |
Déclarations 13F et dépôts de fonds
Ce formulaire a été déposé le 2025-08-26 pour la période de déclaration 2025-06-30. Cliquez sur l'icône du lien pour voir l'historique complet des transactions.
Mettre à niveau pour débloquer les données premium et exporter vers Excel ![]() .
.
| Titre | Type | Prix moyen de l'action | Actions (en millions) |
ΔActions (%) |
ΔActions (%) |
Valeur ($ en millions) |
Portefeuille (%) |
ΔPortefeuille (%) |
|
|---|---|---|---|---|---|---|---|---|---|
| JPM / JPMorgan Chase & Co. | 0,02 | 7,53 | 6,79 | 27,08 | 4,2222 | 0,9243 | |||
| BRK.B / Berkshire Hathaway Inc. | 0,01 | 0,00 | 6,31 | -8,80 | 3,9207 | -0,3461 | |||
| PM / Philip Morris International Inc. | 0,03 | -31,91 | 6,00 | -21,88 | 3,7327 | -1,0100 | |||
| JNJ / Johnson & Johnson | 0,04 | 14,59 | 5,83 | 5,56 | 3,6243 | 0,2159 | |||
| WMT / Walmart Inc. | 0,05 | -14,32 | 5,10 | -4,57 | 3,1711 | -0,1275 | |||
| RTX / RTX Corporation | 0,03 | 2,99 | 4,92 | 13,53 | 3,0619 | 0,3850 | |||
| TFDXX / Blackrock Liquidity Funds - BlackRock Liquidity Funds FedFund Portfolio Institutional Class | 4,67 | 22,39 | 4,67 | 22,39 | 2,9034 | 0,5486 | |||
| EOG / EOG Resources, Inc. | 0,03 | 14,79 | 4,08 | 7,07 | 2,5346 | 0,1846 | |||
| TXN / Texas Instruments Incorporated | 0,02 | 2,14 | 4,06 | 18,02 | 2,5252 | 0,4012 | |||
| SPGI / S&P Global Inc. | 0,01 | -18,88 | 3,81 | -15,84 | 2,3664 | -0,4239 | |||
| ELV / Elevance Health, Inc. | 0,01 | 25,42 | 3,53 | 12,17 | 2,1957 | 0,2524 | |||
| ACN / Accenture plc | 0,01 | -18,97 | 3,47 | -22,37 | 2,1595 | -0,6022 | |||
| FI / Fiserv, Inc. | 0,02 | -19,98 | 3,45 | -37,52 | 2,1421 | -1,2614 | |||
| AXV / AXIS Capital Holdings Limited | 0,03 | -5,29 | 3,29 | -1,91 | 2,0439 | -0,0245 | |||
| C / Citigroup Inc. | 0,04 | -47,07 | 3,11 | -36,54 | 1,9365 | -1,0923 | |||
| REGN / Regeneron Pharmaceuticals, Inc. | 0,01 | -9,48 | 3,06 | -25,08 | 1,9005 | -0,6172 | |||
| WFC / Wells Fargo & Company | 0,04 | 1,15 | 3,04 | 12,89 | 1,8903 | 0,2281 | |||
| GILD / Gilead Sciences, Inc. | 0,03 | -25,62 | 2,99 | -26,42 | 1,8588 | -0,6484 | |||
| COR / Cencora, Inc. | 0,01 | -29,35 | 2,76 | -23,81 | 1,7188 | -0,5209 | |||
| DGX / Quest Diagnostics Incorporated | 0,02 | 17,67 | 2,73 | 24,92 | 1,6957 | 0,3483 | |||
| GNRC / Generac Holdings Inc. | 0,02 | 9,44 | 2,72 | 23,74 | 1,6925 | 0,3349 | |||
| DIS / The Walt Disney Company | 0,02 | 2,67 | 1,6593 | 1,6593 | |||||
| VLTO / Veralto Corporation | 0,03 | 6,76 | 2,55 | 10,63 | 1,5851 | 0,1625 | |||
| TSM / Taiwan Semiconductor Manufacturing Company Limited - Depositary Receipt (Common Stock) | 0,01 | -13,26 | 2,41 | 18,39 | 1,5010 | 0,2420 | |||
| WAB / Westinghouse Air Brake Technologies Corporation | 0,01 | -0,26 | 2,38 | 15,12 | 1,4820 | 0,2043 | |||
| MET / MetLife, Inc. | 0,03 | 67,85 | 2,38 | 68,10 | 1,4782 | 0,6054 | |||
| EA / Electronic Arts Inc. | 0,01 | -17,66 | 2,30 | -9,02 | 1,4305 | -0,1301 | |||
| DKS / DICK'S Sporting Goods, Inc. | 0,01 | 24,97 | 2,18 | 22,65 | 1,3540 | 0,2582 | |||
| MA / Mastercard Incorporated | 0,00 | 29,53 | 2,17 | 32,82 | 1,3487 | 0,3406 | |||
| ULTA / Ulta Beauty, Inc. | 0,00 | -21,98 | 2,04 | -0,44 | 1,2703 | 0,0041 | |||
| CMCSA / Comcast Corporation | 0,06 | -11,62 | 1,96 | -14,50 | 1,2208 | -0,1967 | |||
| CASY / Casey's General Stores, Inc. | 0,00 | -28,08 | 1,93 | -15,44 | 1,2028 | -0,2092 | |||
| HCA / HCA Healthcare, Inc. | 0,01 | 11,54 | 1,93 | 23,70 | 1,1977 | 0,2363 | |||
| T / AT&T Inc. | 0,07 | 1,90 | 1,1829 | 1,1829 | |||||
| CVX / Chevron Corporation | 0,01 | -22,22 | 1,88 | -33,43 | 1,1716 | -0,5753 | |||
| CSX / CSX Corporation | 0,06 | 35,24 | 1,80 | 49,96 | 1,1181 | 0,3779 | |||
| RHHBY / Roche Holding AG - Depositary Receipt (Common Stock) | 0,04 | -6,07 | 1,79 | -6,96 | 1,1141 | -0,0745 | |||
| COP / ConocoPhillips | 0,02 | 1,91 | 1,73 | -12,92 | 1,0729 | -0,1501 | |||
| ROST / Ross Stores, Inc. | 0,01 | -3,22 | 1,61 | -3,36 | 1,0012 | -0,0274 | |||
| JBHT / J.B. Hunt Transport Services, Inc. | 0,01 | -33,88 | 1,61 | -35,83 | 0,9983 | -0,5459 | |||
| A / Agilent Technologies, Inc. | 0,01 | 1,60 | 0,9964 | 0,9964 | |||||
| PSA / Public Storage | 0,01 | 17,68 | 1,60 | 15,43 | 0,9956 | 0,1390 | |||
| UBER / Uber Technologies, Inc. | 0,02 | 1,54 | 0,9578 | 0,9578 | |||||
| OTIS / Otis Worldwide Corporation | 0,02 | 29,67 | 1,51 | 24,46 | 0,9364 | 0,1893 | |||
| PPG / PPG Industries, Inc. | 0,01 | 20,72 | 1,50 | 25,65 | 0,9353 | 0,1960 | |||
| STLD / Steel Dynamics, Inc. | 0,01 | -17,52 | 1,43 | -15,60 | 0,8918 | -0,1569 | |||
| CF / CF Industries Holdings, Inc. | 0,02 | -22,37 | 1,43 | -8,63 | 0,8893 | -0,0766 | |||
| PCAR / PACCAR Inc | 0,01 | 41,47 | 1,39 | 38,13 | 0,8651 | 0,2433 | |||
| LOW / Lowe's Companies, Inc. | 0,01 | 113,51 | 1,35 | 86,11 | 0,8415 | 0,4289 | |||
| NICE / NICE Ltd. - Depositary Receipt (Common Stock) | 0,01 | 3,93 | 1,29 | 13,82 | 0,8045 | 0,1032 | |||
| GEHC / GE HealthCare Technologies Inc. | 0,02 | -47,15 | 1,29 | -51,52 | 0,8032 | -0,8406 | |||
| NKE / NIKE, Inc. | 0,02 | -42,95 | 1,29 | -36,14 | 0,8022 | -0,4449 | |||
| PSX / Phillips 66 | 0,01 | -51,29 | 1,17 | -52,94 | 0,7263 | -0,8056 | |||
| MDLZ / Mondelez International, Inc. | 0,02 | 1,17 | 0,7246 | 0,7246 | |||||
| UTHR / United Therapeutics Corporation | 0,00 | -16,70 | 1,12 | -22,36 | 0,6954 | -0,1935 | |||
| ALLE / Allegion plc | 0,01 | -2,04 | 1,11 | 8,20 | 0,6894 | 0,0571 | |||
| MSM / MSC Industrial Direct Co., Inc. | 0,01 | 23,71 | 1,10 | 35,46 | 0,6868 | 0,1834 | |||
| BXSL / Blackstone Secured Lending Fund | 0,03 | -5,13 | 1,00 | -9,91 | 0,6222 | -0,0629 | |||
| ALSN / Allison Transmission Holdings, Inc. | 0,01 | 4,63 | 0,99 | 3,90 | 0,6135 | 0,0273 | |||
| SBUX / Starbucks Corporation | 0,01 | -50,31 | 0,97 | -53,58 | 0,6044 | -0,6880 | |||
| NVT / nVent Electric plc | 0,01 | -35,10 | 0,92 | -9,33 | 0,5743 | -0,0543 | |||
| LRCX / Lam Research Corporation | 0,01 | -50,21 | 0,84 | -33,39 | 0,5215 | -0,2550 | |||
| ZBRA / Zebra Technologies Corporation | 0,00 | 0,82 | 0,5127 | 0,5127 | |||||
| CW / Curtiss-Wright Corporation | 0,00 | -26,67 | 0,82 | 12,97 | 0,5094 | 0,0616 | |||
| CSCO / Cisco Systems, Inc. | 0,01 | 0,80 | 0,5000 | 0,5000 | |||||
| MTG / MGIC Investment Corporation | 0,03 | -4,11 | 0,80 | 7,84 | 0,4963 | 0,0390 | |||
| BWA / BorgWarner Inc. | 0,02 | -18,69 | 0,78 | -5,02 | 0,4828 | -0,0215 | |||
| CSL / Carlisle Companies Incorporated | 0,00 | 0,77 | 0,4759 | 0,4759 | |||||
| FCN / FTI Consulting, Inc. | 0,00 | -23,37 | 0,66 | -24,60 | 0,4083 | -0,1290 | |||
| RMD / ResMed Inc. | 0,00 | 0,63 | 0,3946 | 0,3946 | |||||
| WHD / Cactus, Inc. | 0,01 | 69,85 | 0,54 | 61,93 | 0,3338 | 0,1293 | |||
| LULU / lululemon athletica inc. | 0,00 | -55,00 | 0,52 | -62,28 | 0,3214 | -0,5234 | |||
| LSTR / Landstar System, Inc. | 0,00 | 0,43 | 0,2654 | 0,2654 | |||||
| JLL / Jones Lang LaSalle Incorporated | 0,00 | 0,32 | 0,2020 | 0,2020 |