Statistiques de base
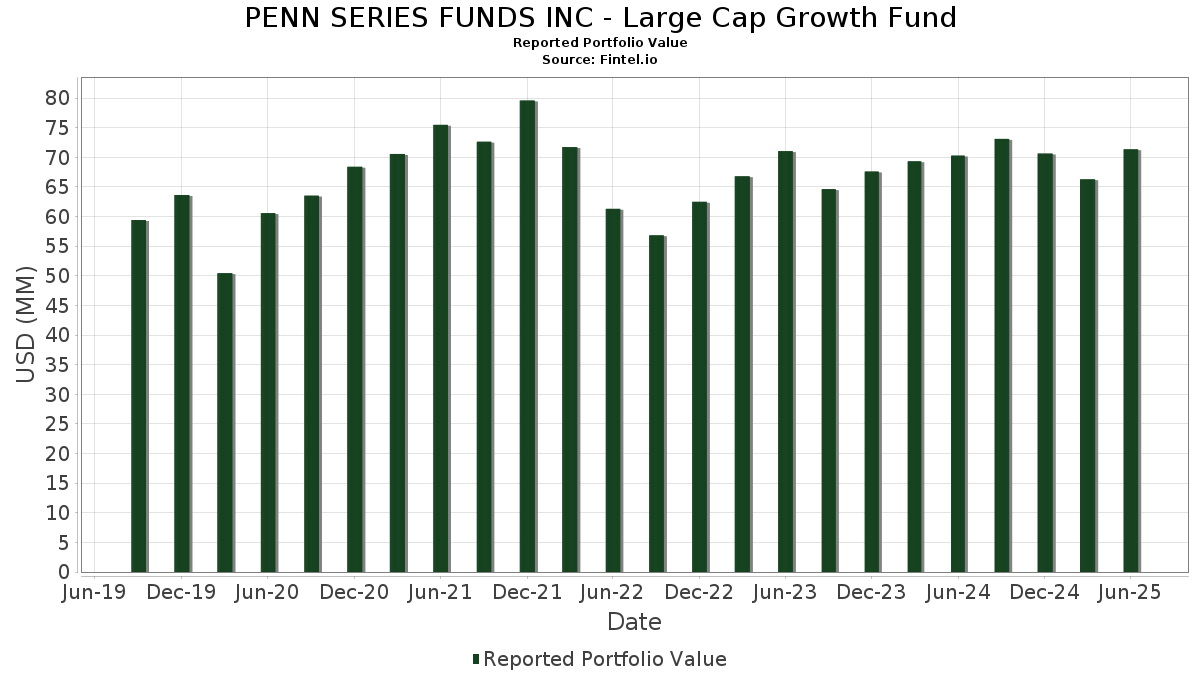
| Valeur du portefeuille | $ 71 350 477 |
| Positions actuelles | 57 |
Dernières positions, performances, ASG (à partir des dépôts 13F, 13D)
PENN SERIES FUNDS INC - Large Cap Growth Fund a déclaré un total de 57 positions dans ses derniers dépôts auprès de la SEC. La valeur la plus récente du portefeuille est calculée à 71 350 477 USD. Les actifs sous gestion réels (ASG) sont cette valeur plus les liquidités (qui ne sont pas divulguées). Les principales positions de PENN SERIES FUNDS INC - Large Cap Growth Fund sont Microsoft Corporation (US:MSFT) , NVIDIA Corporation (US:NVDA) , Apple Inc. (US:AAPL) , Visa Inc. (US:V) , and Accenture plc (US:ACN) .
Meilleures augmentations ce trimestre
Nous utilisons la variation de l'allocation du portefeuille car il s'agit de l'indicateur le plus significatif. Les changements peuvent être dus à des transactions ou à des variations de prix des actions.
| Titre | Actions (en millions) |
Valeur ($ en millions) |
% du portefeuille | ΔPortefeuille % |
|---|---|---|---|---|
| 0,02 | 10,81 | 15,1525 | 2,4858 | |
| 0,03 | 4,54 | 6,3623 | 1,6283 | |
| 0,00 | 1,57 | 2,2063 | 0,6410 | |
| 0,01 | 1,42 | 1,9920 | 0,4085 | |
| 0,00 | 1,62 | 2,2694 | 0,3949 | |
| 0,02 | 1,59 | 2,2323 | 0,3835 | |
| 0,02 | 1,63 | 2,2913 | 0,3769 | |
| 0,00 | 0,70 | 0,9795 | 0,3498 | |
| 0,01 | 0,99 | 1,3948 | 0,2455 | |
| 0,01 | 1,64 | 2,3051 | 0,2390 |
Principales baisses ce trimestre
Nous utilisons la variation de l'allocation du portefeuille car il s'agit de l'indicateur le plus significatif. Les changements peuvent être dus à des transactions ou à des variations de prix des actions.
| Titre | Actions (en millions) |
Valeur ($ en millions) |
% du portefeuille | ΔPortefeuille % |
|---|---|---|---|---|
| 0,02 | 3,32 | 4,6578 | -0,8120 | |
| 0,00 | 1,60 | 2,2479 | -0,6414 | |
| 0,02 | 1,53 | 2,1397 | -0,5187 | |
| 0,01 | 0,87 | 1,2210 | -0,4752 | |
| 0,00 | 0,40 | 0,5611 | -0,4688 | |
| 0,01 | 0,70 | 0,9858 | -0,3966 | |
| 0,01 | 0,47 | 0,6595 | -0,3964 | |
| 0,01 | 2,07 | 2,9003 | -0,3840 | |
| 0,01 | 1,10 | 1,5373 | -0,3562 | |
| 0,02 | 1,43 | 2,0114 | -0,3538 |
Déclarations 13F et dépôts de fonds
Ce formulaire a été déposé le 2025-08-26 pour la période de déclaration 2025-06-30. Cliquez sur l'icône du lien pour voir l'historique complet des transactions.
Mettre à niveau pour débloquer les données premium et exporter vers Excel ![]() .
.
| Titre | Type | Prix moyen de l'action | Actions (en millions) |
ΔActions (%) |
ΔActions (%) |
Valeur ($ en millions) |
Portefeuille (%) |
ΔPortefeuille (%) |
|
|---|---|---|---|---|---|---|---|---|---|
| MSFT / Microsoft Corporation | 0,02 | -2,78 | 10,81 | 28,82 | 15,1525 | 2,4858 | |||
| NVDA / NVIDIA Corporation | 0,03 | -0,72 | 4,54 | 44,72 | 6,3623 | 1,6283 | |||
| AAPL / Apple Inc. | 0,02 | -0,72 | 3,32 | -8,28 | 4,6578 | -0,8120 | |||
| V / Visa Inc. | 0,01 | -0,71 | 2,82 | 0,61 | 3,9595 | -0,2795 | |||
| ACN / Accenture plc | 0,01 | -0,72 | 2,07 | -4,92 | 2,9003 | -0,3840 | |||
| CRM / Salesforce, Inc. | 0,01 | 18,24 | 1,64 | 20,18 | 2,3051 | 0,2390 | |||
| TRU / TransUnion | 0,02 | 21,55 | 1,63 | 28,97 | 2,2913 | 0,3769 | |||
| GOOGL / Alphabet Inc. | 0,01 | -15,57 | 1,63 | -3,78 | 2,2878 | -0,2726 | |||
| ETN / Eaton Corporation plc | 0,00 | -0,72 | 1,62 | 30,38 | 2,2694 | 0,3949 | |||
| AON / Aon plc | 0,00 | -6,28 | 1,60 | -16,20 | 2,2479 | -0,6414 | |||
| APH / Amphenol Corporation | 0,02 | -13,64 | 1,59 | 30,07 | 2,2323 | 0,3835 | |||
| HUBB / Hubbell Incorporated | 0,00 | 22,98 | 1,57 | 51,83 | 2,2063 | 0,6410 | |||
| STE / STERIS plc | 0,01 | -0,72 | 1,57 | 5,24 | 2,1960 | -0,0513 | |||
| CHD / Church & Dwight Co., Inc. | 0,02 | -0,71 | 1,53 | -13,30 | 2,1397 | -0,5187 | |||
| CMS / CMS Energy Corporation | 0,02 | -0,71 | 1,43 | -8,43 | 2,0114 | -0,3538 | |||
| AMT / American Tower Corporation | 0,01 | -0,71 | 1,42 | 0,85 | 1,9941 | -0,1352 | |||
| TSM / Taiwan Semiconductor Manufacturing Company Limited - Depositary Receipt (Common Stock) | 0,01 | -0,71 | 1,42 | 35,50 | 1,9920 | 0,4085 | |||
| A / Agilent Technologies, Inc. | 0,01 | -0,71 | 1,32 | 0,15 | 1,8462 | -0,1387 | |||
| NNND / Tencent Holdings Limited | 0,02 | -0,52 | 1,23 | 0,33 | 1,7256 | -0,1268 | |||
| PEP / PepsiCo, Inc. | 0,01 | -0,72 | 1,10 | -12,60 | 1,5373 | -0,3562 | |||
| BDX / Becton, Dickinson and Company | 0,01 | 22,68 | 1,08 | -7,78 | 1,5140 | -0,2533 | |||
| DHR / Danaher Corporation | 0,01 | 35,63 | 0,99 | 30,62 | 1,3948 | 0,2455 | |||
| MA / Mastercard Incorporated | 0,00 | -0,74 | 0,98 | 1,76 | 1,3804 | -0,0803 | |||
| TE Connectivity PLC / EC (IE000IVNQZ81) | 0,01 | -0,72 | 0,98 | 18,62 | 1,3756 | 0,1255 | |||
| MCO / Moody's Corporation | 0,00 | -0,73 | 0,95 | 6,96 | 1,3369 | -0,0096 | |||
| DIS / The Walt Disney Company | 0,01 | -0,71 | 0,92 | 24,90 | 1,2872 | 0,1760 | |||
| HLT / Hilton Worldwide Holdings Inc. | 0,00 | -0,71 | 0,90 | 16,23 | 1,2555 | 0,0921 | |||
| EL / The Estée Lauder Companies Inc. | 0,01 | -0,72 | 0,89 | 21,47 | 1,2545 | 0,1430 | |||
| SCHW / The Charles Schwab Corporation | 0,01 | -0,71 | 0,88 | 15,70 | 1,2308 | 0,0855 | |||
| FI / Fiserv, Inc. | 0,01 | -0,71 | 0,87 | -22,53 | 1,2210 | -0,4752 | |||
| MKC / McCormick & Company, Incorporated | 0,01 | -0,72 | 0,86 | -8,59 | 1,2094 | -0,2147 | |||
| ROST / Ross Stores, Inc. | 0,01 | -0,72 | 0,85 | -0,82 | 1,1863 | -0,1026 | |||
| MMC / Marsh & McLennan Companies, Inc. | 0,00 | -0,72 | 0,81 | -10,96 | 1,1385 | -0,2399 | |||
| SHW / The Sherwin-Williams Company | 0,00 | -0,72 | 0,80 | -2,32 | 1,1231 | -0,1159 | |||
| OTIS / Otis Worldwide Corporation | 0,01 | -0,72 | 0,79 | -4,69 | 1,1121 | -0,1451 | |||
| MTD / Mettler-Toledo International Inc. | 0,00 | -0,78 | 0,74 | -1,33 | 1,0409 | -0,0949 | |||
| BAM / Brookfield Asset Management Ltd. | 0,01 | -0,72 | 0,73 | 13,45 | 1,0300 | 0,0529 | |||
| TJX / The TJX Companies, Inc. | 0,01 | -0,71 | 0,72 | 0,70 | 1,0153 | -0,0708 | |||
| BSX / Boston Scientific Corporation | 0,01 | -23,03 | 0,72 | -17,95 | 1,0123 | -0,3179 | |||
| NKE / NIKE, Inc. | 0,01 | -31,38 | 0,70 | -23,17 | 0,9858 | -0,3966 | |||
| OR / L'Oréal S.A. | 0,00 | 22,17 | 0,70 | 87,13 | 0,9795 | 0,3498 | |||
| MC / LVMH Moët Hennessy - Louis Vuitton, Société Européenne | 0,00 | -0,69 | 0,68 | -16,15 | 0,9474 | -0,2682 | |||
| SBGSY / Schneider Electric S.E. - Depositary Receipt (Common Stock) | 0,00 | -0,73 | 0,66 | 15,49 | 0,9204 | 0,0619 | |||
| POOL / Pool Corporation | 0,00 | 45,19 | 0,60 | 33,11 | 0,8455 | 0,1606 | |||
| CP / Canadian Pacific Kansas City Limited | 0,01 | -19,14 | 0,60 | -8,59 | 0,8358 | -0,1501 | |||
| CME / CME Group Inc. | 0,00 | -0,72 | 0,57 | 3,28 | 0,7953 | -0,0351 | |||
| TXN / Texas Instruments Incorporated | 0,00 | -0,71 | 0,49 | 14,88 | 0,6931 | 0,0425 | |||
| GGG / Graco Inc. | 0,01 | -0,71 | 0,48 | 2,35 | 0,6736 | -0,0361 | |||
| ADI / Analog Devices, Inc. | 0,00 | -32,23 | 0,47 | -20,00 | 0,6624 | -0,2294 | |||
| IJF / ICON Public Limited Company | 0,00 | -0,71 | 0,47 | -17,37 | 0,6605 | -0,2013 | |||
| Aptiv PLC / EC (JE00BTDN8H13) | 0,01 | -41,33 | 0,47 | -32,76 | 0,6595 | -0,3964 | |||
| IT / Gartner, Inc. | 0,00 | -39,08 | 0,40 | -41,35 | 0,5611 | -0,4688 | |||
| VEEV / Veeva Systems Inc. | 0,00 | -0,74 | 0,39 | 23,25 | 0,5435 | 0,0692 | |||
| TMO / Thermo Fisher Scientific Inc. | 0,00 | -0,76 | 0,37 | -19,08 | 0,5179 | -0,1718 | |||
| TFDXX / Blackrock Liquidity Funds - BlackRock Liquidity Funds FedFund Portfolio Institutional Class | 0,32 | -26,84 | 0,32 | -26,85 | 0,4434 | -0,2093 | |||
| SYK / Stryker Corporation | 0,00 | -0,75 | 0,31 | 5,37 | 0,4415 | -0,0092 | |||
| SBUX / Starbucks Corporation | 0,00 | -0,73 | 0,31 | -7,42 | 0,4387 | -0,0707 |