Statistiques de base
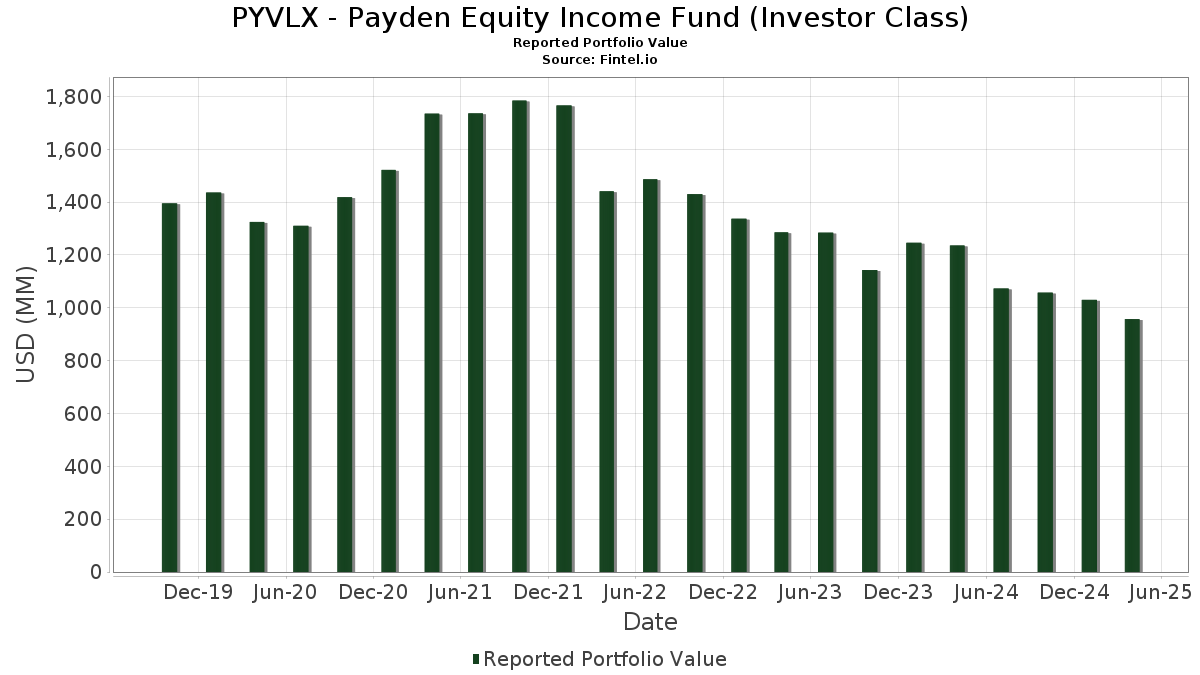
| Valeur du portefeuille | $ 957 394 721 |
| Positions actuelles | 79 |
Dernières positions, performances, ASG (à partir des dépôts 13F, 13D)
PYVLX - Payden Equity Income Fund (Investor Class) a déclaré un total de 79 positions dans ses derniers dépôts auprès de la SEC. La valeur la plus récente du portefeuille est calculée à 957 394 721 USD. Les actifs sous gestion réels (ASG) sont cette valeur plus les liquidités (qui ne sont pas divulguées). Les principales positions de PYVLX - Payden Equity Income Fund (Investor Class) sont Payden & Rygel Investment Group - Payden Cash Reserves Money Market Fund (US:PBHXX) , JPMorgan Chase & Co. (US:JPM) , Duke Energy Corporation (US:DUK) , Walmart Inc. (US:WMT) , and General Electric Company (US:GE) . Les nouvelles positions de PYVLX - Payden Equity Income Fund (Investor Class) incluent HCA Healthcare, Inc. (US:HCA) , Service Corporation International (US:SCI) , Booking Holdings Inc. (US:BKNG) , The Cigna Group (US:CI) , and Quest Diagnostics Incorporated (US:DGX) .
Meilleures augmentations ce trimestre
Nous utilisons la variation de l'allocation du portefeuille car il s'agit de l'indicateur le plus significatif. Les changements peuvent être dus à des transactions ou à des variations de prix des actions.
| Titre | Actions (en millions) |
Valeur ($ en millions) |
% du portefeuille | ΔPortefeuille % |
|---|---|---|---|---|
| 79,24 | 79,24 | 8,2231 | 7,1774 | |
| 0,04 | 14,84 | 1,5398 | 1,5398 | |
| 0,12 | 9,88 | 1,0248 | 1,0248 | |
| 0,12 | 18,96 | 1,9671 | 0,9549 | |
| 0,00 | 7,65 | 0,7937 | 0,7937 | |
| 0,02 | 7,51 | 0,7798 | 0,7798 | |
| 0,04 | 7,40 | 0,7675 | 0,7675 | |
| 0,10 | 7,32 | 0,7592 | 0,7592 | |
| 0,06 | 7,24 | 0,7515 | 0,7515 | |
| 0,96 | 7,16 | 0,7433 | 0,7433 |
Principales baisses ce trimestre
Nous utilisons la variation de l'allocation du portefeuille car il s'agit de l'indicateur le plus significatif. Les changements peuvent être dus à des transactions ou à des variations de prix des actions.
| Titre | Actions (en millions) |
Valeur ($ en millions) |
% du portefeuille | ΔPortefeuille % |
|---|---|---|---|---|
| 0,15 | 9,74 | 1,0112 | -1,2899 | |
| 0,82 | 13,62 | 1,4138 | -1,1908 | |
| 0,07 | 10,02 | 1,0394 | -1,0820 | |
| 0,17 | 15,93 | 1,6526 | -1,0536 | |
| 0,03 | 9,46 | 0,9817 | -0,7124 | |
| 0,02 | 9,23 | 0,9580 | -0,7065 | |
| 0,03 | 9,87 | 1,0242 | -0,6938 | |
| 0,03 | 9,68 | 1,0050 | -0,5583 | |
| 0,05 | 9,89 | 1,0263 | -0,5305 | |
| 0,04 | 7,10 | 0,7368 | -0,5282 |
Déclarations 13F et dépôts de fonds
Ce formulaire a été déposé le 2025-06-25 pour la période de déclaration 2025-04-30. Cliquez sur l'icône du lien pour voir l'historique complet des transactions.
Mettre à niveau pour débloquer les données premium et exporter vers Excel ![]() .
.
| Titre | Type | Prix moyen de l'action | Actions (en millions) |
ΔActions (%) |
ΔActions (%) |
Valeur ($ en millions) |
Portefeuille (%) |
ΔPortefeuille (%) |
|
|---|---|---|---|---|---|---|---|---|---|
| PBHXX / Payden & Rygel Investment Group - Payden Cash Reserves Money Market Fund | 79,24 | 634,58 | 79,24 | 634,60 | 8,2231 | 7,1774 | |||
| JPM / JPMorgan Chase & Co. | 0,14 | 16,73 | 35,15 | 6,83 | 3,6478 | 0,4580 | |||
| DUK / Duke Energy Corporation | 0,23 | 0,00 | 28,04 | 8,96 | 2,9098 | 0,4150 | |||
| WMT / Walmart Inc. | 0,23 | 0,00 | 22,03 | -0,93 | 2,2858 | 0,1305 | |||
| GE / General Electric Company | 0,11 | -11,46 | 21,65 | -12,34 | 2,2462 | -0,1476 | |||
| MCK / McKesson Corporation | 0,03 | 0,00 | 20,10 | 19,85 | 2,0859 | 0,4600 | |||
| TMUS / T-Mobile US, Inc. | 0,08 | 10,10 | 19,93 | 16,70 | 2,0681 | 0,4126 | |||
| WFC / Wells Fargo & Company | 0,28 | -6,14 | 19,77 | 12,32 | 2,0515 | 0,4081 | |||
| MS / Morgan Stanley | 0,17 | 0,00 | 19,08 | -16,62 | 1,9799 | -0,2384 | |||
| PG / The Procter & Gamble Company | 0,12 | 85,37 | 18,96 | 81,56 | 1,9671 | 0,9549 | |||
| BAC / Bank of America Corporation | 0,45 | 0,00 | 17,93 | -13,86 | 1,8606 | -0,1573 | |||
| SYK / Stryker Corporation | 0,05 | 0,00 | 17,91 | -4,44 | 1,8586 | 0,0417 | |||
| SPGI / S&P Global Inc. | 0,03 | 27,07 | 16,90 | 21,86 | 1,7539 | 0,4094 | |||
| MCD / McDonald's Corporation | 0,05 | 0,00 | 16,88 | 10,72 | 1,7514 | 0,2737 | |||
| V / Visa Inc. | 0,05 | 0,00 | 16,69 | 1,08 | 1,7317 | 0,1313 | |||
| WMB / The Williams Companies, Inc. | 0,28 | 0,00 | 16,64 | 5,66 | 1,7267 | 0,2001 | |||
| CRH / CRH plc | 0,17 | -40,79 | 15,93 | -42,95 | 1,6526 | -1,0536 | |||
| AXP / American Express Company | 0,06 | 0,00 | 15,66 | -16,08 | 1,6256 | -0,1839 | |||
| D / Dominion Energy, Inc. | 0,28 | 0,00 | 14,95 | -2,18 | 1,5519 | 0,0699 | |||
| HCA / HCA Healthcare, Inc. | 0,04 | 14,84 | 1,5398 | 1,5398 | |||||
| XOM / Exxon Mobil Corporation | 0,14 | 0,00 | 14,76 | -1,13 | 1,5313 | 0,0845 | |||
| CSCO / Cisco Systems, Inc. | 0,25 | 0,00 | 14,66 | -4,74 | 1,5211 | 0,0295 | |||
| IBM / International Business Machines Corporation | 0,06 | 0,00 | 14,34 | -5,43 | 1,4881 | 0,0182 | |||
| EPD / Enterprise Products Partners L.P. - Limited Partnership | 0,47 | -24,99 | 13,98 | -31,31 | 1,4512 | -0,5223 | |||
| LIN / Linde plc | 0,03 | 0,00 | 13,82 | 1,59 | 1,4345 | 0,1154 | |||
| ET / Energy Transfer LP - Limited Partnership | 0,82 | -37,21 | 13,62 | -49,29 | 1,4138 | -1,1908 | |||
| SBGSY / Schneider Electric S.E. - Depositary Receipt (Common Stock) | 0,06 | -16,83 | 13,60 | -24,41 | 1,4115 | -0,3329 | |||
| SSNC / SS&C Technologies Holdings, Inc. | 0,18 | 78,18 | 13,34 | 66,40 | 1,3839 | 0,6070 | |||
| MET / MetLife, Inc. | 0,17 | 0,00 | 12,63 | -12,88 | 1,3109 | -0,0947 | |||
| VZ / Verizon Communications Inc. | 0,27 | 0,00 | 11,71 | 11,86 | 1,2148 | 0,2003 | |||
| LLY / Eli Lilly and Company | 0,01 | 78,26 | 11,06 | 97,59 | 1,1474 | 0,6049 | |||
| GOOGL / Alphabet Inc. | 0,07 | 0,00 | 10,66 | -22,16 | 1,1057 | -0,2214 | |||
| ACM / AECOM | 0,11 | 0,00 | 10,57 | -6,44 | 1,0964 | 0,0017 | |||
| MSFT / Microsoft Corporation | 0,03 | -26,48 | 10,32 | -29,99 | 1,0705 | -0,3579 | |||
| JNJ / Johnson & Johnson | 0,06 | 75,41 | 10,14 | 80,21 | 1,0527 | 0,5070 | |||
| ITT / ITT Inc. | 0,07 | -49,55 | 10,02 | -54,23 | 1,0394 | -1,0820 | |||
| AVB / AvalonBay Communities, Inc. | 0,05 | -35,03 | 9,89 | -38,41 | 1,0263 | -0,5305 | |||
| SCI / Service Corporation International | 0,12 | 9,88 | 1,0248 | 1,0248 | |||||
| CB / Chubb Limited | 0,03 | -46,68 | 9,87 | -45,99 | 1,0242 | -0,6938 | |||
| DHR / Danaher Corporation | 0,05 | 88,08 | 9,75 | 46,99 | 1,0115 | 0,4975 | |||
| LMT / Lockheed Martin Corporation | 0,02 | 50,00 | 9,75 | 57,63 | 1,0114 | 0,4702 | |||
| NEE / NextEra Energy, Inc. | 0,15 | -56,07 | 9,74 | -58,95 | 1,0112 | -1,2899 | |||
| ETN / Eaton Corporation plc | 0,03 | -33,40 | 9,68 | -39,95 | 1,0050 | -0,5583 | |||
| KO / The Coca-Cola Company | 0,13 | -22,38 | 9,66 | -11,29 | 1,0028 | -0,0532 | |||
| META / Meta Platforms, Inc. | 0,02 | -15,38 | 9,66 | -32,59 | 1,0027 | -0,3870 | |||
| RTX / RTX Corporation | 0,08 | -22,59 | 9,64 | 11,04 | 1,0000 | 0,3273 | |||
| HD / The Home Depot, Inc. | 0,03 | -21,73 | 9,48 | -31,51 | 0,9839 | -0,3581 | |||
| ABBV / AbbVie Inc. | 0,05 | -16,81 | 9,46 | -11,74 | 0,9819 | -0,0574 | |||
| AJG / Arthur J. Gallagher & Co. | 0,03 | -49,05 | 9,46 | -45,87 | 0,9817 | -0,7124 | |||
| COST / Costco Wholesale Corporation | 0,01 | 0,00 | 9,45 | 1,49 | 0,9804 | 0,0780 | |||
| SPG / Simon Property Group, Inc. | 0,06 | -30,22 | 9,41 | -36,83 | 0,9766 | -0,4678 | |||
| AMP / Ameriprise Financial, Inc. | 0,02 | -37,97 | 9,23 | -46,24 | 0,9580 | -0,7065 | |||
| BKNG / Booking Holdings Inc. | 0,00 | 7,65 | 0,7937 | 0,7937 | |||||
| UNH / UnitedHealth Group Incorporated | 0,02 | -25,10 | 7,61 | -43,20 | 0,7899 | -0,5091 | |||
| AMT / American Tower Corporation | 0,03 | -42,81 | 7,53 | -39,63 | 0,7813 | -0,3912 | |||
| CI / The Cigna Group | 0,02 | 7,51 | 0,7798 | 0,7798 | |||||
| MDLZ / Mondelez International, Inc. | 0,11 | -27,40 | 7,47 | -27,78 | 0,7756 | -0,1972 | |||
| AAPL / Apple Inc. | 0,04 | 0,00 | 7,44 | -9,96 | 0,7718 | -0,0289 | |||
| DGX / Quest Diagnostics Incorporated | 0,04 | 7,40 | 0,7675 | 0,7675 | |||||
| ORCL / Oracle Corporation | 0,05 | -30,31 | 7,35 | -42,33 | 0,7623 | -0,4725 | |||
| NDAQ / Nasdaq, Inc. | 0,10 | 7,32 | 0,7592 | 0,7592 | |||||
| J / Jacobs Solutions Inc. | 0,06 | 7,24 | 0,7515 | 0,7515 | |||||
| GILD / Gilead Sciences, Inc. | 0,07 | -73,38 | 7,17 | -58,70 | 0,7441 | -0,2267 | |||
| AIVAF / Aviva plc | 0,96 | 7,16 | 0,7433 | 0,7433 | |||||
| CTVA / Corteva, Inc. | 0,12 | 7,16 | 0,7430 | 0,7430 | |||||
| TJX / The TJX Companies, Inc. | 0,06 | 7,10 | 0,7371 | 0,7371 | |||||
| AMZN / Amazon.com, Inc. | 0,04 | -29,87 | 7,10 | -45,59 | 0,7368 | -0,5282 | |||
| BLK / BlackRock, Inc. | 0,01 | 7,04 | 0,7305 | 0,7305 | |||||
| PLD / Prologis, Inc. | 0,07 | 0,00 | 6,99 | -14,30 | 0,7254 | -0,0653 | |||
| AHODF / Koninklijke Ahold Delhaize N.V. | 0,17 | 6,89 | 0,7150 | 0,7150 | |||||
| GLW / Corning Incorporated | 0,15 | -60,03 | 6,70 | -46,60 | 0,6950 | -0,2716 | |||
| CRM / Salesforce, Inc. | 0,02 | 0,00 | 6,31 | -21,36 | 0,6553 | -0,1231 | |||
| AVGO / Broadcom Inc. | 0,03 | 0,00 | 4,87 | -13,02 | 0,5053 | -0,0374 | |||
| ASML / ASML Holding N.V. | 0,01 | 0,00 | 4,69 | -11,99 | 0,4862 | -0,0298 | |||
| US514666AN65 / Land O'Lakes Inc. | 2,30 | -0,61 | 0,2383 | 0,0143 | |||||
| S&P500 EMINI / DE (000000000) | 0,60 | 0,0621 | 0,0621 | ||||||
| EUR/USD FORWARD / DFE (000000000) | 0,04 | 0,0044 | 0,0044 | ||||||
| USD/GBP FORWARD / DFE (000000000) | 0,01 | 0,0007 | 0,0007 | ||||||
| MUR / Murphy Oil Corporation | 0,00 | -100,00 | 0,00 | -100,00 | -0,3813 | ||||
| USD/EUR FORWARD / DFE (000000000) | -0,75 | -0,0780 | -0,0780 |