Statistiques de base
| Profil de l'initié | Paralel Advisors |
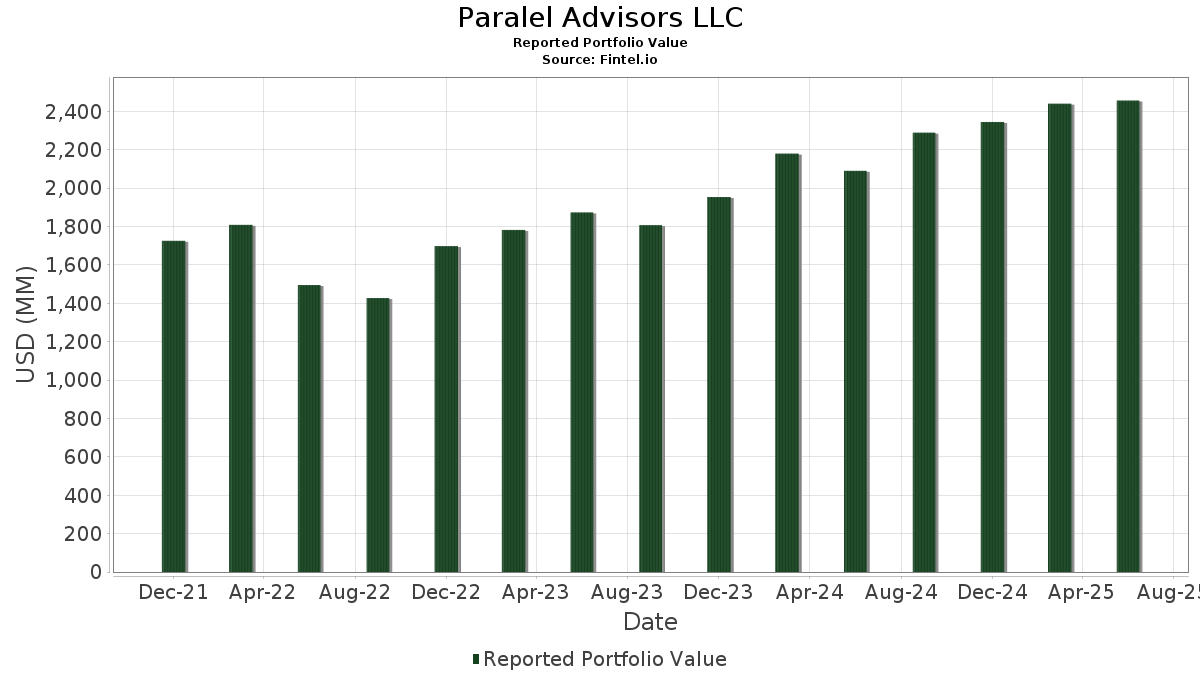
| Valeur du portefeuille | $ 2 456 155 589 |
| Positions actuelles | 107 |
Dernières positions, performances, ASG (à partir des dépôts 13F, 13D)
Paralel Advisors LLC a déclaré un total de 107 positions dans ses derniers dépôts auprès de la SEC. La valeur la plus récente du portefeuille est calculée à 2 456 155 589 USD. Les actifs sous gestion réels (ASG) sont cette valeur plus les liquidités (qui ne sont pas divulguées). Les principales positions de Paralel Advisors LLC sont Berkshire Hathaway Inc. (US:BRK.A) , JPMorgan Chase & Co. (US:JPM) , Berkshire Hathaway Inc. (US:BRK.B) , Enterprise Products Partners L.P. - Limited Partnership (US:EPD) , and Microsoft Corporation (US:MSFT) . Les nouvelles positions de Paralel Advisors LLC incluent Maplebear Inc. (US:CART) , DraftKings Inc. (US:DKNG) , Forward Air Corporation (US:FWRD) , Vistra Corp. (US:VST) , and Pegasystems Inc. (US:PEGA) .
Meilleures augmentations ce trimestre
Nous utilisons la variation de l'allocation du portefeuille car il s'agit de l'indicateur le plus significatif. Les changements peuvent être dus à des transactions ou à des variations de prix des actions.
| Titre | Actions (en millions) |
Valeur ($ en millions) |
% du portefeuille | ΔPortefeuille % |
|---|---|---|---|---|
| 1,03 | 298,03 | 11,9531 | 1,6173 | |
| 0,70 | 31,67 | 1,2893 | 1,2893 | |
| 0,60 | 25,73 | 1,0477 | 1,0477 | |
| 0,97 | 23,93 | 0,9741 | 0,9741 | |
| 0,20 | 99,48 | 3,9899 | 0,9127 | |
| 0,30 | 81,01 | 3,2489 | 0,7931 | |
| 0,75 | 68,43 | 2,7445 | 0,3382 | |
| 1,24 | 86,03 | 3,4505 | 0,3141 | |
| 0,10 | 33,49 | 1,3636 | 0,2057 | |
| 0,10 | 38,82 | 1,5570 | 0,2052 |
Principales baisses ce trimestre
Nous utilisons la variation de l'allocation du portefeuille car il s'agit de l'indicateur le plus significatif. Les changements peuvent être dus à des transactions ou à des variations de prix des actions.
| Titre | Actions (en millions) |
Valeur ($ en millions) |
% du portefeuille | ΔPortefeuille % |
|---|---|---|---|---|
| 0,00 | 749,21 | 30,0486 | -3,5937 | |
| 0,27 | 26,40 | 1,0589 | -0,7223 | |
| 0,25 | 121,93 | 4,8902 | -0,5889 | |
| 3,65 | 113,19 | 4,5396 | -0,5679 | |
| 0,58 | 86,69 | 3,4767 | -0,2964 | |
| 0,68 | 46,07 | 1,8477 | -0,2950 | |
| 0,00 | 0,00 | -0,1300 | ||
| 0,05 | 2,65 | 0,1061 | -0,0802 | |
| 0,02 | 2,21 | 0,0886 | -0,0757 | |
| 0,05 | 2,33 | 0,0936 | -0,0637 |
Déclarations 13F et dépôts de fonds
Ce formulaire a été déposé le 2025-07-30 pour la période de déclaration 2025-06-30. Cliquez sur l'icône du lien pour voir l'historique complet des transactions.
Mettre à niveau pour débloquer les données premium et exporter vers Excel ![]() .
.
| Titre | Type | Prix moyen de l'action | Actions (en millions) |
ΔActions (%) |
ΔActions (%) |
Valeur ($ en millions) |
Portefeuille (%) |
ΔPortefeuille (%) |
|
|---|---|---|---|---|---|---|---|---|---|
| BRK.A / Berkshire Hathaway Inc. | 0,00 | 0,00 | 749,21 | -8,72 | 30,0486 | -3,5937 | |||
| JPM / JPMorgan Chase & Co. | 1,03 | 0,00 | 298,03 | 18,19 | 11,9531 | 1,6173 | |||
| BRK.B / Berkshire Hathaway Inc. | 0,25 | 0,00 | 121,93 | -8,79 | 4,8902 | -0,5889 | |||
| EPD / Enterprise Products Partners L.P. - Limited Partnership | 3,65 | 0,00 | 113,19 | -9,17 | 4,5396 | -0,5679 | |||
| MSFT / Microsoft Corporation | 0,20 | 0,00 | 99,48 | 32,50 | 3,9899 | 0,9127 | |||
| YUM / Yum! Brands, Inc. | 0,58 | 0,00 | 86,69 | -5,83 | 3,4767 | -0,2964 | |||
| CSCO / Cisco Systems, Inc. | 1,24 | 0,00 | 86,03 | 12,43 | 3,4505 | 0,3141 | |||
| EVR / Evercore Inc. | 0,30 | 0,00 | 81,01 | 35,20 | 3,2489 | 0,7931 | |||
| UTF / Cohen & Steers Infrastructure Fund, Inc | 2,75 | 0,00 | 74,11 | 5,48 | 2,9724 | 0,0926 | |||
| SCHW / The Charles Schwab Corporation | 0,75 | 0,00 | 68,43 | 16,56 | 2,7445 | 0,3382 | |||
| TRV / The Travelers Companies, Inc. | 0,22 | 0,00 | 58,86 | 1,16 | 2,3964 | 0,0117 | |||
| GFL / GFL Environmental Inc. | 1,00 | 0,00 | 50,46 | 4,45 | 2,0238 | 0,0437 | |||
| EBAY / eBay Inc. | 0,65 | 0,00 | 48,40 | 9,94 | 1,9412 | 0,1367 | |||
| SWK / Stanley Black & Decker, Inc. | 0,68 | 0,00 | 46,07 | -11,87 | 1,8477 | -0,2950 | |||
| PYPL / PayPal Holdings, Inc. | 0,54 | 0,65 | 40,20 | 14,64 | 1,6124 | 0,1750 | |||
| CAT / Caterpillar Inc. | 0,10 | 0,00 | 38,82 | 17,71 | 1,5570 | 0,2052 | |||
| AXP / American Express Company | 0,10 | 0,00 | 33,49 | 18,56 | 1,3636 | 0,2057 | |||
| CART / Maplebear Inc. | 0,70 | 31,67 | 1,2893 | 1,2893 | |||||
| IBP / Installed Building Products, Inc. | 0,17 | 0,00 | 29,75 | 5,17 | 1,1933 | 0,0337 | |||
| WMT / Walmart Inc. | 0,27 | -45,45 | 26,40 | -39,25 | 1,0589 | -0,7223 | |||
| DKNG / DraftKings Inc. | 0,60 | 25,73 | 1,0477 | 1,0477 | |||||
| FWRD / Forward Air Corporation | 0,97 | 23,93 | 0,9741 | 0,9741 | |||||
| FWRG / First Watch Restaurant Group, Inc. | 0,90 | 0,00 | 14,44 | -3,66 | 0,5790 | -0,0352 | |||
| LAMR / Lamar Advertising Company | 0,04 | 0,00 | 4,51 | 6,67 | 0,1836 | 0,0103 | |||
| VST / Vistra Corp. | 0,02 | 4,41 | 0,1795 | 0,1795 | |||||
| JBL / Jabil Inc. | 0,02 | 4,54 | 4,28 | 67,59 | 0,1718 | 0,0670 | |||
| PEGA / Pegasystems Inc. | 0,08 | 4,15 | 0,1691 | 0,1691 | |||||
| FTDR / Frontdoor, Inc. | 0,07 | 4,10 | 0,1644 | 0,1644 | |||||
| EME / EMCOR Group, Inc. | 0,01 | 0,85 | 3,87 | 45,94 | 0,1551 | 0,0465 | |||
| CIEN / Ciena Corporation | 0,04 | -13,11 | 3,60 | 16,95 | 0,1442 | 0,0182 | |||
| VTR / Ventas, Inc. | 0,06 | 0,00 | 3,47 | -8,15 | 0,1414 | -0,0136 | |||
| CAH / Cardinal Health, Inc. | 0,02 | -13,75 | 3,26 | 5,17 | 0,1307 | 0,0037 | |||
| WTS / Watts Water Technologies, Inc. | 0,01 | 3,22 | 0,1310 | 0,1310 | |||||
| ADSK / Autodesk, Inc. | 0,01 | 3,16 | 0,1286 | 0,1286 | |||||
| NDAQ / Nasdaq, Inc. | 0,04 | -11,47 | 3,15 | 4,38 | 0,1263 | 0,0026 | |||
| LDOS / Leidos Holdings, Inc. | 0,02 | 3,39 | 3,12 | 20,91 | 0,1253 | 0,0194 | |||
| CCI / Crown Castle Inc. | 0,03 | 0,00 | 3,08 | -1,44 | 0,1236 | -0,0046 | |||
| QLYS / Qualys, Inc. | 0,02 | 40,98 | 3,03 | 59,98 | 0,1216 | 0,0439 | |||
| NYT / The New York Times Company | 0,05 | 3,02 | 0,1228 | 0,1228 | |||||
| ACA / Arcosa, Inc. | 0,03 | 3,00 | 0,1223 | 0,1223 | |||||
| NKE / NIKE, Inc. | 0,04 | 2,99 | 0,1217 | 0,1217 | |||||
| GEN / Gen Digital Inc. | 0,10 | 2,96 | 0,1205 | 0,1205 | |||||
| BOX / Box, Inc. | 0,09 | -2,35 | 2,96 | 8,15 | 0,1186 | 0,0065 | |||
| IRDM / Iridium Communications Inc. | 0,10 | 1,89 | 2,95 | 12,51 | 0,1183 | 0,0109 | |||
| NTNX / Nutanix, Inc. | 0,04 | 2,93 | 0,1191 | 0,1191 | |||||
| KEYS / Keysight Technologies, Inc. | 0,02 | 11,13 | 2,92 | 21,59 | 0,1190 | 0,0205 | |||
| MCK / McKesson Corporation | 0,00 | 2,91 | 0,1184 | 0,1184 | |||||
| COR / Cencora, Inc. | 0,01 | -6,98 | 2,88 | 0,31 | 0,1156 | -0,0022 | |||
| DLR / Digital Realty Trust, Inc. | 0,02 | 0,00 | 2,88 | 21,66 | 0,1154 | 0,0185 | |||
| DBX / Dropbox, Inc. | 0,10 | -3,19 | 2,86 | 3,66 | 0,1147 | 0,0016 | |||
| PLXS / Plexus Corp. | 0,02 | 2,82 | 0,1149 | 0,1149 | |||||
| ESNT / Essent Group Ltd. | 0,05 | 9,71 | 2,81 | 15,44 | 0,1127 | 0,0129 | |||
| EQIX / Equinix, Inc. | 0,00 | 0,00 | 2,78 | -2,42 | 0,1134 | -0,0036 | |||
| AIT / Applied Industrial Technologies, Inc. | 0,01 | -6,69 | 2,76 | -3,74 | 0,1105 | -0,0068 | |||
| CBOE / Cboe Global Markets, Inc. | 0,01 | -13,57 | 2,75 | -10,93 | 0,1105 | -0,0163 | |||
| NVR / NVR, Inc. | 0,00 | 17,89 | 2,73 | 20,20 | 0,1110 | 0,0180 | |||
| SIRI / Sirius XM Holdings Inc. | 0,12 | 2,72 | 0,1108 | 0,1108 | |||||
| CVS / CVS Health Corporation | 0,04 | 2,72 | 0,1107 | 0,1107 | |||||
| SAIC / Science Applications International Corporation | 0,02 | 2,68 | 0,1091 | 0,1091 | |||||
| HD / The Home Depot, Inc. | 0,01 | 11,50 | 2,67 | 11,51 | 0,1072 | 0,0090 | |||
| GDDY / GoDaddy Inc. | 0,01 | -29,89 | 2,67 | -29,92 | 0,1087 | -0,0475 | |||
| BAH / Booz Allen Hamilton Holding Corporation | 0,03 | 2,66 | 0,1083 | 0,1083 | |||||
| PII / Polaris Inc. | 0,07 | 160,21 | 2,65 | 158,48 | 0,1064 | 0,0643 | |||
| AKAM / Akamai Technologies, Inc. | 0,03 | 43,81 | 2,65 | 42,54 | 0,1062 | 0,0300 | |||
| FOXA / Fox Corporation | 0,05 | -41,21 | 2,65 | -41,79 | 0,1061 | -0,0802 | |||
| CACC / Credit Acceptance Corporation | 0,01 | 13,61 | 2,64 | 12,12 | 0,1057 | 0,0093 | |||
| FCN / FTI Consulting, Inc. | 0,02 | 2,63 | 0,1055 | 0,1055 | |||||
| TTC / The Toro Company | 0,04 | 2,59 | 0,1040 | 0,1040 | |||||
| OC / Owens Corning | 0,02 | 24,27 | 2,57 | 19,68 | 0,1032 | 0,0151 | |||
| CPAY / Corpay, Inc. | 0,01 | -5,81 | 2,54 | -10,37 | 0,1020 | -0,0143 | |||
| EEFT / Euronet Worldwide, Inc. | 0,03 | 9,49 | 2,53 | 3,85 | 0,1017 | 0,0017 | |||
| TGT / Target Corporation | 0,03 | 80,68 | 2,53 | 70,84 | 0,1028 | 0,0422 | |||
| ENS / EnerSys | 0,03 | 9,75 | 2,50 | 2,79 | 0,1004 | 0,0006 | |||
| HIW / Highwoods Properties, Inc. | 0,08 | 0,00 | 2,49 | 4,89 | 0,0998 | 0,0026 | |||
| HUM / Humana Inc. | 0,01 | 39,45 | 2,47 | 28,88 | 0,1005 | 0,0220 | |||
| TNET / TriNet Group, Inc. | 0,03 | 77,92 | 2,47 | 64,22 | 0,0989 | 0,0374 | |||
| EXP / Eagle Materials Inc. | 0,01 | 30,29 | 2,43 | 18,68 | 0,0976 | 0,0135 | |||
| NXRT / NexPoint Residential Trust, Inc. | 0,07 | 0,00 | 2,40 | -15,72 | 0,0963 | -0,0205 | |||
| AMGN / Amgen Inc. | 0,01 | 2,39 | 0,0975 | 0,0975 | |||||
| ELV / Elevance Health, Inc. | 0,01 | 26,84 | 2,39 | 13,44 | 0,0973 | 0,0109 | |||
| G / Genpact Limited | 0,05 | -30,37 | 2,33 | -39,19 | 0,0936 | -0,0637 | |||
| ACIW / ACI Worldwide, Inc. | 0,05 | 2,24 | 0,0913 | 0,0913 | |||||
| GNL / Global Net Lease, Inc. | 0,30 | 0,00 | 2,23 | -6,06 | 0,0895 | -0,0079 | |||
| COKE / Coca-Cola Consolidated, Inc. | 0,02 | 566,55 | 2,21 | -44,89 | 0,0886 | -0,0757 | |||
| CUZ / Cousins Properties Incorporated | 0,07 | 0,00 | 2,18 | 1,82 | 0,0873 | -0,0003 | |||
| SUI / Sun Communities, Inc. | 0,02 | 0,00 | 2,09 | -1,69 | 0,0838 | -0,0033 | |||
| CAG / Conagra Brands, Inc. | 0,10 | 18,21 | 2,05 | -9,30 | 0,0822 | -0,0104 | |||
| FR / First Industrial Realty Trust, Inc. | 0,04 | 0,00 | 1,99 | -10,83 | 0,0796 | -0,0116 | |||
| FTV / Fortive Corporation | 0,04 | 1,90 | 0,0775 | 0,0775 | |||||
| EXR / Extra Space Storage Inc. | 0,01 | 0,00 | 1,82 | -0,71 | 0,0730 | -0,0021 | |||
| NSP / Insperity, Inc. | 0,03 | 30,72 | 1,80 | -11,89 | 0,0722 | -0,0116 | |||
| VICI / VICI Properties Inc. | 0,05 | 0,00 | 1,69 | -0,06 | 0,0677 | -0,0015 | |||
| BRX / Brixmor Property Group Inc. | 0,06 | 0,00 | 1,67 | -1,94 | 0,0670 | -0,0028 | |||
| ARE / Alexandria Real Estate Equities, Inc. | 0,02 | 55,17 | 1,63 | 21,85 | 0,0655 | 0,0106 | |||
| UNH / UnitedHealth Group Incorporated | 0,01 | 0,45 | 1,59 | -40,19 | 0,0638 | -0,0452 | |||
| HST / Host Hotels & Resorts, Inc. | 0,10 | 0,00 | 1,59 | 8,09 | 0,0647 | 0,0044 | |||
| REXR / Rexford Industrial Realty, Inc. | 0,04 | 0,00 | 1,42 | -9,20 | 0,0571 | -0,0071 | |||
| CURB / Curbline Properties Corp. | 0,06 | 1,37 | 0,0558 | 0,0558 | |||||
| SAFE / Safehold Inc. | 0,08 | 0,00 | 1,29 | -16,90 | 0,0517 | -0,0119 | |||
| EGP / EastGroup Properties, Inc. | 0,01 | 0,00 | 1,24 | -5,15 | 0,0496 | -0,0038 | |||
| MAA / Mid-America Apartment Communities, Inc. | 0,01 | 0,00 | 1,18 | -11,64 | 0,0475 | -0,0075 | |||
| NSA / National Storage Affiliates Trust | 0,04 | 0,00 | 1,12 | -18,85 | 0,0449 | -0,0116 | |||
| DOC / Healthpeak Properties, Inc. | 0,05 | 0,00 | 0,91 | -13,38 | 0,0364 | -0,0065 | |||
| APLE / Apple Hospitality REIT, Inc. | 0,07 | 0,00 | 0,88 | -9,61 | 0,0356 | -0,0041 | |||
| INVH / Invitation Homes Inc. | 0,02 | 0,00 | 0,68 | -5,85 | 0,0271 | -0,0023 | |||
| RAL / Ralliant Corporation | 0,01 | 0,59 | 0,0240 | 0,0240 | |||||
| MTN / Vail Resorts, Inc. | 0,00 | -88,24 | 0,19 | -88,48 | 0,0076 | -0,0593 | |||
| LH / Labcorp Holdings Inc. | 0,00 | -100,00 | 0,00 | 0,0000 | |||||
| EXTR / Extreme Networks, Inc. | 0,00 | -100,00 | 0,00 | 0,0000 | |||||
| JLL / Jones Lang LaSalle Incorporated | 0,00 | -100,00 | 0,00 | 0,0000 | |||||
| TKR / The Timken Company | 0,00 | -100,00 | 0,00 | 0,0000 | |||||
| UPS / United Parcel Service, Inc. | 0,00 | -100,00 | 0,00 | 0,0000 | |||||
| TPR / Tapestry, Inc. | 0,00 | -100,00 | 0,00 | 0,0000 | |||||
| CBRE / CBRE Group, Inc. | 0,00 | -100,00 | 0,00 | 0,0000 | |||||
| AZO / AutoZone, Inc. | 0,00 | -100,00 | 0,00 | 0,0000 | |||||
| GLPI / Gaming and Leisure Properties, Inc. | 0,00 | -100,00 | 0,00 | 0,0000 | |||||
| CACI / CACI International Inc | 0,00 | -100,00 | 0,00 | 0,0000 | |||||
| ORLY / O'Reilly Automotive, Inc. | 0,00 | -100,00 | 0,00 | 0,0000 | |||||
| IPAR / Interparfums, Inc. | 0,00 | -100,00 | 0,00 | 0,0000 | |||||
| SLGN / Silgan Holdings Inc. | 0,00 | -100,00 | 0,00 | 0,0000 | |||||
| DXC / DXC Technology Company | 0,00 | -100,00 | 0,00 | 0,0000 | |||||
| IT / Gartner, Inc. | 0,00 | -100,00 | 0,00 | 0,0000 | |||||
| UTHR / United Therapeutics Corporation | 0,00 | -100,00 | 0,00 | 0,0000 | |||||
| J / Jacobs Solutions Inc. | 0,00 | -100,00 | 0,00 | 0,0000 | |||||
| NSIT / Insight Enterprises, Inc. | 0,00 | -100,00 | 0,00 | 0,0000 | |||||
| FUL / H.B. Fuller Company | 0,00 | -100,00 | 0,00 | 0,0000 | |||||
| CMCSA / Comcast Corporation | 0,00 | -100,00 | 0,00 | 0,0000 | |||||
| ASGN / ASGN Incorporated | 0,00 | -100,00 | 0,00 | 0,0000 | |||||
| FHI / Federated Hermes, Inc. | 0,00 | -100,00 | 0,00 | 0,0000 | |||||
| FWRD / Forward Air Corporation | 0,00 | -100,00 | 0,00 | 0,0000 | |||||
| HII / Huntington Ingalls Industries, Inc. | 0,00 | -100,00 | 0,00 | 0,0000 | |||||
| AMTM / Amentum Holdings, Inc. | 0,00 | -100,00 | 0,00 | 0,0000 | |||||
| AVGO / Broadcom Inc. | 0,00 | -100,00 | 0,00 | -100,00 | -0,1300 | ||||
| MAS / Masco Corporation | 0,00 | -100,00 | 0,00 | 0,0000 | |||||
| CNX / CNX Resources Corporation | 0,00 | -100,00 | 0,00 | 0,0000 |