Statistiques de base
| Valeur du portefeuille | $ 704 050 903 |
| Positions actuelles | 95 |
Dernières positions, performances, ASG (à partir des dépôts 13F, 13D)
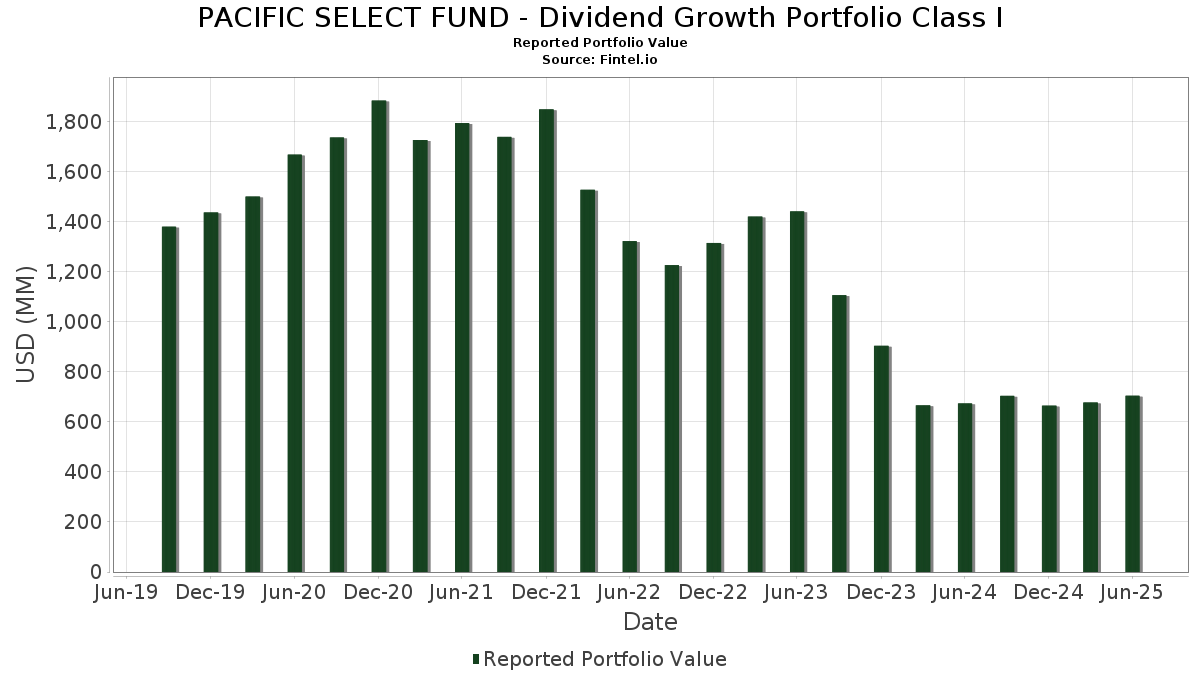
PACIFIC SELECT FUND - Dividend Growth Portfolio Class I a déclaré un total de 95 positions dans ses derniers dépôts auprès de la SEC. La valeur la plus récente du portefeuille est calculée à 704 050 903 USD. Les actifs sous gestion réels (ASG) sont cette valeur plus les liquidités (qui ne sont pas divulguées). Les principales positions de PACIFIC SELECT FUND - Dividend Growth Portfolio Class I sont Microsoft Corporation (US:MSFT) , Apple Inc. (US:AAPL) , JPMorgan Chase & Co. (US:JPM) , Visa Inc. (US:V) , and Broadcom Inc. (US:AVGO) . Les nouvelles positions de PACIFIC SELECT FUND - Dividend Growth Portfolio Class I incluent Gilead Sciences, Inc. (US:GILD) , .
Meilleures augmentations ce trimestre
Nous utilisons la variation de l'allocation du portefeuille car il s'agit de l'indicateur le plus significatif. Les changements peuvent être dus à des transactions ou à des variations de prix des actions.
| Titre | Actions (en millions) |
Valeur ($ en millions) |
% du portefeuille | ΔPortefeuille % |
|---|---|---|---|---|
| 0,10 | 48,26 | 6,7466 | 1,6152 | |
| 0,06 | 17,61 | 2,4622 | 1,4842 | |
| 0,04 | 4,00 | 0,5586 | 0,5586 | |
| 0,11 | 10,38 | 1,4508 | 0,3962 | |
| 0,07 | 21,60 | 3,0191 | 0,3505 | |
| 0,01 | 9,55 | 1,3350 | 0,3014 | |
| 0,06 | 16,53 | 2,3101 | 0,2543 | |
| 0,01 | 4,57 | 0,6386 | 0,2441 | |
| 0,07 | 9,49 | 1,3261 | 0,2066 | |
| 0,02 | 4,64 | 0,6490 | 0,2006 |
Principales baisses ce trimestre
Nous utilisons la variation de l'allocation du portefeuille car il s'agit de l'indicateur le plus significatif. Les changements peuvent être dus à des transactions ou à des variations de prix des actions.
| Titre | Actions (en millions) |
Valeur ($ en millions) |
% du portefeuille | ΔPortefeuille % |
|---|---|---|---|---|
| 0,14 | 28,72 | 4,0143 | -0,8439 | |
| 0,02 | 5,98 | 0,8365 | -0,7759 | |
| 0,02 | 3,68 | 0,5142 | -0,5748 | |
| 0,02 | 6,67 | 0,9317 | -0,5389 | |
| 0,05 | 11,78 | 1,6469 | -0,2947 | |
| 0,05 | 13,58 | 1,8982 | -0,2746 | |
| 0,01 | 1,25 | 0,1745 | -0,2344 | |
| 0,12 | 3,92 | 0,5486 | -0,1980 | |
| 0,01 | 4,05 | 0,5656 | -0,1904 | |
| 0,10 | 6,68 | 0,9340 | -0,1899 |
Déclarations 13F et dépôts de fonds
Ce formulaire a été déposé le 2025-08-18 pour la période de déclaration 2025-06-30. Cliquez sur l'icône du lien pour voir l'historique complet des transactions.
Mettre à niveau pour débloquer les données premium et exporter vers Excel ![]() .
.
| Titre | Type | Prix moyen de l'action | Actions (en millions) |
ΔActions (%) |
ΔActions (%) |
Valeur ($ en millions) |
Portefeuille (%) |
ΔPortefeuille (%) |
|
|---|---|---|---|---|---|---|---|---|---|
| MSFT / Microsoft Corporation | 0,10 | 3,66 | 48,26 | 37,35 | 6,7466 | 1,6152 | |||
| AAPL / Apple Inc. | 0,14 | -6,54 | 28,72 | -13,68 | 4,0143 | -0,8439 | |||
| JPM / JPMorgan Chase & Co. | 0,07 | 0,00 | 21,60 | 18,18 | 3,0191 | 0,3505 | |||
| V / Visa Inc. | 0,06 | 0,00 | 20,72 | 1,31 | 2,8968 | -0,0903 | |||
| AVGO / Broadcom Inc. | 0,06 | 59,75 | 17,61 | 163,01 | 2,4622 | 1,4842 | |||
| GE / General Electric Company | 0,06 | -8,72 | 16,53 | 17,39 | 2,3101 | 0,2543 | |||
| CB / Chubb Limited | 0,05 | -4,87 | 13,58 | -8,74 | 1,8982 | -0,2746 | |||
| WMT / Walmart Inc. | 0,12 | -2,38 | 12,05 | 8,73 | 1,6838 | 0,0660 | |||
| MMC / Marsh & McLennan Companies, Inc. | 0,05 | -1,10 | 11,78 | -11,39 | 1,6469 | -0,2947 | |||
| BAC / Bank of America Corporation | 0,24 | 0,00 | 11,55 | 13,40 | 1,6140 | 0,1271 | |||
| LLY / Eli Lilly and Company | 0,01 | -1,39 | 11,07 | -6,92 | 1,5475 | -0,1894 | |||
| AXP / American Express Company | 0,03 | -2,06 | 10,60 | 16,11 | 1,4824 | 0,1487 | |||
| APH / Amphenol Corporation | 0,11 | -4,54 | 10,38 | 43,72 | 1,4508 | 0,3962 | |||
| SCHW / The Charles Schwab Corporation | 0,11 | 2,93 | 10,26 | 19,97 | 1,4344 | 0,1854 | |||
| LIN / Linde plc | 0,02 | 2,32 | 9,82 | 3,11 | 1,3724 | -0,0182 | |||
| HWM / Howmet Aerospace Inc. | 0,05 | -15,08 | 9,75 | 21,83 | 1,3623 | 0,1942 | |||
| KLAC / KLA Corporation | 0,01 | 2,40 | 9,55 | 34,93 | 1,3350 | 0,3014 | |||
| HD / The Home Depot, Inc. | 0,03 | 2,37 | 9,50 | 2,41 | 1,3280 | -0,0266 | |||
| MS / Morgan Stanley | 0,07 | 2,49 | 9,49 | 23,74 | 1,3261 | 0,2066 | |||
| ROP / Roper Technologies, Inc. | 0,02 | -2,92 | 9,43 | -6,66 | 1,3185 | -0,1572 | |||
| XOM / Exxon Mobil Corporation | 0,09 | 2,55 | 9,29 | -7,06 | 1,2982 | -0,1608 | |||
| KO / The Coca-Cola Company | 0,13 | -0,46 | 9,21 | -1,67 | 1,2872 | -0,0803 | |||
| MCK / McKesson Corporation | 0,01 | -11,94 | 9,19 | -4,11 | 1,2847 | -0,1149 | |||
| HLT / Hilton Worldwide Holdings Inc. | 0,03 | 2,10 | 9,08 | 19,50 | 1,2688 | 0,1596 | |||
| ACN / Accenture plc | 0,03 | 2,49 | 8,63 | -1,83 | 1,2068 | -0,0774 | |||
| BR / Broadridge Financial Solutions, Inc. | 0,04 | 3,48 | 8,54 | 3,73 | 1,1938 | -0,0086 | |||
| ADI / Analog Devices, Inc. | 0,04 | 4,09 | 8,49 | 22,86 | 1,1862 | 0,1775 | |||
| PGR / The Progressive Corporation | 0,03 | -2,17 | 8,41 | -7,76 | 1,1751 | -0,1557 | |||
| PM / Philip Morris International Inc. | 0,05 | -0,65 | 8,40 | 14,00 | 1,1738 | 0,0982 | |||
| SYK / Stryker Corporation | 0,02 | -0,94 | 8,36 | 5,29 | 1,1686 | 0,0091 | |||
| ROST / Ross Stores, Inc. | 0,06 | 0,59 | 7,90 | 0,43 | 1,1047 | -0,0444 | |||
| AEE / Ameren Corporation | 0,08 | -1,67 | 7,90 | -5,94 | 1,1042 | -0,1222 | |||
| HON / Honeywell International Inc. | 0,03 | -3,47 | 7,78 | 6,18 | 1,0881 | 0,0174 | |||
| TMUS / T-Mobile US, Inc. | 0,03 | 0,31 | 7,63 | -10,38 | 1,0664 | -0,1768 | |||
| CL / Colgate-Palmolive Company | 0,08 | 0,00 | 7,46 | -2,99 | 1,0433 | -0,0802 | |||
| WCN / Waste Connections, Inc. | 0,04 | -4,10 | 7,43 | -8,26 | 1,0390 | -0,1441 | |||
| DE / Deere & Company | 0,01 | 0,00 | 7,38 | 8,34 | 1,0316 | 0,0369 | |||
| ABBV / AbbVie Inc. | 0,04 | 0,00 | 7,30 | -11,41 | 1,0202 | -0,1828 | |||
| KVUE / Kenvue Inc. | 0,35 | 2,23 | 7,29 | -10,77 | 1,0189 | -0,1740 | |||
| NOC / Northrop Grumman Corporation | 0,01 | 0,00 | 7,11 | -2,35 | 0,9942 | -0,0694 | |||
| EQR / Equity Residential | 0,10 | 0,00 | 7,07 | -5,72 | 0,9881 | -0,1067 | |||
| MCD / McDonald's Corporation | 0,02 | -4,78 | 7,00 | -10,95 | 0,9791 | -0,1694 | |||
| UNP / Union Pacific Corporation | 0,03 | 0,00 | 6,75 | -2,60 | 0,9432 | -0,0685 | |||
| AZN / AstraZeneca PLC - Depositary Receipt (Common Stock) | 0,10 | -8,69 | 6,68 | -13,19 | 0,9340 | -0,1899 | |||
| TMO / Thermo Fisher Scientific Inc. | 0,02 | -18,78 | 6,67 | -33,81 | 0,9317 | -0,5389 | |||
| SHW / The Sherwin-Williams Company | 0,02 | 6,06 | 6,61 | 4,29 | 0,9244 | -0,0016 | |||
| MDLZ / Mondelez International, Inc. | 0,10 | 2,69 | 6,44 | 2,06 | 0,9008 | -0,0212 | |||
| AMT / American Tower Corporation | 0,03 | 0,00 | 6,41 | 1,58 | 0,8960 | -0,0255 | |||
| COP / ConocoPhillips | 0,07 | 18,44 | 6,34 | 1,21 | 0,8863 | -0,0285 | |||
| DHR / Danaher Corporation | 0,03 | 0,00 | 6,18 | -3,64 | 0,8633 | -0,0726 | |||
| UNH / UnitedHealth Group Incorporated | 0,02 | -9,01 | 5,98 | -45,80 | 0,8365 | -0,7759 | |||
| WFC / Wells Fargo & Company | 0,07 | -1,76 | 5,80 | 9,64 | 0,8108 | 0,0382 | |||
| TXN / Texas Instruments Incorporated | 0,03 | 6,42 | 5,51 | 22,96 | 0,7697 | 0,1157 | |||
| DGX / Quest Diagnostics Incorporated | 0,03 | 2,68 | 5,50 | 9,00 | 0,7684 | 0,0321 | |||
| TT / Trane Technologies plc | 0,01 | -3,88 | 5,42 | 24,79 | 0,7578 | 0,1234 | |||
| ATO / Atmos Energy Corporation | 0,03 | 0,00 | 5,32 | -0,30 | 0,7439 | -0,0356 | |||
| CMS / CMS Energy Corporation | 0,08 | -5,29 | 5,21 | -12,65 | 0,7279 | -0,1426 | |||
| SBGSY / Schneider Electric S.E. - Depositary Receipt (Common Stock) | 0,02 | 2,63 | 5,19 | 19,37 | 0,7252 | 0,0905 | |||
| SPGI / S&P Global Inc. | 0,01 | 14,04 | 5,14 | 18,33 | 0,7184 | 0,0843 | |||
| AMAT / Applied Materials, Inc. | 0,03 | -5,15 | 5,06 | 19,67 | 0,7066 | 0,0897 | |||
| HIG / The Hartford Insurance Group, Inc. | 0,04 | -3,48 | 4,93 | -1,02 | 0,6888 | -0,0383 | |||
| TE Connectivity PLC / EC (IE000IVNQZ81) | 0,03 | 0,00 | 4,85 | 19,35 | 0,6776 | 0,0845 | |||
| GS / The Goldman Sachs Group, Inc. | 0,01 | -2,92 | 4,70 | 25,76 | 0,6572 | 0,1113 | |||
| TSM / Taiwan Semiconductor Manufacturing Company Limited - Depositary Receipt (Common Stock) | 0,02 | 10,81 | 4,64 | 51,19 | 0,6490 | 0,2006 | |||
| NEE / NextEra Energy, Inc. | 0,07 | -10,59 | 4,57 | -12,45 | 0,6388 | -0,1234 | |||
| ADP / Automatic Data Processing, Inc. | 0,01 | 0,00 | 4,57 | 0,95 | 0,6386 | -0,0223 | |||
| INTU / Intuit Inc. | 0,01 | 31,82 | 4,57 | 69,12 | 0,6386 | 0,2441 | |||
| ROK / Rockwell Automation, Inc. | 0,01 | 0,00 | 4,35 | 28,57 | 0,6084 | 0,1140 | |||
| EOG / EOG Resources, Inc. | 0,04 | 0,00 | 4,23 | -6,72 | 0,5916 | -0,0710 | |||
| COST / Costco Wholesale Corporation | 0,00 | -2,32 | 4,17 | 2,23 | 0,5829 | -0,0127 | |||
| ELV / Elevance Health, Inc. | 0,01 | -12,60 | 4,05 | -21,85 | 0,5656 | -0,1904 | |||
| GILD / Gilead Sciences, Inc. | 0,04 | 4,00 | 0,5586 | 0,5586 | |||||
| ODFL / Old Dominion Freight Line, Inc. | 0,02 | -0,41 | 3,99 | -2,30 | 0,5576 | -0,0386 | |||
| WMB / The Williams Companies, Inc. | 0,06 | -3,51 | 3,97 | 1,40 | 0,5555 | -0,0167 | |||
| CSX / CSX Corporation | 0,12 | 0,00 | 3,94 | 10,88 | 0,5501 | 0,0318 | |||
| SLB / Schlumberger Limited | 0,12 | -5,07 | 3,92 | -23,24 | 0,5486 | -0,1980 | |||
| YUM / Yum! Brands, Inc. | 0,03 | 0,00 | 3,87 | -5,84 | 0,5415 | -0,0592 | |||
| AVY / Avery Dennison Corporation | 0,02 | -6,99 | 3,74 | -8,29 | 0,5224 | -0,0727 | |||
| EQT / EQT Corporation | 0,06 | -23,53 | 3,70 | -16,53 | 0,5165 | -0,1300 | |||
| BDX / Becton, Dickinson and Company | 0,02 | -34,40 | 3,68 | -50,68 | 0,5142 | -0,5748 | |||
| GEV / GE Vernova Inc. | 0,01 | -23,26 | 3,49 | 33,04 | 0,4880 | 0,1047 | |||
| QCOM / QUALCOMM Incorporated | 0,02 | 0,00 | 3,39 | 3,70 | 0,4737 | -0,0036 | |||
| GEHC / GE HealthCare Technologies Inc. | 0,04 | -12,98 | 2,98 | -20,13 | 0,4166 | -0,1283 | |||
| CI / The Cigna Group | 0,01 | 0,00 | 2,94 | 0,48 | 0,4112 | -0,0163 | |||
| TSCO / Tractor Supply Company | 0,05 | 0,00 | 2,83 | -4,20 | 0,3949 | -0,0359 | |||
| NKE / NIKE, Inc. | 0,04 | 0,00 | 2,61 | 11,87 | 0,3650 | 0,0243 | |||
| AON / Aon plc | 0,01 | -11,11 | 2,28 | -20,56 | 0,3193 | -0,1005 | |||
| ITW / Illinois Tool Works Inc. | 0,01 | 0,00 | 2,16 | -0,32 | 0,3023 | -0,0145 | |||
| MAR / Marriott International, Inc. | 0,01 | 0,00 | 2,07 | 14,75 | 0,2892 | 0,0258 | |||
| OTIS / Otis Worldwide Corporation | 0,02 | -9,14 | 2,07 | -12,82 | 0,2891 | -0,0573 | |||
| RPM / RPM International Inc. | 0,02 | 0,00 | 1,94 | -5,05 | 0,2709 | -0,0271 | |||
| MET / MetLife, Inc. | 0,02 | 0,00 | 1,91 | 0,16 | 0,2664 | -0,0115 | |||
| SWK / Stanley Black & Decker, Inc. | 0,03 | -17,45 | 1,83 | -27,28 | 0,2553 | -0,1113 | |||
| ZTS / Zoetis Inc. | 0,01 | -52,93 | 1,25 | -55,41 | 0,1745 | -0,2344 | |||
| BAH / Booz Allen Hamilton Holding Corporation | 0,01 | 14,00 | 0,59 | 13,60 | 0,0830 | 0,0066 |