Statistiques de base
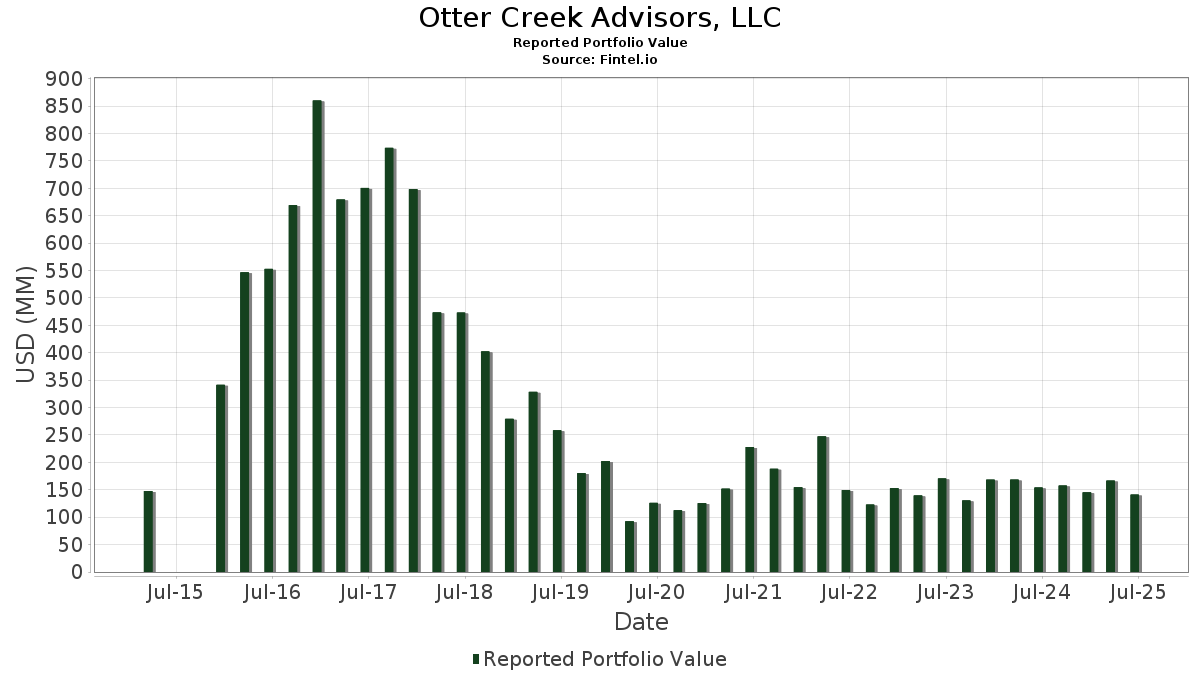
| Valeur du portefeuille | $ 141 136 162 |
| Positions actuelles | 40 |
Dernières positions, performances, ASG (à partir des dépôts 13F, 13D)
Otter Creek Advisors, LLC a déclaré un total de 40 positions dans ses derniers dépôts auprès de la SEC. La valeur la plus récente du portefeuille est calculée à 141 136 162 USD. Les actifs sous gestion réels (ASG) sont cette valeur plus les liquidités (qui ne sont pas divulguées). Les principales positions de Otter Creek Advisors, LLC sont NVIDIA Corporation (US:NVDA) , Vertiv Holdings Co (US:VRT) , Flex Ltd. (US:FLEX) , CompoSecure, Inc. (US:CMPO) , and LPL Financial Holdings Inc. (US:LPLA) . Les nouvelles positions de Otter Creek Advisors, LLC incluent Take-Two Interactive Software, Inc. (US:TTWO) , Workday, Inc. (US:WDAY) , Ryan Specialty Holdings, Inc. (US:RYAN) , EPAM Systems, Inc. (US:EPAM) , and Danaher Corporation (US:DHR) .
Meilleures augmentations ce trimestre
Nous utilisons la variation de l'allocation du portefeuille car il s'agit de l'indicateur le plus significatif. Les changements peuvent être dus à des transactions ou à des variations de prix des actions.
| Titre | Actions (en millions) |
Valeur ($ en millions) |
% du portefeuille | ΔPortefeuille % |
|---|---|---|---|---|
| 0,05 | 7,90 | 5,5971 | 5,5971 | |
| 0,04 | 5,45 | 3,8610 | 3,8610 | |
| 0,02 | 4,49 | 3,1814 | 3,1814 | |
| 0,02 | 4,42 | 3,1315 | 3,1315 | |
| 0,33 | 4,41 | 3,1256 | 3,0163 | |
| 0,05 | 4,06 | 2,8795 | 2,8795 | |
| 0,06 | 4,40 | 3,1205 | 2,8130 | |
| 0,06 | 3,92 | 2,7780 | 2,7780 | |
| 0,02 | 3,65 | 2,5876 | 2,5876 | |
| 0,35 | 4,89 | 3,4678 | 2,4801 |
Principales baisses ce trimestre
Nous utilisons la variation de l'allocation du portefeuille car il s'agit de l'indicateur le plus significatif. Les changements peuvent être dus à des transactions ou à des variations de prix des actions.
| Titre | Actions (en millions) |
Valeur ($ en millions) |
% du portefeuille | ΔPortefeuille % |
|---|---|---|---|---|
| 0,00 | 0,00 | -11,8339 | ||
| 0,01 | 0,26 | 0,1832 | -2,3845 | |
| 0,01 | 1,55 | 1,0989 | -1,7861 | |
| 0,03 | 2,50 | 1,7717 | -1,4880 | |
| 0,04 | 2,80 | 1,9829 | -1,4481 | |
| 0,01 | 1,38 | 0,9762 | -1,3913 | |
| 0,03 | 2,84 | 2,0099 | -0,9909 | |
| 0,00 | 0,30 | 0,2098 | -0,9387 | |
| 0,00 | 0,30 | 0,2149 | -0,8853 | |
| 0,00 | 0,23 | 0,1648 | -0,8427 |
Déclarations 13F et dépôts de fonds
Ce formulaire a été déposé le 2025-07-29 pour la période de déclaration 2025-06-30. Cliquez sur l'icône du lien pour voir l'historique complet des transactions.
Mettre à niveau pour débloquer les données premium et exporter vers Excel ![]() .
.
| Titre | Type | Prix moyen de l'action | Actions (en millions) |
ΔActions (%) |
ΔActions (%) |
Valeur ($ en millions) |
Portefeuille (%) |
ΔPortefeuille (%) |
|
|---|---|---|---|---|---|---|---|---|---|
| NVDA / NVIDIA Corporation | Put | 0,05 | 7,90 | 5,5971 | 5,5971 | ||||
| VRT / Vertiv Holdings Co | 0,04 | 5,45 | 3,8610 | 3,8610 | |||||
| FLEX / Flex Ltd. | 0,10 | -27,61 | 5,07 | 9,25 | 3,5903 | 0,8072 | |||
| CMPO / CompoSecure, Inc. | 0,35 | 129,37 | 4,89 | 197,33 | 3,4678 | 2,4801 | |||
| LPLA / LPL Financial Holdings Inc. | 0,01 | 17,04 | 4,76 | 34,17 | 3,3723 | 1,2435 | |||
| CRM / Salesforce, Inc. | 0,02 | 47,76 | 4,72 | 50,16 | 3,3474 | 1,4594 | |||
| ICE / Intercontinental Exchange, Inc. | 0,03 | -12,86 | 4,59 | -7,32 | 3,2549 | 0,2808 | |||
| BWIN / The Baldwin Insurance Group, Inc. | 0,11 | 138,87 | 4,55 | 128,84 | 3,2222 | 2,0297 | |||
| META / Meta Platforms, Inc. | 0,01 | -32,14 | 4,53 | -13,09 | 3,2126 | 0,0821 | |||
| FFIV / F5, Inc. | 0,02 | -21,61 | 4,53 | -13,36 | 3,2123 | 0,0729 | |||
| LHX / L3Harris Technologies, Inc. | 0,02 | 4,49 | 3,1814 | 3,1814 | |||||
| PWR / Quanta Services, Inc. | 0,01 | -52,54 | 4,49 | -29,41 | 3,1800 | -0,6351 | |||
| GLW / Corning Incorporated | 0,09 | 90,65 | 4,49 | 118,98 | 3,1797 | 1,9502 | |||
| TTWO / Take-Two Interactive Software, Inc. | 0,02 | 4,42 | 3,1315 | 3,1315 | |||||
| AVTR / Avantor, Inc. | 0,33 | 2 815,30 | 4,41 | 2 323,63 | 3,1256 | 3,0163 | |||
| XYZ / Block, Inc. | 0,06 | 587,38 | 4,40 | 760,16 | 3,1205 | 2,8130 | |||
| PSN / Parsons Corporation | 0,06 | -41,31 | 4,35 | -28,86 | 3,0850 | -0,5874 | |||
| MMM / 3M Company | 0,03 | 20,19 | 4,14 | 24,60 | 2,9326 | 0,9393 | |||
| COHR / Coherent Corp. | 0,05 | 4,06 | 2,8795 | 2,8795 | |||||
| HOLX / Hologic, Inc. | 0,06 | 3,92 | 2,7780 | 2,7780 | |||||
| RVTY / Revvity, Inc. | 0,04 | 74,21 | 3,87 | 59,25 | 2,7386 | 1,2824 | |||
| WDAY / Workday, Inc. | 0,02 | 3,65 | 2,5876 | 2,5876 | |||||
| GWRE / Guidewire Software, Inc. | 0,02 | -19,59 | 3,57 | 1,05 | 2,5271 | 0,4093 | |||
| DKNG / DraftKings Inc. | 0,08 | 87,30 | 3,54 | 141,91 | 2,5115 | 1,6323 | |||
| MSFT / Microsoft Corporation | 0,01 | -10,12 | 3,46 | 19,08 | 2,4550 | 0,7094 | |||
| AMZN / Amazon.com, Inc. | 0,02 | -38,40 | 3,38 | -28,98 | 2,3934 | -0,4603 | |||
| J / Jacobs Solutions Inc. | 0,02 | -9,17 | 3,17 | -1,24 | 2,2488 | 0,3205 | |||
| NDAQ / Nasdaq, Inc. | 0,03 | -51,88 | 2,84 | -43,29 | 2,0099 | -0,9909 | |||
| WRB / W. R. Berkley Corporation | 0,04 | -52,60 | 2,80 | -51,07 | 1,9829 | -1,4481 | |||
| RYAN / Ryan Specialty Holdings, Inc. | 0,04 | 2,63 | 1,8602 | 1,8602 | |||||
| AVGO / Broadcom Inc. | 0,01 | -60,57 | 2,62 | -35,07 | 1,8564 | -0,5652 | |||
| EPAM / EPAM Systems, Inc. | 0,01 | 2,54 | 1,7978 | 1,7978 | |||||
| GEHC / GE HealthCare Technologies Inc. | 0,03 | -49,85 | 2,50 | -53,98 | 1,7717 | -1,4880 | |||
| DHR / Danaher Corporation | 0,01 | 2,37 | 1,6796 | 1,6796 | |||||
| SBAC / SBA Communications Corporation | 0,01 | -69,78 | 1,55 | -67,76 | 1,0989 | -1,7861 | |||
| GOOGL / Alphabet Inc. | 0,01 | -69,36 | 1,38 | -65,10 | 0,9762 | -1,3913 | |||
| CLH / Clean Harbors, Inc. | 0,00 | -85,90 | 0,30 | -83,47 | 0,2149 | -0,8853 | |||
| BRO / Brown & Brown, Inc. | 0,00 | -82,64 | 0,30 | -84,54 | 0,2098 | -0,9387 | |||
| CNP / CenterPoint Energy, Inc. | 0,01 | -94,04 | 0,26 | -93,97 | 0,1832 | -2,3845 | |||
| CP / Canadian Pacific Kansas City Limited | 0,00 | -87,73 | 0,23 | -86,18 | 0,1648 | -0,8427 | |||
| GE / General Electric Company | 0,00 | -100,00 | 0,00 | 0,0000 | |||||
| BKFOF / Brookfield Corporation - Preferred Stock | 0,00 | -100,00 | 0,00 | 0,0000 | |||||
| FI / Fiserv, Inc. | 0,00 | -100,00 | 0,00 | 0,0000 | |||||
| HYG / iShares Trust - iShares iBoxx $ High Yield Corporate Bond ETF | Put | 0,00 | -100,00 | 0,00 | -100,00 | -11,8339 | |||
| AEE / Ameren Corporation | 0,00 | -100,00 | 0,00 | 0,0000 | |||||
| SSNC / SS&C Technologies Holdings, Inc. | 0,00 | -100,00 | 0,00 | 0,0000 | |||||
| BX / Blackstone Inc. | Put | 0,00 | -100,00 | 0,00 | 0,0000 | ||||
| V / Visa Inc. | 0,00 | -100,00 | 0,00 | 0,0000 | |||||
| ABNB / Airbnb, Inc. | 0,00 | -100,00 | 0,00 | 0,0000 | |||||
| UBER / Uber Technologies, Inc. | 0,00 | -100,00 | 0,00 | 0,0000 | |||||
| VLTO / Veralto Corporation | 0,00 | -100,00 | 0,00 | 0,0000 | |||||
| PTC / PTC Inc. | 0,00 | -100,00 | 0,00 | 0,0000 | |||||
| TMO / Thermo Fisher Scientific Inc. | 0,00 | -100,00 | 0,00 | 0,0000 | |||||
| AJG / Arthur J. Gallagher & Co. | 0,00 | -100,00 | 0,00 | 0,0000 | |||||
| NXT / Nextracker Inc. | 0,00 | -100,00 | 0,00 | 0,0000 |