Statistiques de base
| Valeur du portefeuille | $ 455 115 444 |
| Positions actuelles | 121 |
Dernières positions, performances, ASG (à partir des dépôts 13F, 13D)
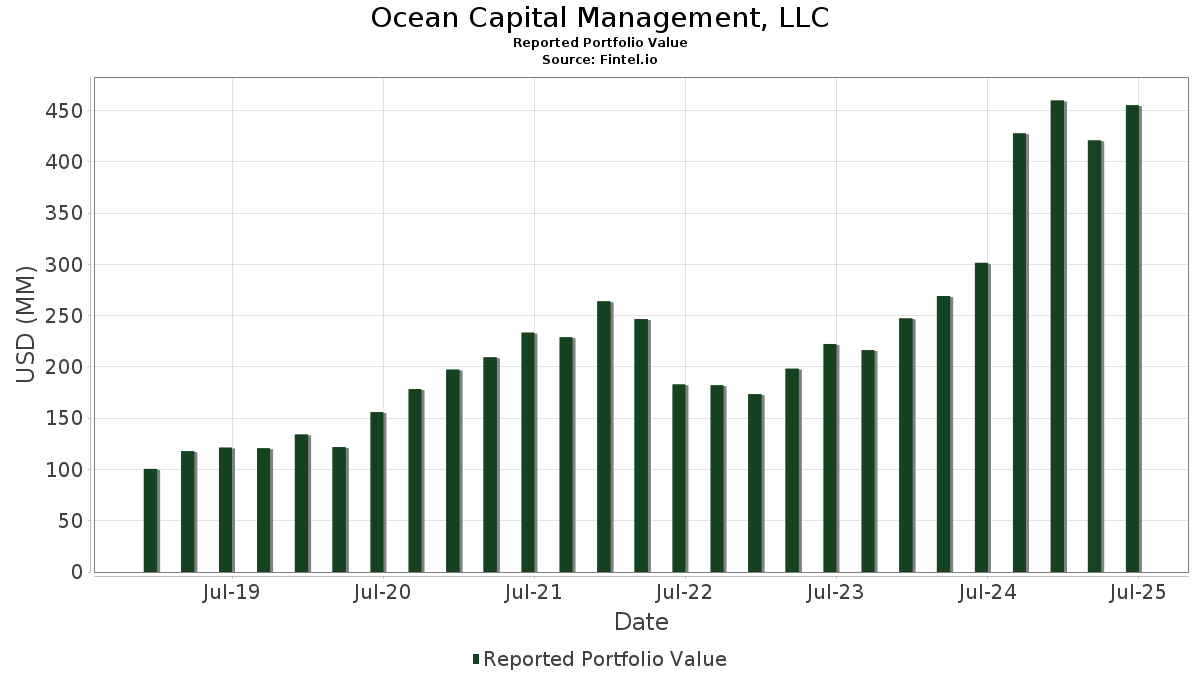
Ocean Capital Management, LLC a déclaré un total de 121 positions dans ses derniers dépôts auprès de la SEC. La valeur la plus récente du portefeuille est calculée à 455 115 444 USD. Les actifs sous gestion réels (ASG) sont cette valeur plus les liquidités (qui ne sont pas divulguées). Les principales positions de Ocean Capital Management, LLC sont Apple Inc. (US:AAPL) , Costco Wholesale Corporation (US:COST) , Amazon.com, Inc. (US:AMZN) , NVIDIA Corporation (US:NVDA) , and Alphabet Inc. (US:GOOGL) . Les nouvelles positions de Ocean Capital Management, LLC incluent CoreWeave, Inc. (US:CRWV) , Circle Internet Group, Inc. (US:CRCL) , F5, Inc. (US:FFIV) , .
Meilleures augmentations ce trimestre
Nous utilisons la variation de l'allocation du portefeuille car il s'agit de l'indicateur le plus significatif. Les changements peuvent être dus à des transactions ou à des variations de prix des actions.
| Titre | Actions (en millions) |
Valeur ($ en millions) |
% du portefeuille | ΔPortefeuille % |
|---|---|---|---|---|
| 0,25 | 39,57 | 8,6935 | 2,0006 | |
| 0,01 | 11,90 | 2,6158 | 0,6561 | |
| 0,02 | 6,78 | 1,4893 | 0,5317 | |
| 0,04 | 18,03 | 3,9608 | 0,5254 | |
| 0,05 | 6,27 | 1,3779 | 0,4653 | |
| 0,01 | 2,28 | 0,5021 | 0,2447 | |
| 0,22 | 49,01 | 10,7688 | 0,2248 | |
| 0,00 | 2,05 | 0,4502 | 0,1725 | |
| 0,02 | 4,26 | 0,9357 | 0,1718 | |
| 0,01 | 1,81 | 0,3984 | 0,1642 |
Principales baisses ce trimestre
Nous utilisons la variation de l'allocation du portefeuille car il s'agit de l'indicateur le plus significatif. Les changements peuvent être dus à des transactions ou à des variations de prix des actions.
| Titre | Actions (en millions) |
Valeur ($ en millions) |
% du portefeuille | ΔPortefeuille % |
|---|---|---|---|---|
| 0,30 | 61,30 | 13,4698 | -2,8090 | |
| 0,02 | 5,50 | 1,2074 | -1,0152 | |
| 0,06 | 54,98 | 12,0810 | -0,6502 | |
| 0,09 | 9,09 | 1,9977 | -0,4671 | |
| 0,01 | 2,03 | 0,4453 | -0,2010 | |
| 0,02 | 6,28 | 1,3790 | -0,1686 | |
| 0,01 | 5,02 | 1,1036 | -0,1456 | |
| 0,02 | 0,89 | 0,1946 | -0,1079 | |
| 0,01 | 1,64 | 0,3606 | -0,0795 | |
| 0,01 | 1,17 | 0,2580 | -0,0758 |
Déclarations 13F et dépôts de fonds
Ce formulaire a été déposé le 2025-08-04 pour la période de déclaration 2025-06-30. Cliquez sur l'icône du lien pour voir l'historique complet des transactions.
Mettre à niveau pour débloquer les données premium et exporter vers Excel ![]() .
.
| Titre | Type | Prix moyen de l'action | Actions (en millions) |
ΔActions (%) |
ΔActions (%) |
Valeur ($ en millions) |
Portefeuille (%) |
ΔPortefeuille (%) |
|
|---|---|---|---|---|---|---|---|---|---|
| AAPL / Apple Inc. | 0,30 | -3,10 | 61,30 | -10,50 | 13,4698 | -2,8090 | |||
| COST / Costco Wholesale Corporation | 0,06 | -1,91 | 54,98 | 2,64 | 12,0810 | -0,6502 | |||
| AMZN / Amazon.com, Inc. | 0,22 | -4,20 | 49,01 | 10,47 | 10,7688 | 0,2248 | |||
| NVDA / NVIDIA Corporation | 0,25 | -3,62 | 39,57 | 40,50 | 8,6935 | 2,0006 | |||
| GOOGL / Alphabet Inc. | 0,21 | -3,39 | 36,17 | 10,08 | 7,9465 | 0,1385 | |||
| MSFT / Microsoft Corporation | 0,04 | -5,88 | 18,03 | 24,71 | 3,9608 | 0,5254 | |||
| GOOG / Alphabet Inc. | 0,09 | -2,59 | 15,34 | 10,60 | 3,3708 | 0,0741 | |||
| NFLX / Netflix, Inc. | 0,01 | 0,54 | 11,90 | 44,38 | 2,6158 | 0,6561 | |||
| DECK / Deckers Outdoor Corporation | 0,09 | -4,90 | 9,09 | -12,34 | 1,9977 | -0,4671 | |||
| AVGO / Broadcom Inc. | 0,02 | 2,18 | 6,78 | 68,23 | 1,4893 | 0,5317 | |||
| V / Visa Inc. | 0,02 | -4,87 | 6,28 | -3,61 | 1,3790 | -0,1686 | |||
| PLTR / Palantir Technologies Inc. | 0,05 | 1,11 | 6,27 | 63,32 | 1,3779 | 0,4653 | |||
| WMT / Walmart Inc. | 0,06 | -0,74 | 6,22 | 10,56 | 1,3665 | 0,0296 | |||
| UNH / UnitedHealth Group Incorporated | 0,02 | -1,35 | 5,50 | -41,24 | 1,2074 | -1,0152 | |||
| JPM / JPMorgan Chase & Co. | 0,02 | -1,87 | 5,42 | 15,97 | 1,1903 | 0,0801 | |||
| SYK / Stryker Corporation | 0,01 | -2,33 | 5,28 | 3,81 | 1,1605 | -0,0487 | |||
| NOC / Northrop Grumman Corporation | 0,01 | -2,14 | 5,02 | -4,45 | 1,1036 | -0,1456 | |||
| LMT / Lockheed Martin Corporation | 0,01 | -1,03 | 4,93 | 2,62 | 1,0833 | -0,0587 | |||
| RTX / RTX Corporation | 0,03 | 6,65 | 4,89 | 17,56 | 1,0737 | 0,0859 | |||
| INTU / Intuit Inc. | 0,01 | -2,08 | 4,59 | 25,62 | 1,0086 | 0,1401 | |||
| CRM / Salesforce, Inc. | 0,02 | -0,36 | 4,50 | 1,24 | 0,9893 | -0,0676 | |||
| PANW / Palo Alto Networks, Inc. | 0,02 | 10,47 | 4,26 | 32,48 | 0,9357 | 0,1718 | |||
| LHX / L3Harris Technologies, Inc. | 0,01 | 20,69 | 2,50 | 44,60 | 0,5502 | 0,1387 | |||
| META / Meta Platforms, Inc. | 0,00 | 0,00 | 2,40 | 28,07 | 0,5275 | 0,0820 | |||
| HD / The Home Depot, Inc. | 0,01 | 3,49 | 2,35 | 3,53 | 0,5160 | -0,0231 | |||
| NET / Cloudflare, Inc. | 0,01 | 21,44 | 2,28 | 111,09 | 0,5021 | 0,2447 | |||
| CAT / Caterpillar Inc. | 0,01 | -0,96 | 2,28 | 16,62 | 0,5011 | 0,0363 | |||
| STWD / Starwood Property Trust, Inc. | 0,11 | -1,05 | 2,26 | 0,44 | 0,4967 | -0,0382 | |||
| BAC / Bank of America Corporation | 0,04 | -11,31 | 2,10 | 0,57 | 0,4618 | -0,0349 | |||
| SBUX / Starbucks Corporation | 0,02 | 13,36 | 2,08 | 5,89 | 0,4580 | -0,0098 | |||
| GEV / GE Vernova Inc. | 0,00 | 1,18 | 2,05 | 75,34 | 0,4502 | 0,1725 | |||
| ITW / Illinois Tool Works Inc. | 0,01 | -25,24 | 2,03 | -25,49 | 0,4453 | -0,2010 | |||
| C / Citigroup Inc. | 0,02 | -2,75 | 2,01 | 16,61 | 0,4412 | 0,0319 | |||
| BX / Blackstone Inc. | 0,01 | 0,07 | 1,93 | 7,11 | 0,4239 | -0,0043 | |||
| MCD / McDonald's Corporation | 0,01 | 0,96 | 1,91 | -5,55 | 0,4191 | -0,0610 | |||
| CEG / Constellation Energy Corporation | 0,01 | 14,93 | 1,81 | 84,06 | 0,3984 | 0,1642 | |||
| GD / General Dynamics Corporation | 0,01 | 49,72 | 1,73 | 60,17 | 0,3792 | 0,1232 | |||
| MA / Mastercard Incorporated | 0,00 | 0,03 | 1,70 | 2,60 | 0,3729 | -0,0203 | |||
| QCOM / QUALCOMM Incorporated | 0,01 | -3,49 | 1,68 | 0,06 | 0,3682 | -0,0298 | |||
| ETN / Eaton Corporation plc | 0,00 | 8,59 | 1,67 | 42,63 | 0,3677 | 0,0888 | |||
| AMGN / Amgen Inc. | 0,01 | -1,13 | 1,64 | -11,40 | 0,3606 | -0,0795 | |||
| UBER / Uber Technologies, Inc. | 0,02 | 1,61 | 1,62 | 30,18 | 0,3565 | 0,0601 | |||
| CINF / Cincinnati Financial Corporation | 0,01 | -0,14 | 1,55 | 0,72 | 0,3395 | -0,0253 | |||
| PM / Philip Morris International Inc. | 0,01 | -2,25 | 1,52 | 12,19 | 0,3339 | 0,0119 | |||
| GE / General Electric Company | 0,01 | 1,59 | 1,50 | 30,66 | 0,3289 | 0,0566 | |||
| AMD / Advanced Micro Devices, Inc. | 0,01 | 23,40 | 1,49 | 70,56 | 0,3273 | 0,1196 | |||
| DIS / The Walt Disney Company | 0,01 | -11,58 | 1,37 | 11,12 | 0,3009 | 0,0079 | |||
| PG / The Procter & Gamble Company | 0,01 | -8,05 | 1,32 | -14,02 | 0,2896 | -0,0748 | |||
| XOM / Exxon Mobil Corporation | 0,01 | -5,33 | 1,26 | -14,23 | 0,2770 | -0,0722 | |||
| WFC / Wells Fargo & Company | 0,02 | 8,48 | 1,25 | 21,07 | 0,2742 | 0,0292 | |||
| ORCL / Oracle Corporation | 0,01 | 8,07 | 1,25 | 68,97 | 0,2740 | 0,0986 | |||
| ABBV / AbbVie Inc. | 0,01 | -5,62 | 1,17 | -16,38 | 0,2580 | -0,0758 | |||
| VST / Vistra Corp. | 0,01 | 8,10 | 1,07 | 78,54 | 0,2359 | 0,0929 | |||
| LULU / lululemon athletica inc. | 0,00 | -3,30 | 0,97 | -18,85 | 0,2140 | -0,0712 | |||
| AXP / American Express Company | 0,00 | -6,97 | 0,97 | 10,35 | 0,2132 | 0,0041 | |||
| TMUS / T-Mobile US, Inc. | 0,00 | -2,73 | 0,97 | -13,12 | 0,2126 | -0,0521 | |||
| TSM / Taiwan Semiconductor Manufacturing Company Limited - Depositary Receipt (Common Stock) | 0,00 | 2,39 | 0,95 | 39,65 | 0,2092 | 0,0472 | |||
| LLY / Eli Lilly and Company | 0,00 | 0,08 | 0,95 | -5,47 | 0,2088 | -0,0303 | |||
| CVS / CVS Health Corporation | 0,01 | -1,07 | 0,94 | 0,75 | 0,2066 | -0,0153 | |||
| TRV / The Travelers Companies, Inc. | 0,00 | 0,00 | 0,94 | 1,19 | 0,2063 | -0,0143 | |||
| ELV / Elevance Health, Inc. | 0,00 | -4,00 | 0,90 | -14,15 | 0,1987 | -0,0517 | |||
| BMY / Bristol-Myers Squibb Company | 0,02 | -8,31 | 0,89 | -30,42 | 0,1946 | -0,1079 | |||
| ADBE / Adobe Inc. | 0,00 | -6,08 | 0,87 | -5,21 | 0,1919 | -0,0272 | |||
| PNC / The PNC Financial Services Group, Inc. | 0,00 | 0,50 | 0,85 | 6,62 | 0,1878 | -0,0028 | |||
| INVH / Invitation Homes Inc. | 0,03 | 0,00 | 0,84 | -5,84 | 0,1842 | -0,0275 | |||
| DD / DuPont de Nemours, Inc. | 0,01 | 21,18 | 0,83 | 11,29 | 0,1820 | 0,0051 | |||
| MDB / MongoDB, Inc. | 0,00 | -13,53 | 0,82 | 3,55 | 0,1796 | -0,0081 | |||
| MS / Morgan Stanley | 0,01 | 0,07 | 0,81 | 20,86 | 0,1782 | 0,0187 | |||
| IBM / International Business Machines Corporation | 0,00 | 0,40 | 0,80 | 18,93 | 0,1768 | 0,0161 | |||
| SHW / The Sherwin-Williams Company | 0,00 | 0,00 | 0,80 | -1,60 | 0,1754 | -0,0175 | |||
| STE / STERIS plc | 0,00 | 0,00 | 0,74 | 5,98 | 0,1636 | -0,0034 | |||
| GEHC / GE HealthCare Technologies Inc. | 0,01 | 0,81 | 0,70 | -7,52 | 0,1542 | -0,0261 | |||
| DHR / Danaher Corporation | 0,00 | 8,52 | 0,69 | 4,52 | 0,1527 | -0,0052 | |||
| UNP / Union Pacific Corporation | 0,00 | 0,52 | 0,67 | -2,20 | 0,1465 | -0,0153 | |||
| CMG / Chipotle Mexican Grill, Inc. | 0,01 | 0,00 | 0,66 | 11,95 | 0,1442 | 0,0047 | |||
| RDDT / Reddit, Inc. | 0,00 | 36,01 | 0,62 | 95,60 | 0,1367 | 0,0610 | |||
| CVX / Chevron Corporation | 0,00 | -1,75 | 0,62 | -15,94 | 0,1357 | -0,0389 | |||
| CSCO / Cisco Systems, Inc. | 0,01 | 15,04 | 0,61 | 29,49 | 0,1332 | 0,0218 | |||
| VZ / Verizon Communications Inc. | 0,01 | -0,77 | 0,58 | -5,25 | 0,1269 | -0,0181 | |||
| GILD / Gilead Sciences, Inc. | 0,00 | -15,20 | 0,54 | -16,17 | 0,1186 | -0,0343 | |||
| AMP / Ameriprise Financial, Inc. | 0,00 | 0,20 | 0,52 | 10,57 | 0,1149 | 0,0024 | |||
| JNJ / Johnson & Johnson | 0,00 | -1,79 | 0,52 | -9,60 | 0,1140 | -0,0223 | |||
| WM / Waste Management, Inc. | 0,00 | 0,14 | 0,49 | -1,02 | 0,1068 | -0,0100 | |||
| ABT / Abbott Laboratories | 0,00 | 13,00 | 0,48 | 15,74 | 0,1052 | 0,0070 | |||
| BROS / Dutch Bros Inc. | 0,01 | 30,11 | 0,47 | 43,90 | 0,1039 | 0,0259 | |||
| MRK / Merck & Co., Inc. | 0,01 | -3,14 | 0,47 | -14,70 | 0,1034 | -0,0275 | |||
| MO / Altria Group, Inc. | 0,01 | 0,51 | 0,46 | -1,69 | 0,1020 | -0,0104 | |||
| SCHW / The Charles Schwab Corporation | 0,00 | 0,10 | 0,45 | 16,80 | 0,0979 | 0,0071 | |||
| MDT / Medtronic plc | 0,01 | -0,61 | 0,44 | -3,49 | 0,0971 | -0,0118 | |||
| PEP / PepsiCo, Inc. | 0,00 | 1,28 | 0,41 | -10,94 | 0,0896 | -0,0191 | |||
| SONY / Sony Group Corporation - Depositary Receipt (Common Stock) | 0,02 | 0,00 | 0,41 | 2,53 | 0,0893 | -0,0049 | |||
| MPC / Marathon Petroleum Corporation | 0,00 | -11,88 | 0,40 | 0,50 | 0,0883 | -0,0068 | |||
| PYPL / PayPal Holdings, Inc. | 0,01 | -12,85 | 0,40 | -0,75 | 0,0870 | -0,0078 | |||
| T / AT&T Inc. | 0,01 | -11,05 | 0,39 | -9,01 | 0,0868 | -0,0163 | |||
| PPG / PPG Industries, Inc. | 0,00 | -2,09 | 0,38 | 1,89 | 0,0832 | -0,0052 | |||
| RACE / Ferrari N.V. | 0,00 | 0,00 | 0,37 | 15,00 | 0,0809 | 0,0046 | |||
| INTC / Intel Corporation | 0,02 | -2,80 | 0,36 | -4,03 | 0,0785 | -0,0101 | |||
| BRK.B / Berkshire Hathaway Inc. | 0,00 | -17,97 | 0,34 | -25,22 | 0,0750 | -0,0334 | |||
| NVO / Novo Nordisk A/S - Depositary Receipt (Common Stock) | 0,00 | 0,41 | 0,33 | 0,00 | 0,0734 | -0,0061 | |||
| LVS / Las Vegas Sands Corp. | 0,01 | -2,49 | 0,33 | 9,73 | 0,0720 | 0,0011 | |||
| CRWV / CoreWeave, Inc. | 0,00 | 0,32 | 0,0704 | 0,0704 | |||||
| NEE / NextEra Energy, Inc. | 0,00 | -2,60 | 0,32 | -4,48 | 0,0703 | -0,0094 | |||
| BABA / Alibaba Group Holding Limited - Depositary Receipt (Common Stock) | 0,00 | -4,08 | 0,32 | -17,78 | 0,0703 | -0,0221 | |||
| BIIB / Biogen Inc. | 0,00 | 0,00 | 0,32 | -8,36 | 0,0701 | -0,0125 | |||
| MDLZ / Mondelez International, Inc. | 0,00 | -4,01 | 0,31 | -4,60 | 0,0684 | -0,0091 | |||
| CI / The Cigna Group | 0,00 | 0,11 | 0,29 | 0,68 | 0,0647 | -0,0048 | |||
| MGM / MGM Resorts International | 0,01 | 0,00 | 0,29 | 15,79 | 0,0630 | 0,0043 | |||
| KKR / KKR & Co. Inc. | 0,00 | 0,00 | 0,28 | 14,81 | 0,0615 | 0,0037 | |||
| PSX / Phillips 66 | 0,00 | -1,99 | 0,27 | -5,26 | 0,0594 | -0,0084 | |||
| R / Ryder System, Inc. | 0,00 | 0,18 | 0,26 | 10,68 | 0,0570 | 0,0013 | |||
| CBOE / Cboe Global Markets, Inc. | 0,00 | 0,27 | 0,26 | 3,66 | 0,0561 | -0,0026 | |||
| CRCL / Circle Internet Group, Inc. | 0,00 | 0,25 | 0,0552 | 0,0552 | |||||
| NFG / National Fuel Gas Company | 0,00 | 0,64 | 0,24 | 7,66 | 0,0526 | -0,0002 | |||
| STX / Seagate Technology Holdings plc | 0,00 | 0,24 | 0,0521 | 0,0521 | |||||
| URI / United Rentals, Inc. | 0,00 | 0,22 | 0,0484 | 0,0484 | |||||
| TXN / Texas Instruments Incorporated | 0,00 | 0,21 | 0,0471 | 0,0471 | |||||
| HBAN / Huntington Bancshares Incorporated | 0,01 | 0,21 | 0,21 | 12,11 | 0,0470 | 0,0016 | |||
| FFIV / F5, Inc. | 0,00 | 0,21 | 0,0455 | 0,0455 | |||||
| HON / Honeywell International Inc. | 0,00 | 0,21 | 0,0455 | 0,0455 | |||||
| FEMY / Femasys Inc. | 0,02 | 0,00 | 0,02 | -23,33 | 0,0051 | -0,0021 | |||
| SMRT / SmartRent, Inc. | 0,02 | 0,00 | 0,02 | -21,05 | 0,0034 | -0,0011 | |||
| ZS / Zscaler, Inc. | 0,00 | -100,00 | 0,00 | 0,0000 | |||||
| KO / The Coca-Cola Company | 0,00 | -100,00 | 0,00 | 0,0000 | |||||
| TSLA / Tesla, Inc. | 0,00 | -100,00 | 0,00 | -100,00 | -0,0642 |