Statistiques de base
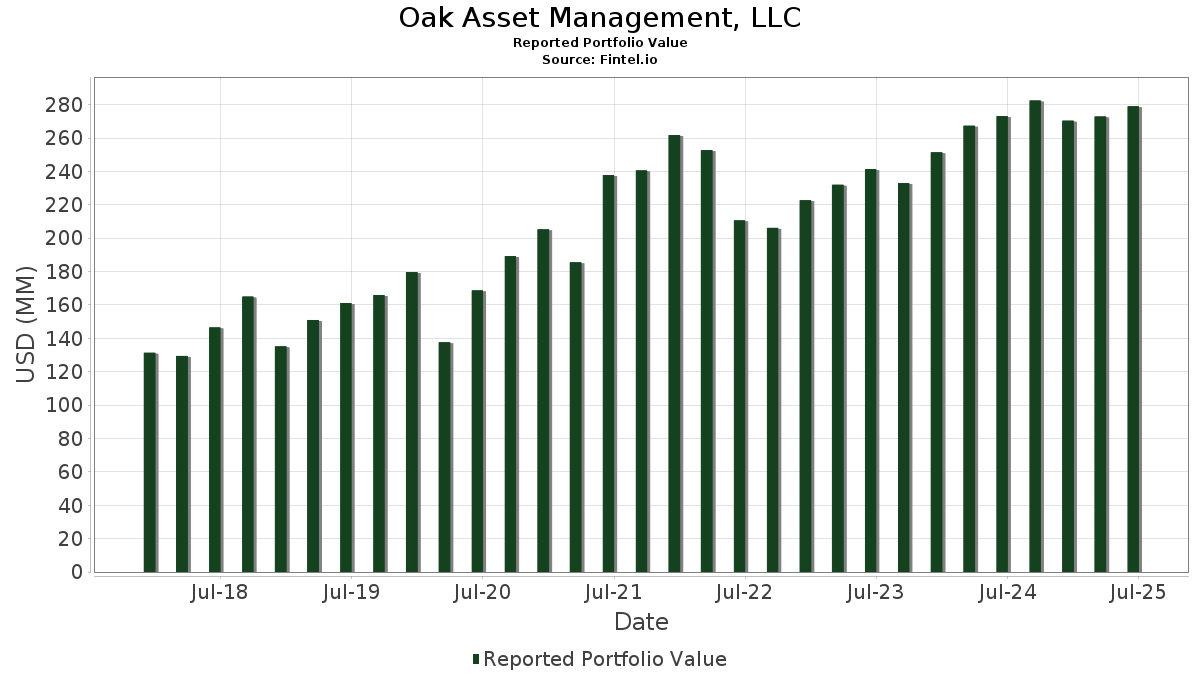
| Valeur du portefeuille | $ 278 995 277 |
| Positions actuelles | 103 |
Dernières positions, performances, ASG (à partir des dépôts 13F, 13D)
Oak Asset Management, LLC a déclaré un total de 103 positions dans ses derniers dépôts auprès de la SEC. La valeur la plus récente du portefeuille est calculée à 278 995 277 USD. Les actifs sous gestion réels (ASG) sont cette valeur plus les liquidités (qui ne sont pas divulguées). Les principales positions de Oak Asset Management, LLC sont Apple Inc. (US:AAPL) , Amgen Inc. (US:AMGN) , NVIDIA Corporation (US:NVDA) , Chevron Corporation (US:CVX) , and QUALCOMM Incorporated (US:QCOM) . Les nouvelles positions de Oak Asset Management, LLC incluent Barrick Mining Corporation (BG:ABR0) , Vistra Corp. (US:VST) , Uber Technologies, Inc. (PL:UBER) , .
Meilleures augmentations ce trimestre
Nous utilisons la variation de l'allocation du portefeuille car il s'agit de l'indicateur le plus significatif. Les changements peuvent être dus à des transactions ou à des variations de prix des actions.
| Titre | Actions (en millions) |
Valeur ($ en millions) |
% du portefeuille | ΔPortefeuille % |
|---|---|---|---|---|
| 0,10 | 15,37 | 5,5102 | 1,4609 | |
| 0,04 | 7,95 | 2,8497 | 0,9704 | |
| 0,02 | 7,86 | 2,8184 | 0,6279 | |
| 0,01 | 2,54 | 0,9105 | 0,3768 | |
| 0,01 | 2,59 | 0,9295 | 0,2712 | |
| 0,02 | 5,24 | 1,8795 | 0,2462 | |
| 0,03 | 1,96 | 0,7015 | 0,2129 | |
| 0,03 | 0,59 | 0,2127 | 0,2127 | |
| 0,02 | 2,48 | 0,8875 | 0,1363 | |
| 0,00 | 1,82 | 0,6516 | 0,1324 |
Principales baisses ce trimestre
Nous utilisons la variation de l'allocation du portefeuille car il s'agit de l'indicateur le plus significatif. Les changements peuvent être dus à des transactions ou à des variations de prix des actions.
| Titre | Actions (en millions) |
Valeur ($ en millions) |
% du portefeuille | ΔPortefeuille % |
|---|---|---|---|---|
| 0,15 | 30,17 | 10,8133 | -1,2869 | |
| 0,06 | 16,97 | 6,0827 | -0,8176 | |
| 0,08 | 11,70 | 4,1948 | -0,8065 | |
| 0,04 | 6,84 | 2,4499 | -0,3919 | |
| 0,00 | 1,37 | 0,4902 | -0,3571 | |
| 0,01 | 0,96 | 0,3428 | -0,2529 | |
| 0,02 | 5,34 | 1,9143 | -0,1972 | |
| 0,06 | 9,38 | 3,3618 | -0,1695 | |
| 0,02 | 2,97 | 1,0660 | -0,1589 | |
| 0,03 | 4,05 | 1,4503 | -0,1534 |
Déclarations 13F et dépôts de fonds
Ce formulaire a été déposé le 2025-07-11 pour la période de déclaration 2025-06-30. Cliquez sur l'icône du lien pour voir l'historique complet des transactions.
Mettre à niveau pour débloquer les données premium et exporter vers Excel ![]() .
.
| Titre | Type | Prix moyen de l'action | Actions (en millions) |
ΔActions (%) |
ΔActions (%) |
Valeur ($ en millions) |
Portefeuille (%) |
ΔPortefeuille (%) |
|
|---|---|---|---|---|---|---|---|---|---|
| AAPL / Apple Inc. | 0,15 | -1,07 | 30,17 | -8,62 | 10,8133 | -1,2869 | |||
| AMGN / Amgen Inc. | 0,06 | 0,58 | 16,97 | -9,86 | 6,0827 | -0,8176 | |||
| NVDA / NVIDIA Corporation | 0,10 | -4,55 | 15,37 | 39,15 | 5,5102 | 1,4609 | |||
| CVX / Chevron Corporation | 0,08 | 0,20 | 11,70 | -14,24 | 4,1948 | -0,8065 | |||
| QCOM / QUALCOMM Incorporated | 0,06 | -0,45 | 9,90 | 3,21 | 3,5478 | 0,0329 | |||
| RTX / RTX Corporation | 0,06 | -11,70 | 9,38 | -2,66 | 3,3618 | -0,1695 | |||
| ORCL / Oracle Corporation | 0,04 | -0,85 | 7,95 | 55,06 | 2,8497 | 0,9704 | |||
| FAST / Fastenal Company | 0,19 | 96,76 | 7,91 | 6,56 | 2,8352 | 0,1147 | |||
| MSFT / Microsoft Corporation | 0,02 | -0,71 | 7,86 | 31,58 | 2,8184 | 0,6279 | |||
| SYK / Stryker Corporation | 0,02 | -1,62 | 7,15 | 4,56 | 2,5640 | 0,0566 | |||
| ABBV / AbbVie Inc. | 0,04 | -0,50 | 6,84 | -11,84 | 2,4499 | -0,3919 | |||
| V / Visa Inc. | 0,02 | 0,58 | 5,82 | 1,89 | 2,0859 | -0,0073 | |||
| MCD / McDonald's Corporation | 0,02 | -0,89 | 5,34 | -7,31 | 1,9143 | -0,1972 | |||
| JPM / JPMorgan Chase & Co. | 0,02 | -0,44 | 5,24 | 17,66 | 1,8795 | 0,2462 | |||
| LOW / Lowe's Companies, Inc. | 0,02 | -0,12 | 4,78 | -4,99 | 1,7150 | -0,1305 | |||
| FDX / FedEx Corporation | 0,02 | 0,62 | 4,76 | -6,17 | 1,7058 | -0,1532 | |||
| ICE / Intercontinental Exchange, Inc. | 0,02 | -10,32 | 4,48 | -4,62 | 1,6069 | -0,1157 | |||
| ISRG / Intuitive Surgical, Inc. | 0,01 | -1,32 | 4,05 | 8,25 | 1,4530 | 0,0808 | |||
| JNJ / Johnson & Johnson | 0,03 | 0,40 | 4,05 | -7,52 | 1,4503 | -0,1534 | |||
| COST / Costco Wholesale Corporation | 0,00 | -1,38 | 3,97 | 3,23 | 1,4221 | 0,0134 | |||
| CVS / CVS Health Corporation | 0,05 | -0,32 | 3,55 | 1,52 | 1,2721 | -0,0095 | |||
| HD / The Home Depot, Inc. | 0,01 | 0,36 | 3,54 | 0,40 | 1,2704 | -0,0234 | |||
| MDT / Medtronic plc | 0,04 | 0,55 | 3,51 | -2,47 | 1,2591 | -0,0608 | |||
| AMT / American Tower Corporation | 0,01 | -0,03 | 3,23 | 1,54 | 1,1572 | -0,0081 | |||
| GJR / Strats Trust For Procter & Gambel Security - Preferred Security | 0,02 | 1,94 | 3,13 | -4,69 | 1,1231 | -0,0819 | |||
| CSCO / Cisco Systems, Inc. | 0,04 | -0,63 | 3,01 | 11,74 | 1,0779 | 0,0914 | |||
| NSC / Norfolk Southern Corporation | 0,01 | 0,00 | 3,01 | 8,05 | 1,0773 | 0,0580 | |||
| STZ / Constellation Brands, Inc. | 0,02 | 0,38 | 2,97 | -11,01 | 1,0660 | -0,1589 | |||
| AMZN / Amazon.com, Inc. | 0,01 | 0,30 | 2,88 | 15,66 | 1,0328 | 0,1197 | |||
| DGRO / iShares Trust - iShares Core Dividend Growth ETF | 0,04 | 0,65 | 2,87 | 4,18 | 1,0284 | 0,0189 | |||
| CMCSA / Comcast Corporation | 0,08 | 3,82 | 2,79 | 0,43 | 1,0005 | -0,0183 | |||
| PEP / PepsiCo, Inc. | 0,02 | 0,47 | 2,66 | -11,54 | 0,9539 | -0,1485 | |||
| TGT / Target Corporation | 0,03 | 2,32 | 2,66 | -3,28 | 0,9529 | -0,0545 | |||
| GOOGL / Alphabet Inc. | 0,01 | 26,69 | 2,59 | 44,38 | 0,9295 | 0,2712 | |||
| GOOG / Alphabet Inc. | 0,01 | 53,65 | 2,54 | 74,45 | 0,9105 | 0,3768 | |||
| MS / Morgan Stanley | 0,02 | 0,06 | 2,48 | 20,84 | 0,8875 | 0,1363 | |||
| CAT / Caterpillar Inc. | 0,01 | -0,41 | 2,37 | 17,24 | 0,8481 | 0,1084 | |||
| CTAS / Cintas Corporation | 0,01 | 3,89 | 2,08 | 12,70 | 0,7441 | 0,0687 | |||
| WM / Waste Management, Inc. | 0,01 | 0,00 | 2,01 | -1,18 | 0,7207 | -0,0249 | |||
| CHD / Church & Dwight Co., Inc. | 0,02 | 0,00 | 2,01 | -12,68 | 0,7205 | -0,1234 | |||
| TROW / T. Rowe Price Group, Inc. | 0,02 | 0,00 | 1,96 | 5,05 | 0,7016 | 0,0186 | |||
| MCHP / Microchip Technology Incorporated | 0,03 | 1,00 | 1,96 | 46,81 | 0,7015 | 0,2129 | |||
| VZ / Verizon Communications Inc. | 0,04 | -0,06 | 1,93 | -4,64 | 0,6932 | -0,0503 | |||
| EXPD / Expeditors International of Washington, Inc. | 0,02 | -0,48 | 1,91 | -5,43 | 0,6863 | -0,0558 | |||
| META / Meta Platforms, Inc. | 0,00 | 0,20 | 1,82 | 28,32 | 0,6516 | 0,1324 | |||
| XOM / Exxon Mobil Corporation | 0,02 | -0,92 | 1,74 | -10,19 | 0,6222 | -0,0862 | |||
| NKE / NIKE, Inc. | 0,02 | -0,31 | 1,69 | 11,50 | 0,6050 | 0,0505 | |||
| GPC / Genuine Parts Company | 0,01 | 0,64 | 1,63 | 2,51 | 0,5853 | 0,0012 | |||
| ITW / Illinois Tool Works Inc. | 0,01 | 1,25 | 1,50 | 0,94 | 0,5364 | -0,0069 | |||
| AFL / Aflac Incorporated | 0,01 | -0,64 | 1,43 | -5,75 | 0,5116 | -0,0435 | |||
| BKNG / Booking Holdings Inc. | 0,00 | 0,00 | 1,42 | 25,71 | 0,5084 | 0,0947 | |||
| INTC / Intel Corporation | 0,06 | -4,03 | 1,38 | -5,35 | 0,4949 | -0,0397 | |||
| UNH / UnitedHealth Group Incorporated | 0,00 | -0,68 | 1,37 | -40,85 | 0,4902 | -0,3571 | |||
| ABT / Abbott Laboratories | 0,01 | 0,00 | 1,29 | 2,55 | 0,4613 | 0,0013 | |||
| IBM / International Business Machines Corporation | 0,00 | 0,05 | 1,20 | 18,60 | 0,4301 | 0,0593 | |||
| WMT / Walmart Inc. | 0,01 | 0,00 | 1,15 | 11,33 | 0,4124 | 0,0338 | |||
| GSCE / GS Connect S&P GSCI Enhanced Commodity Total Return ETN | 0,00 | 0,00 | 1,15 | 29,64 | 0,4110 | 0,0866 | |||
| AXP / American Express Company | 0,00 | 0,00 | 1,14 | 18,48 | 0,4093 | 0,0563 | |||
| NFLX / Netflix, Inc. | 0,00 | 3,95 | 1,09 | 49,18 | 0,3917 | 0,1234 | |||
| ADP / Automatic Data Processing, Inc. | 0,00 | 6,81 | 1,06 | 7,81 | 0,3814 | 0,0197 | |||
| DIS / The Walt Disney Company | 0,01 | -53,17 | 0,96 | -41,17 | 0,3428 | -0,2529 | |||
| LMT / Lockheed Martin Corporation | 0,00 | 1,04 | 0,90 | 4,79 | 0,3215 | 0,0077 | |||
| BRK.A / Berkshire Hathaway Inc. | 0,00 | 0,00 | 0,89 | -8,78 | 0,3204 | -0,0388 | |||
| SBUX / Starbucks Corporation | 0,01 | 0,00 | 0,83 | -6,56 | 0,2962 | -0,0280 | |||
| COR / Cencora, Inc. | 0,00 | -20,06 | 0,81 | -13,80 | 0,2891 | -0,0539 | |||
| REGN / Regeneron Pharmaceuticals, Inc. | 0,00 | -7,65 | 0,79 | -23,55 | 0,2841 | -0,0959 | |||
| PNC / The PNC Financial Services Group, Inc. | 0,00 | 0,00 | 0,77 | 6,10 | 0,2744 | 0,0098 | |||
| DLR / Digital Realty Trust, Inc. | 0,00 | -12,21 | 0,69 | 6,82 | 0,2470 | 0,0105 | |||
| DPZ / Domino's Pizza, Inc. | 0,00 | -0,65 | 0,69 | -2,55 | 0,2466 | -0,0122 | |||
| SAIC / Science Applications International Corporation | 0,01 | 0,00 | 0,67 | 0,30 | 0,2391 | -0,0046 | |||
| IJH / iShares Trust - iShares Core S&P Mid-Cap ETF | 0,01 | 0,63 | 0,64 | 7,04 | 0,2291 | 0,0101 | |||
| TSLA / Tesla, Inc. | 0,00 | 0,00 | 0,61 | 22,60 | 0,2200 | 0,0365 | |||
| NEE / NextEra Energy, Inc. | 0,01 | 0,99 | 0,60 | -0,99 | 0,2155 | -0,0073 | |||
| ABR0 / Barrick Mining Corporation | 0,03 | 0,59 | 0,2127 | 0,2127 | |||||
| BAC / Bank of America Corporation | 0,01 | 0,00 | 0,54 | 13,35 | 0,1920 | 0,0189 | |||
| TOL / Toll Brothers, Inc. | 0,00 | 0,00 | 0,52 | 8,04 | 0,1882 | 0,0102 | |||
| VIG / Vanguard Specialized Funds - Vanguard Dividend Appreciation ETF | 0,00 | 0,00 | 0,51 | 5,43 | 0,1814 | 0,0056 | |||
| SPY / SPDR S&P 500 ETF | 0,00 | 13,87 | 0,48 | 25,59 | 0,1727 | 0,0323 | |||
| KO / The Coca-Cola Company | 0,01 | 0,00 | 0,40 | -1,23 | 0,1436 | -0,0050 | |||
| VV / Vanguard Index Funds - Vanguard Large-Cap ETF | 0,00 | 0,00 | 0,39 | 11,17 | 0,1392 | 0,0110 | |||
| T / AT&T Inc. | 0,01 | -1,25 | 0,38 | 1,07 | 0,1360 | -0,0016 | |||
| PH / Parker-Hannifin Corporation | 0,00 | -8,73 | 0,37 | 4,89 | 0,1309 | 0,0033 | |||
| ATO / Atmos Energy Corporation | 0,00 | -25,26 | 0,34 | -25,39 | 0,1201 | -0,0447 | |||
| SDY / SPDR Series Trust - SPDR S&P Dividend ETF | 0,00 | 0,00 | 0,33 | 0,00 | 0,1180 | -0,0026 | |||
| CEG / Constellation Energy Corporation | 0,00 | 0,31 | 0,1128 | 0,1128 | |||||
| VST / Vistra Corp. | 0,00 | 0,31 | 0,1114 | 0,1114 | |||||
| MRK / Merck & Co., Inc. | 0,00 | 0,00 | 0,31 | -11,93 | 0,1114 | -0,0178 | |||
| CMI / Cummins Inc. | 0,00 | 0,00 | 0,30 | 4,61 | 0,1058 | 0,0023 | |||
| EQR / Equity Residential | 0,00 | 0,00 | 0,29 | -5,77 | 0,1054 | -0,0089 | |||
| IUSG / iShares Trust - iShares Core S&P U.S. Growth ETF | 0,00 | 1,83 | 0,28 | 20,85 | 0,1019 | 0,0154 | |||
| URI / United Rentals, Inc. | 0,00 | 0,00 | 0,28 | 20,17 | 0,1005 | 0,0150 | |||
| UNP / Union Pacific Corporation | 0,00 | 0,00 | 0,27 | -2,53 | 0,0968 | -0,0048 | |||
| SRE / Sempra | 0,00 | 0,00 | 0,26 | 6,20 | 0,0923 | 0,0034 | |||
| PFE / Pfizer Inc. | 0,01 | -13,47 | 0,26 | -17,42 | 0,0921 | -0,0217 | |||
| EW / Edwards Lifesciences Corporation | 0,00 | 0,00 | 0,25 | 8,23 | 0,0897 | 0,0047 | |||
| VUG / Vanguard Index Funds - Vanguard Growth ETF | 0,00 | 0,00 | 0,24 | 18,14 | 0,0866 | 0,0117 | |||
| FBIN / Fortune Brands Innovations, Inc. | 0,00 | 0,00 | 0,23 | -15,38 | 0,0828 | -0,0173 | |||
| IUSV / iShares Trust - iShares Core S&P U.S. Value ETF | 0,00 | 3,46 | 0,23 | 6,02 | 0,0822 | 0,0030 | |||
| VLO / Valero Energy Corporation | 0,00 | -8,12 | 0,22 | -6,33 | 0,0796 | -0,0074 | |||
| VNQ / Vanguard Specialized Funds - Vanguard Real Estate ETF | 0,00 | 7,58 | 0,22 | 6,25 | 0,0793 | 0,0027 | |||
| ADBE / Adobe Inc. | 0,00 | 0,00 | 0,22 | 0,93 | 0,0782 | -0,0011 | |||
| MDLZ / Mondelez International, Inc. | 0,00 | 0,00 | 0,22 | -0,92 | 0,0777 | -0,0022 | |||
| UBER / Uber Technologies, Inc. | 0,00 | 0,21 | 0,0744 | 0,0744 | |||||
| BABA / Alibaba Group Holding Limited - Depositary Receipt (Common Stock) | 0,00 | -100,00 | 0,00 | 0,0000 | |||||
| GOLD / Barrick Mining Corporation | 0,00 | -100,00 | 0,00 | 0,0000 |