Statistiques de base
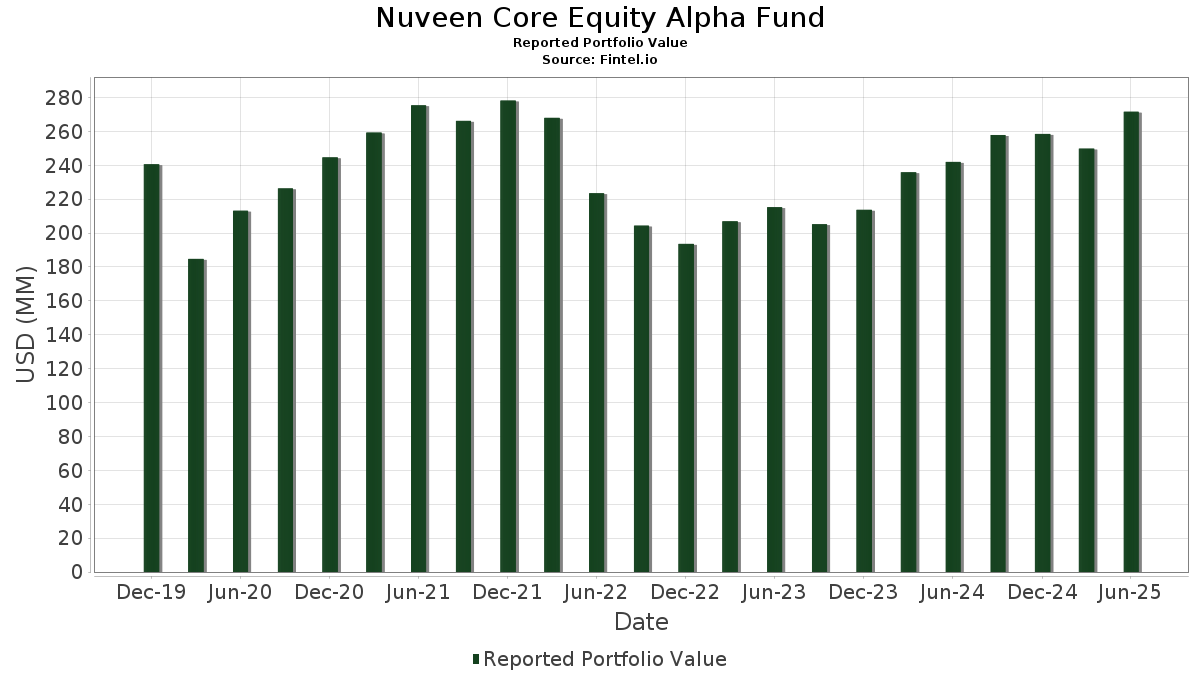
| Valeur du portefeuille | $ 271 610 273 |
| Positions actuelles | 133 |
Dernières positions, performances, ASG (à partir des dépôts 13F, 13D)
Nuveen Core Equity Alpha Fund a déclaré un total de 133 positions dans ses derniers dépôts auprès de la SEC. La valeur la plus récente du portefeuille est calculée à 271 610 273 USD. Les actifs sous gestion réels (ASG) sont cette valeur plus les liquidités (qui ne sont pas divulguées). Les principales positions de Nuveen Core Equity Alpha Fund sont NVIDIA Corporation (US:NVDA) , Microsoft Corporation (US:MSFT) , Apple Inc. (US:AAPL) , Amazon.com, Inc. (US:AMZN) , and Meta Platforms, Inc. (US:META) . Les nouvelles positions de Nuveen Core Equity Alpha Fund incluent Dreyfus Institutional Preferred Government Plus Money Market Fund (US:US85748R0096) , Azenta, Inc. (US:AZTA) , STERIS plc (US:STE) , Lyft, Inc. (US:LYFT) , and StandardAero, Inc. (US:SARO) .
Meilleures augmentations ce trimestre
Nous utilisons la variation de l'allocation du portefeuille car il s'agit de l'indicateur le plus significatif. Les changements peuvent être dus à des transactions ou à des variations de prix des actions.
| Titre | Actions (en millions) |
Valeur ($ en millions) |
% du portefeuille | ΔPortefeuille % |
|---|---|---|---|---|
| 0,13 | 21,21 | 7,9672 | 1,9006 | |
| 0,04 | 20,50 | 7,6983 | 1,2497 | |
| 0,02 | 3,03 | 1,1365 | 0,9161 | |
| 0,00 | 2,39 | 0,8993 | 0,8290 | |
| 0,01 | 1,93 | 0,7240 | 0,7240 | |
| 0,02 | 5,15 | 1,9361 | 0,6307 | |
| 0,05 | 1,41 | 0,5308 | 0,5308 | |
| 0,01 | 1,39 | 0,5206 | 0,5206 | |
| 0,02 | 1,38 | 0,5173 | 0,5173 | |
| 0,08 | 1,33 | 0,5003 | 0,5003 |
Principales baisses ce trimestre
Nous utilisons la variation de l'allocation du portefeuille car il s'agit de l'indicateur le plus significatif. Les changements peuvent être dus à des transactions ou à des variations de prix des actions.
| Titre | Actions (en millions) |
Valeur ($ en millions) |
% du portefeuille | ΔPortefeuille % |
|---|---|---|---|---|
| 0,08 | 16,91 | 6,3506 | -1,2818 | |
| 0,01 | 1,79 | 0,6721 | -0,8503 | |
| 0,00 | 0,16 | 0,0616 | -0,7432 | |
| 0,00 | 0,10 | 0,0358 | -0,6713 | |
| 0,00 | 0,63 | 0,2361 | -0,5796 | |
| 0,00 | 0,00 | -0,5760 | ||
| 0,02 | 1,30 | 0,4865 | -0,5607 | |
| 0,01 | 0,47 | 0,1771 | -0,5364 | |
| 0,01 | 6,14 | 2,3063 | -0,5259 | |
| 0,00 | 0,18 | 0,0673 | -0,5172 |
Déclarations 13F et dépôts de fonds
Ce formulaire a été déposé le 2025-08-27 pour la période de déclaration 2025-06-30. Cliquez sur l'icône du lien pour voir l'historique complet des transactions.
Mettre à niveau pour débloquer les données premium et exporter vers Excel ![]() .
.
| Titre | Type | Prix moyen de l'action | Actions (en millions) |
ΔActions (%) |
ΔActions (%) |
Valeur ($ en millions) |
Portefeuille (%) |
ΔPortefeuille (%) |
|
|---|---|---|---|---|---|---|---|---|---|
| NVDA / NVIDIA Corporation | 0,13 | -1,89 | 21,21 | 43,03 | 7,9672 | 1,9006 | |||
| MSFT / Microsoft Corporation | 0,04 | -1,88 | 20,50 | 30,01 | 7,6983 | 1,2497 | |||
| AAPL / Apple Inc. | 0,08 | -1,89 | 16,91 | -9,38 | 6,3506 | -1,2818 | |||
| AMZN / Amazon.com, Inc. | 0,06 | -1,88 | 12,13 | 13,14 | 4,5553 | 0,1705 | |||
| META / Meta Platforms, Inc. | 0,01 | -11,68 | 8,76 | 13,10 | 3,2907 | 0,1220 | |||
| BRK.B / Berkshire Hathaway Inc. | 0,01 | -2,77 | 6,14 | -11,31 | 2,3063 | -0,5259 | |||
| GOOG / Alphabet Inc. | 0,03 | -1,89 | 6,07 | 11,39 | 2,2814 | 0,0510 | |||
| AVGO / Broadcom Inc. | 0,02 | -1,89 | 5,15 | 61,52 | 1,9361 | 0,6307 | |||
| GOOGL / Alphabet Inc. | 0,03 | -1,99 | 5,12 | 11,70 | 1,9222 | 0,0479 | |||
| NFLX / Netflix, Inc. | 0,00 | -10,71 | 5,02 | 28,22 | 1,8862 | 0,2841 | |||
| US85748R0096 / Dreyfus Institutional Preferred Government Plus Money Market Fund | 4,96 | -11,68 | 1,8629 | -0,4343 | |||||
| IVV / iShares Trust - iShares Core S&P 500 ETF | 0,01 | 29,70 | 4,88 | 43,32 | 1,8330 | 0,4402 | |||
| WMT / Walmart Inc. | 0,04 | -1,89 | 3,50 | 9,30 | 1,3154 | 0,0044 | |||
| LLY / Eli Lilly and Company | 0,00 | -1,99 | 3,46 | -7,48 | 1,3000 | -0,2304 | |||
| TSLA / Tesla, Inc. | 0,01 | -6,38 | 3,26 | 14,78 | 1,2254 | 0,0624 | |||
| BKNG / Booking Holdings Inc. | 0,00 | -3,64 | 3,07 | 21,12 | 1,1525 | 0,1160 | |||
| HD / The Home Depot, Inc. | 0,01 | 87,98 | 3,04 | 88,06 | 1,1416 | 0,4805 | |||
| JNJ / Johnson & Johnson | 0,02 | 509,70 | 3,03 | 462,27 | 1,1365 | 0,9161 | |||
| CSCO / Cisco Systems, Inc. | 0,04 | -1,89 | 2,96 | 10,33 | 1,1112 | 0,0141 | |||
| DIS / The Walt Disney Company | 0,02 | 4,17 | 2,79 | 30,92 | 1,0480 | 0,1759 | |||
| RTX / RTX Corporation | 0,02 | -1,87 | 2,61 | 8,16 | 0,9806 | -0,0066 | |||
| NOW / ServiceNow, Inc. | 0,00 | 0,00 | 2,58 | 29,13 | 0,9692 | 0,1518 | |||
| CRM / Salesforce, Inc. | 0,01 | 0,32 | 2,55 | 1,96 | 0,9567 | -0,0654 | |||
| JPM / JPMorgan Chase & Co. | 0,01 | -1,92 | 2,52 | 15,95 | 0,9474 | 0,0573 | |||
| BSX / Boston Scientific Corporation | 0,02 | -1,89 | 2,40 | 4,44 | 0,9013 | -0,0383 | |||
| INTU / Intuit Inc. | 0,00 | 985,71 | 2,39 | 1 300,00 | 0,8993 | 0,8290 | |||
| LRCX / Lam Research Corporation | 0,02 | -1,89 | 2,32 | 31,39 | 0,8727 | 0,1492 | |||
| QCOM / QUALCOMM Incorporated | 0,01 | 0,28 | 2,26 | 3,96 | 0,8488 | -0,0403 | |||
| SCHW / The Charles Schwab Corporation | 0,02 | -1,87 | 2,25 | 14,36 | 0,8437 | 0,0403 | |||
| CME / CME Group Inc. | 0,01 | -1,86 | 2,18 | 1,96 | 0,8189 | -0,0558 | |||
| PEP / PepsiCo, Inc. | 0,02 | 1,55 | 2,17 | -10,61 | 0,8138 | -0,1773 | |||
| SPGI / S&P Global Inc. | 0,00 | 109,74 | 2,16 | 114,10 | 0,8100 | 0,4112 | |||
| ICE / Intercontinental Exchange, Inc. | 0,01 | -1,87 | 2,12 | 4,33 | 0,7966 | -0,0346 | |||
| ADBE / Adobe Inc. | 0,01 | 0,37 | 2,11 | 1,25 | 0,7920 | -0,0599 | |||
| HON / Honeywell International Inc. | 0,01 | -3,04 | 2,08 | 5,74 | 0,7820 | -0,0494 | |||
| CPNG / Coupang, Inc. | 0,07 | -1,89 | 2,02 | 33,97 | 0,7587 | 0,1422 | |||
| HOOD / Robinhood Markets, Inc. | 0,02 | -32,70 | 1,97 | 51,46 | 0,7396 | 0,2075 | |||
| C / Citigroup Inc. | 0,02 | -11,76 | 1,95 | 5,80 | 0,7337 | -0,0216 | |||
| GD / General Dynamics Corporation | 0,01 | -1,92 | 1,94 | 4,92 | 0,7285 | -0,0275 | |||
| CAH / Cardinal Health, Inc. | 0,01 | -1,87 | 1,94 | 19,72 | 0,7276 | 0,0654 | |||
| MDT / Medtronic plc | 0,02 | -1,90 | 1,94 | -4,82 | 0,7272 | -0,1050 | |||
| KLAC / KLA Corporation | 0,00 | -20,30 | 1,93 | 4,99 | 0,7267 | -0,0269 | |||
| TMUS / T-Mobile US, Inc. | 0,01 | 1,93 | 0,7240 | 0,7240 | |||||
| DHR / Danaher Corporation | 0,01 | -1,93 | 1,90 | -5,51 | 0,7145 | -0,1090 | |||
| DUK / Duke Energy Corporation | 0,02 | -1,86 | 1,87 | -5,08 | 0,7016 | -0,1032 | |||
| ECL / Ecolab Inc. | 0,01 | -1,91 | 1,80 | 4,23 | 0,6760 | -0,0302 | |||
| WMB / The Williams Companies, Inc. | 0,03 | -1,89 | 1,79 | 3,11 | 0,6738 | -0,0378 | |||
| V / Visa Inc. | 0,01 | -52,54 | 1,79 | -51,92 | 0,6721 | -0,8503 | |||
| MCK / McKesson Corporation | 0,00 | 30,65 | 1,78 | 124,18 | 0,6688 | 0,2950 | |||
| LMT / Lockheed Martin Corporation | 0,00 | 1,59 | 1,77 | 5,29 | 0,6663 | -0,0226 | |||
| EXC / Exelon Corporation | 0,04 | -1,89 | 1,76 | -7,57 | 0,6607 | -0,1176 | |||
| CL / Colgate-Palmolive Company | 0,02 | -1,88 | 1,75 | -4,83 | 0,6583 | -0,0949 | |||
| USB / U.S. Bancorp | 0,04 | 142,13 | 1,69 | 129,00 | 0,6350 | 0,3495 | |||
| MNST / Monster Beverage Corporation | 0,03 | -1,88 | 1,63 | 5,08 | 0,6134 | -0,0227 | |||
| AEP / American Electric Power Company, Inc. | 0,01 | 146,93 | 1,54 | 188,06 | 0,5803 | 0,3874 | |||
| JHG / Janus Henderson Group plc | 0,04 | 11,86 | 1,42 | 20,17 | 0,5351 | 0,0502 | |||
| GRMN / Garmin Ltd. | 0,01 | -1,88 | 1,42 | -5,65 | 0,5331 | -0,0824 | |||
| AZTA / Azenta, Inc. | 0,05 | 1,41 | 0,5308 | 0,5308 | |||||
| WSM / Williams-Sonoma, Inc. | 0,01 | 350,79 | 1,41 | 367,11 | 0,5283 | 0,4048 | |||
| FLS / Flowserve Corporation | 0,03 | 3,61 | 1,40 | 11,04 | 0,5254 | 0,0101 | |||
| CNC / Centene Corporation | 0,03 | -1,88 | 1,39 | -12,33 | 0,5213 | -0,1259 | |||
| STE / STERIS plc | 0,01 | 1,39 | 0,5206 | 0,5206 | |||||
| TSN / Tyson Foods, Inc. | 0,02 | -1,90 | 1,38 | -14,05 | 0,5198 | -0,1385 | |||
| SWKS / Skyworks Solutions, Inc. | 0,02 | 1,38 | 0,5173 | 0,5173 | |||||
| ZM / Zoom Communications Inc. | 0,02 | -1,89 | 1,38 | 3,77 | 0,5173 | -0,0259 | |||
| VOYA / Voya Financial, Inc. | 0,02 | 568,64 | 1,36 | 673,86 | 0,5118 | 0,4455 | |||
| DINO / HF Sinclair Corporation | 0,03 | -13,41 | 1,35 | 8,16 | 0,5079 | -0,0034 | |||
| LYFT / Lyft, Inc. | 0,08 | 1,33 | 0,5003 | 0,5003 | |||||
| PKG / Packaging Corporation of America | 0,01 | 14,47 | 1,33 | -4,19 | 0,4983 | -0,0373 | |||
| KD / Kyndryl Holdings, Inc. | 0,03 | 1 894,27 | 1,31 | 3 547,22 | 0,4935 | 0,4792 | |||
| SARO / StandardAero, Inc. | 0,04 | 1,31 | 0,4913 | 0,4913 | |||||
| HUM / Humana Inc. | 0,01 | 16,85 | 1,31 | -9,81 | 0,4904 | -0,0827 | |||
| MRK / Merck & Co., Inc. | 0,02 | -42,64 | 1,30 | -49,41 | 0,4865 | -0,5607 | |||
| VTR / Ventas, Inc. | 0,02 | -0,88 | 1,27 | -9,00 | 0,4789 | -0,0940 | |||
| HRB / H&R Block, Inc. | 0,02 | 5,09 | 1,27 | -9,23 | 0,4767 | -0,0768 | |||
| BMRN / BioMarin Pharmaceutical Inc. | 0,02 | 8,41 | 1,23 | -15,72 | 0,4633 | -0,1353 | |||
| CRH / CRH plc | 0,01 | -0,30 | 1,23 | 4,05 | 0,4631 | -0,0216 | |||
| INVH / Invitation Homes Inc. | 0,04 | 675,41 | 1,23 | 461,64 | 0,4624 | 0,3834 | |||
| TEAM / Atlassian Corporation | 0,01 | 11,01 | 1,21 | 6,24 | 0,4539 | -0,0114 | |||
| VNT / Vontier Corporation | 0,03 | 1,19 | 0,4481 | 0,4481 | |||||
| BAH / Booz Allen Hamilton Holding Corporation | 0,01 | -0,96 | 1,18 | -1,42 | 0,4420 | -0,0462 | |||
| VLTO / Veralto Corporation | 0,01 | -6,48 | 1,15 | -15,62 | 0,4326 | -0,1076 | |||
| KR / The Kroger Co. | 0,02 | -1,90 | 1,15 | 3,98 | 0,4316 | -0,0206 | |||
| SOFI / SoFi Technologies, Inc. | 0,06 | 151,39 | 1,09 | 293,84 | 0,4085 | 0,2955 | |||
| G / Genpact Limited | 0,02 | -5,35 | 1,06 | 29,50 | 0,3974 | 0,0521 | |||
| IDXX / IDEXX Laboratories, Inc. | 0,00 | -45,22 | 1,05 | -30,10 | 0,3928 | -0,2187 | |||
| XOM / Exxon Mobil Corporation | 0,01 | -8,44 | 1,01 | -17,01 | 0,3778 | -0,1180 | |||
| BIIB / Biogen Inc. | 0,01 | -17,89 | 0,98 | -24,63 | 0,3679 | -0,1638 | |||
| CTAS / Cintas Corporation | 0,00 | 146,59 | 0,97 | 167,87 | 0,3633 | 0,2153 | |||
| SO / The Southern Company | 0,01 | 35,97 | 0,96 | 35,73 | 0,3611 | 0,0715 | |||
| JCI / Johnson Controls International plc | 0,01 | -62,23 | 0,95 | -30,77 | 0,3559 | -0,2848 | |||
| KKR / KKR & Co. Inc. | 0,01 | -1,82 | 0,93 | 12,97 | 0,3503 | 0,0126 | |||
| GE / General Electric Company | 0,00 | -67,95 | 0,92 | -48,14 | 0,3451 | -0,4027 | |||
| MA / Mastercard Incorporated | 0,00 | -1,84 | 0,90 | 0,67 | 0,3379 | -0,0278 | |||
| MSI / Motorola Solutions, Inc. | 0,00 | -50,12 | 0,89 | -40,92 | 0,3348 | -0,3188 | |||
| TPR / Tapestry, Inc. | 0,01 | -70,54 | 0,83 | -45,56 | 0,3113 | -0,3477 | |||
| AYI / Acuity Inc. | 0,00 | -45,70 | 0,73 | -38,51 | 0,2757 | -0,2123 | |||
| PG / The Procter & Gamble Company | 0,00 | -1,99 | 0,71 | -8,42 | 0,2657 | -0,0501 | |||
| WDC / Western Digital Corporation | 0,01 | 0,68 | 0,2569 | 0,2569 | |||||
| UNH / UnitedHealth Group Incorporated | 0,00 | -1,86 | 0,66 | -41,56 | 0,2472 | -0,2134 | |||
| TMO / Thermo Fisher Scientific Inc. | 0,00 | -61,76 | 0,63 | -70,21 | 0,2361 | -0,5796 | |||
| ABBV / AbbVie Inc. | 0,00 | 121,71 | 0,63 | 96,54 | 0,2350 | 0,1047 | |||
| SMG / The Scotts Miracle-Gro Company | 0,01 | 0,60 | 0,2262 | 0,2262 | |||||
| COST / Costco Wholesale Corporation | 0,00 | -1,85 | 0,52 | 2,75 | 0,1971 | -0,0118 | |||
| CHRD / Chord Energy Corporation | 0,01 | -57,53 | 0,52 | -63,51 | 0,1939 | -0,3848 | |||
| BRO / Brown & Brown, Inc. | 0,00 | 0,51 | 0,1916 | 0,1916 | |||||
| RITM / Rithm Capital Corp. | 0,04 | -59,63 | 0,50 | -60,19 | 0,1894 | -0,3288 | |||
| CMCSA / Comcast Corporation | 0,01 | -73,12 | 0,47 | -74,46 | 0,1771 | -0,5364 | |||
| ADSK / Autodesk, Inc. | 0,00 | -16,36 | 0,43 | -0,93 | 0,1605 | -0,0162 | |||
| EW / Edwards Lifesciences Corporation | 0,01 | -75,35 | 0,43 | -73,40 | 0,1604 | -0,4963 | |||
| MAN / ManpowerGroup Inc. | 0,01 | 0,28 | 0,1067 | 0,1067 | |||||
| ESTC / Elastic N.V. | 0,00 | 0,26 | 0,0979 | 0,0979 | |||||
| TRGP / Targa Resources Corp. | 0,00 | -93,69 | 0,18 | -85,59 | 0,0673 | -0,5172 | |||
| WBD / Warner Bros. Discovery, Inc. | 0,02 | -72,62 | 0,18 | -72,73 | 0,0665 | -0,2613 | |||
| GILD / Gilead Sciences, Inc. | 0,00 | -91,57 | 0,16 | -91,66 | 0,0616 | -0,7432 | |||
| PPC / Pilgrim's Pride Corporation | 0,00 | 0,16 | 0,0583 | 0,0583 | |||||
| ORI / Old Republic International Corporation | 0,00 | -5,73 | 0,14 | 85,33 | 0,0523 | 0,0212 | |||
| DTE / DTE Energy Company | 0,00 | 0,13 | 0,0483 | 0,0483 | |||||
| FICO / Fair Isaac Corporation | 0,00 | 250,00 | 0,13 | 252,78 | 0,0481 | 0,0330 | |||
| DELL / Dell Technologies Inc. | 0,00 | 0,11 | 0,0410 | 0,0410 | |||||
| CRI / Carter's, Inc. | 0,00 | 0,11 | 0,0409 | 0,0409 | |||||
| MRVL / Marvell Technology, Inc. | 0,00 | 91,55 | 0,11 | 144,19 | 0,0395 | 0,0217 | |||
| BAC / Bank of America Corporation | 0,00 | -95,14 | 0,10 | -94,50 | 0,0358 | -0,6713 | |||
| VRSN / VeriSign, Inc. | 0,00 | -88,34 | 0,08 | -86,75 | 0,0282 | -0,2034 | |||
| CR / Crane Company | 0,00 | 0,04 | 0,0143 | 0,0143 | |||||
| PEGA / Pegasystems Inc. | 0,00 | 0,03 | 0,0130 | 0,0130 | |||||
| BROS / Dutch Bros Inc. | 0,00 | 0,02 | 0,0056 | 0,0056 | |||||
| MU / Micron Technology, Inc. - Depositary Receipt (Common Stock) | 0,00 | 0,0004 | 0,0004 | ||||||
| BWXT / BWX Technologies, Inc. | 0,00 | -100,00 | 0,00 | -100,00 | -0,0254 | ||||
| ITT / ITT Inc. | 0,00 | -100,00 | 0,00 | -100,00 | -0,4855 | ||||
| CHE / Chemed Corporation | 0,00 | -100,00 | 0,00 | -100,00 | -0,0881 | ||||
| ERIE / Erie Indemnity Company | 0,00 | -100,00 | 0,00 | -100,00 | -0,5760 | ||||
| MORN / Morningstar, Inc. | 0,00 | -100,00 | 0,00 | -100,00 | -0,4931 | ||||
| S&P 500 Index / DE (N/A) | -0,08 | -0,0291 | -0,0291 | ||||||
| S&P 500 Index / DE (N/A) | -0,15 | -0,0549 | -0,0549 | ||||||
| S&P 500 Index / DE (N/A) | -0,21 | -0,0771 | -0,0771 | ||||||
| S&P 500 Index / DE (N/A) | -0,37 | -0,1392 | -0,1392 | ||||||
| S&P 500 Index / DE (N/A) | -0,39 | -0,1461 | -0,1461 |