Statistiques de base
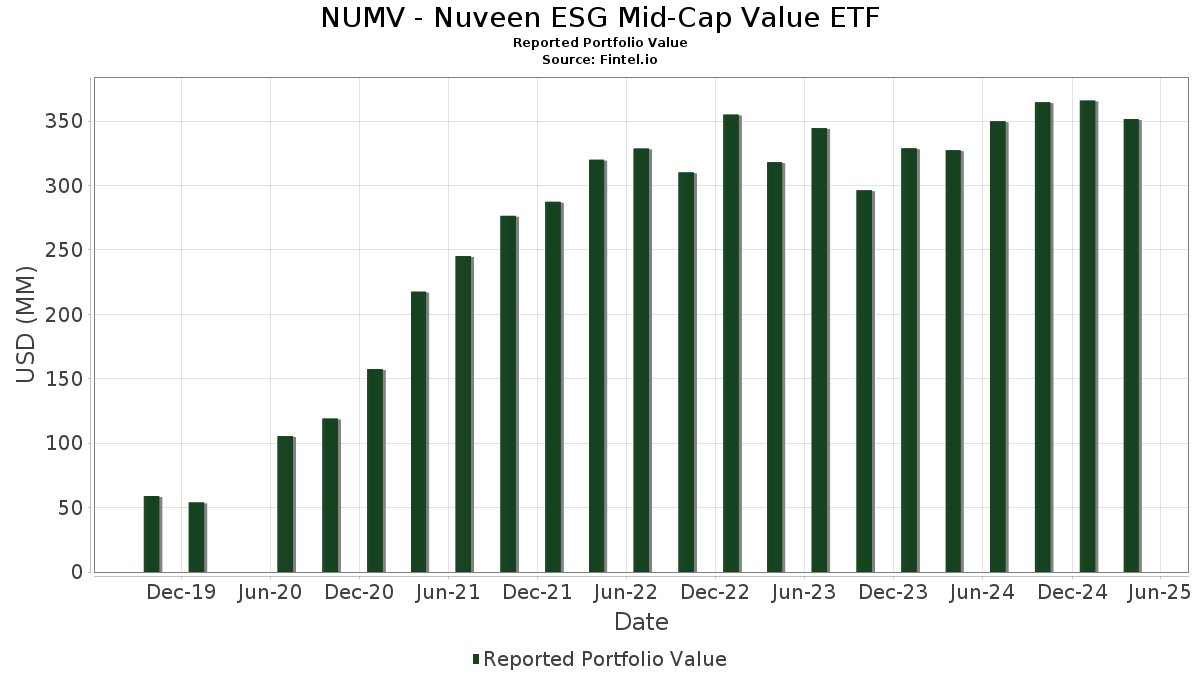
| Valeur du portefeuille | $ 351 562 763 |
| Positions actuelles | 100 |
Dernières positions, performances, ASG (à partir des dépôts 13F, 13D)
NUMV - Nuveen ESG Mid-Cap Value ETF a déclaré un total de 100 positions dans ses derniers dépôts auprès de la SEC. La valeur la plus récente du portefeuille est calculée à 351 562 763 USD. Les actifs sous gestion réels (ASG) sont cette valeur plus les liquidités (qui ne sont pas divulguées). Les principales positions de NUMV - Nuveen ESG Mid-Cap Value ETF sont Consolidated Edison, Inc. (US:ED) , Cardinal Health, Inc. (US:CAH) , The Hartford Insurance Group, Inc. (US:HIG) , United Rentals, Inc. (US:URI) , and Atmos Energy Corporation (US:ATO) . Les nouvelles positions de NUMV - Nuveen ESG Mid-Cap Value ETF incluent Consolidated Edison, Inc. (US:ED) , Archer-Daniels-Midland Company (CH:ADM) , Everest Group, Ltd. (IT:1EG) , Biogen Inc. (CH:BIIB) , and LPL Financial Holdings Inc. (US:LPLA) .
Meilleures augmentations ce trimestre
Nous utilisons la variation de l'allocation du portefeuille car il s'agit de l'indicateur le plus significatif. Les changements peuvent être dus à des transactions ou à des variations de prix des actions.
| Titre | Actions (en millions) |
Valeur ($ en millions) |
% du portefeuille | ΔPortefeuille % |
|---|---|---|---|---|
| 0,08 | 8,54 | 2,4254 | 2,4254 | |
| 0,14 | 6,66 | 1,8920 | 1,8920 | |
| 0,08 | 3,66 | 1,0391 | 1,0092 | |
| 0,05 | 6,56 | 1,8637 | 0,8237 | |
| 0,01 | 2,87 | 0,8146 | 0,8146 | |
| 0,02 | 2,73 | 0,7748 | 0,7748 | |
| 0,01 | 2,50 | 0,7108 | 0,7108 | |
| 0,04 | 2,26 | 0,6433 | 0,6433 | |
| 0,01 | 4,01 | 1,1393 | 0,5847 | |
| 0,04 | 5,30 | 1,5055 | 0,5767 |
Principales baisses ce trimestre
Nous utilisons la variation de l'allocation du portefeuille car il s'agit de l'indicateur le plus significatif. Les changements peuvent être dus à des transactions ou à des variations de prix des actions.
| Titre | Actions (en millions) |
Valeur ($ en millions) |
% du portefeuille | ΔPortefeuille % |
|---|---|---|---|---|
| 0,00 | 0,58 | 0,1641 | -0,8314 | |
| 0,01 | 1,07 | 0,3026 | -0,7947 | |
| 0,01 | 0,57 | 0,1630 | -0,6176 | |
| 0,18 | 6,21 | 1,7649 | -0,5097 | |
| 0,02 | 3,60 | 1,0221 | -0,4838 | |
| 0,08 | 1,03 | 0,2927 | -0,3919 | |
| 0,02 | 1,45 | 0,4118 | -0,3793 | |
| 0,04 | 3,55 | 1,0098 | -0,3120 | |
| 0,07 | 2,78 | 0,7907 | -0,2699 | |
| 0,31 | 4,95 | 1,4070 | -0,2688 |
Déclarations 13F et dépôts de fonds
Ce formulaire a été déposé le 2025-06-26 pour la période de déclaration 2025-04-30. Cliquez sur l'icône du lien pour voir l'historique complet des transactions.
Mettre à niveau pour débloquer les données premium et exporter vers Excel ![]() .
.
| Titre | Type | Prix moyen de l'action | Actions (en millions) |
ΔActions (%) |
ΔActions (%) |
Valeur ($ en millions) |
Portefeuille (%) |
ΔPortefeuille (%) |
|
|---|---|---|---|---|---|---|---|---|---|
| ED / Consolidated Edison, Inc. | 0,08 | 8,54 | 2,4254 | 2,4254 | |||||
| CAH / Cardinal Health, Inc. | 0,06 | 2,04 | 7,89 | 16,60 | 2,2416 | 0,3938 | |||
| HIG / The Hartford Insurance Group, Inc. | 0,06 | 5,07 | 7,84 | 15,55 | 2,2278 | 0,3748 | |||
| URI / United Rentals, Inc. | 0,01 | 12,16 | 7,25 | -6,57 | 2,0596 | -0,0591 | |||
| ATO / Atmos Energy Corporation | 0,04 | 1,82 | 7,04 | 14,77 | 2,0008 | 0,3253 | |||
| WTW / Willis Towers Watson Public Limited Company | 0,02 | 17,13 | 6,86 | 9,41 | 1,9495 | 0,2368 | |||
| CBOE / Cboe Global Markets, Inc. | 0,03 | 4,23 | 6,84 | 13,14 | 1,9423 | 0,2924 | |||
| ADM / Archer-Daniels-Midland Company | 0,14 | 6,66 | 1,8920 | 1,8920 | |||||
| FERG / Ferguson Enterprises Inc. | 0,04 | 5,56 | 6,66 | -1,13 | 1,8909 | 0,0530 | |||
| XYL / Xylem Inc. | 0,05 | 77,19 | 6,56 | 72,22 | 1,8637 | 0,8237 | |||
| K / Kellanova | 0,08 | 5,28 | 6,50 | 6,61 | 1,8465 | 0,1820 | |||
| WTRG / Essential Utilities, Inc. | 0,15 | 9,76 | 6,31 | 27,25 | 1,7921 | 0,4385 | |||
| ES / Eversource Energy | 0,10 | 2,40 | 6,24 | 5,60 | 1,7738 | 0,1594 | |||
| PPG / PPG Industries, Inc. | 0,06 | 5,02 | 6,24 | -0,92 | 1,7727 | 0,0533 | |||
| BR / Broadridge Financial Solutions, Inc. | 0,03 | 5,34 | 6,22 | 7,20 | 1,7677 | 0,1828 | |||
| BKR / Baker Hughes Company | 0,18 | -2,72 | 6,21 | -25,43 | 1,7649 | -0,5097 | |||
| STE / STERIS plc | 0,03 | 5,53 | 6,20 | 7,49 | 1,7608 | 0,1864 | |||
| BG / Bunge Global SA | 0,08 | 22,29 | 6,16 | 26,45 | 1,7510 | 0,4202 | |||
| IFF / International Flavors & Fragrances Inc. | 0,07 | 14,37 | 5,83 | 3,02 | 1,6562 | 0,1113 | |||
| GPC / Genuine Parts Company | 0,05 | 3,71 | 5,82 | 4,88 | 1,6537 | 0,1382 | |||
| IRM / Iron Mountain Incorporated | 0,06 | 20,14 | 5,82 | 6,07 | 1,6526 | 0,1551 | |||
| TTWO / Take-Two Interactive Software, Inc. | 0,02 | -13,15 | 5,77 | 9,23 | 1,6379 | 0,1968 | |||
| WPC / W. P. Carey Inc. | 0,09 | -0,05 | 5,74 | 11,61 | 1,6300 | 0,2266 | |||
| PHM / PulteGroup, Inc. | 0,05 | 5,13 | 5,56 | -5,22 | 1,5800 | -0,0222 | |||
| HBAN / Huntington Bancshares Incorporated | 0,38 | 1,43 | 5,47 | -14,31 | 1,5529 | -0,1889 | |||
| STLD / Steel Dynamics, Inc. | 0,04 | 53,97 | 5,30 | 55,81 | 1,5055 | 0,5767 | |||
| CBRE / CBRE Group, Inc. | 0,04 | 5,20 | 5,16 | -11,20 | 1,4664 | -0,1207 | |||
| TRMB / Trimble Inc. | 0,08 | 0,01 | 5,08 | -17,09 | 1,4435 | -0,2298 | |||
| DFS / Discover Financial Services | 0,03 | 5,56 | 5,06 | -4,11 | 1,4378 | -0,0033 | |||
| BXP / Boston Properties, Inc. | 0,08 | 12,04 | 4,97 | -2,38 | 1,4106 | 0,0219 | |||
| NLY / Annaly Capital Management, Inc. | 0,25 | 5,51 | 4,96 | 1,33 | 1,4089 | 0,0725 | |||
| SOLV / Solventum Corporation | 0,07 | -2,78 | 4,96 | -13,19 | 1,4080 | -0,1510 | |||
| HPE / Hewlett Packard Enterprise Company | 0,31 | 5,42 | 4,95 | -19,31 | 1,4070 | -0,2688 | |||
| CNH / CNH Industrial N.V. | 0,42 | 1,57 | 4,90 | -8,77 | 1,3917 | -0,0743 | |||
| DOC / Healthpeak Properties, Inc. | 0,27 | 5,80 | 4,84 | -8,65 | 1,3744 | -0,0714 | |||
| BLL / Ball Corp. | 0,09 | 5,85 | 4,83 | -1,31 | 1,3729 | 0,0361 | |||
| HST / Host Hotels & Resorts, Inc. | 0,33 | 6,91 | 4,67 | -9,65 | 1,3279 | -0,0848 | |||
| FSLR / First Solar, Inc. | 0,04 | 11,95 | 4,64 | -15,91 | 1,3185 | -0,1885 | |||
| OC / Owens Corning | 0,03 | 5,82 | 4,63 | -16,62 | 1,3158 | -0,2009 | |||
| EQH / Equitable Holdings, Inc. | 0,08 | 1,15 | 4,05 | -8,08 | 1,1500 | -0,0525 | |||
| EME / EMCOR Group, Inc. | 0,01 | 120,78 | 4,01 | 97,44 | 1,1393 | 0,5847 | |||
| CHD / Church & Dwight Co., Inc. | 0,04 | 75,83 | 3,82 | 65,57 | 1,0848 | 0,4550 | |||
| MKC / McCormick & Company, Incorporated | 0,05 | 25,93 | 3,68 | 25,00 | 1,0443 | 0,2414 | |||
| IP / International Paper Company | 0,08 | 3 962,40 | 3,66 | 3 255,05 | 1,0391 | 1,0092 | |||
| WST / West Pharmaceutical Services, Inc. | 0,02 | 5,44 | 3,60 | -34,78 | 1,0221 | -0,4838 | |||
| TRU / TransUnion | 0,04 | -31,89 | 3,55 | -18,34 | 1,0098 | -0,3120 | |||
| ULTA / Ulta Beauty, Inc. | 0,01 | -19,32 | 3,42 | -22,56 | 0,9727 | -0,2343 | |||
| IPG / The Interpublic Group of Companies, Inc. | 0,13 | -6,43 | 3,35 | -18,01 | 0,9506 | -0,1638 | |||
| FFIV / F5, Inc. | 0,01 | 39,46 | 3,27 | 24,23 | 0,9293 | 0,2102 | |||
| EXPD / Expeditors International of Washington, Inc. | 0,03 | -20,45 | 3,24 | -23,02 | 0,9198 | -0,2285 | |||
| WDC / Western Digital Corporation | 0,07 | 23,43 | 3,22 | -16,89 | 0,9146 | -0,1429 | |||
| LH / Labcorp Holdings Inc. | 0,01 | 5,95 | 3,19 | 2,21 | 0,9064 | 0,0542 | |||
| ARE / Alexandria Real Estate Equities, Inc. | 0,04 | 7,03 | 3,07 | -20,12 | 0,8729 | -0,1773 | |||
| 1EG / Everest Group, Ltd. | 0,01 | 2,87 | 0,8146 | 0,8146 | |||||
| ALLE / Allegion plc | 0,02 | -19,25 | 2,85 | -15,32 | 0,8104 | -0,1093 | |||
| STT / State Street Corporation | 0,03 | 6,01 | 2,83 | -8,10 | 0,8027 | -0,0367 | |||
| LKQ / LKQ Corporation | 0,07 | -29,88 | 2,78 | -28,35 | 0,7907 | -0,2699 | |||
| NDAQ / Nasdaq, Inc. | 0,04 | 29,13 | 2,74 | 19,49 | 0,7786 | 0,1525 | |||
| CCK / Crown Holdings, Inc. | 0,03 | 5,93 | 2,74 | 16,16 | 0,7783 | 0,1342 | |||
| BIIB / Biogen Inc. | 0,02 | 2,73 | 0,7748 | 0,7748 | |||||
| VLTO / Veralto Corporation | 0,03 | 5,59 | 2,71 | -2,06 | 0,7705 | 0,0144 | |||
| TROW / T. Rowe Price Group, Inc. | 0,03 | 5,89 | 2,67 | -19,80 | 0,7571 | -0,1502 | |||
| RJF / Raymond James Financial, Inc. | 0,02 | 6,19 | 2,50 | -13,63 | 0,7109 | -0,0801 | |||
| LPLA / LPL Financial Holdings Inc. | 0,01 | 2,50 | 0,7108 | 0,7108 | |||||
| RIVN / Rivian Automotive, Inc. | 0,18 | 5,11 | 2,49 | 14,30 | 0,7087 | 0,1129 | |||
| GIS / General Mills, Inc. | 0,04 | 2,26 | 0,6433 | 0,6433 | |||||
| KMX / CarMax, Inc. | 0,03 | 5,11 | 2,18 | -20,64 | 0,6183 | -0,1304 | |||
| TWLO / Twilio Inc. | 0,02 | 37,68 | 2,16 | -9,16 | 0,6147 | -0,0357 | |||
| POOL / Pool Corporation | 0,01 | 6,01 | 2,03 | -9,73 | 0,5770 | -0,0373 | |||
| MTD / Mettler-Toledo International Inc. | 0,00 | 5,84 | 1,98 | -16,98 | 0,5627 | -0,0885 | |||
| J / Jacobs Solutions Inc. | 0,02 | 5,25 | 1,86 | -7,05 | 0,5286 | -0,0178 | |||
| DGX / Quest Diagnostics Incorporated | 0,01 | 6,11 | 1,77 | 15,94 | 0,5021 | 0,0859 | |||
| JBHT / J.B. Hunt Transport Services, Inc. | 0,01 | 6,25 | 1,69 | -18,99 | 0,4815 | -0,0896 | |||
| PNR / Pentair plc | 0,02 | 4,94 | 1,67 | -8,18 | 0,4753 | -0,0221 | |||
| DOV / Dover Corporation | 0,01 | 5,25 | 1,64 | -11,79 | 0,4654 | -0,0418 | |||
| VTR / Ventas, Inc. | 0,02 | 67,13 | 1,60 | 93,94 | 0,4546 | 0,2292 | |||
| KEYS / Keysight Technologies, Inc. | 0,01 | 5,89 | 1,56 | -13,71 | 0,4420 | -0,0501 | |||
| HOLX / Hologic, Inc. | 0,02 | -37,99 | 1,45 | -49,98 | 0,4118 | -0,3793 | |||
| AIZ / Assurant, Inc. | 0,01 | 89,77 | 1,35 | 69,89 | 0,3849 | 0,1672 | |||
| FOX / Fox Corporation | 0,03 | 3,51 | 1,31 | -1,51 | 0,3712 | 0,0089 | |||
| SYF / Synchrony Financial | 0,02 | 2,43 | 1,26 | -22,86 | 0,3577 | -0,0879 | |||
| FTV / Fortive Corporation | 0,02 | 1,21 | 0,3425 | 0,3425 | |||||
| CFG / Citizens Financial Group, Inc. | 0,03 | 6,25 | 1,08 | -17,58 | 0,3063 | -0,0510 | |||
| AKAM / Akamai Technologies, Inc. | 0,01 | -67,14 | 1,07 | -73,50 | 0,3026 | -0,7947 | |||
| AVTR / Avantor, Inc. | 0,08 | -29,52 | 1,03 | -58,92 | 0,2927 | -0,3919 | |||
| TSCO / Tractor Supply Company | 0,02 | 0,87 | 0,2462 | 0,2462 | |||||
| AVB / AvalonBay Communities, Inc. | 0,00 | 1 627,63 | 0,83 | 1 554,00 | 0,2350 | 0,2212 | |||
| WSM / Williams-Sonoma, Inc. | 0,01 | 0,82 | 0,2334 | 0,2334 | |||||
| MKL / Markel Group Inc. | 0,00 | 0,73 | 0,2077 | 0,2077 | |||||
| CLX / The Clorox Company | 0,00 | 37,05 | 0,70 | 22,90 | 0,1999 | 0,0436 | |||
| DVA / DaVita Inc. | 0,00 | -86,14 | 0,58 | -81,92 | 0,1641 | -0,8314 | |||
| DAY / Dayforce Inc. | 0,01 | -75,46 | 0,57 | -79,95 | 0,1630 | -0,6176 | |||
| CHRW / C.H. Robinson Worldwide, Inc. | 0,01 | 6,76 | 0,53 | -4,33 | 0,1508 | -0,0006 | |||
| CNC / Centene Corporation | 0,01 | 0,44 | 0,1238 | 0,1238 | |||||
| US8575093013 / State Street Navigator Securities Lending Government Money Market Portfolio | 0,20 | -0,36 | 0,20 | 0,00 | 0,0555 | 0,0020 | |||
| NTAP / NetApp, Inc. | 0,00 | 9,30 | 0,16 | -19,61 | 0,0467 | -0,0092 | |||
| HPQ / HP Inc. | 0,00 | 0,08 | 0,0221 | 0,0221 | |||||
| KIM / Kimco Realty Corporation | 0,00 | 12,58 | 0,08 | 1,32 | 0,0219 | 0,0009 | |||
| REG / Regency Centers Corporation | 0,00 | -22,65 | 0,06 | -22,54 | 0,0157 | -0,0037 | |||
| AVY / Avery Dennison Corporation | 0,00 | 37,77 | 0,05 | 25,58 | 0,0156 | 0,0038 | |||
| MOH / Molina Healthcare, Inc. | 0,00 | -100,00 | 0,00 | -100,00 | -0,1813 |