Statistiques de base
| Valeur du portefeuille | $ 26 861 544 |
| Positions actuelles | 124 |
Dernières positions, performances, ASG (à partir des dépôts 13F, 13D)
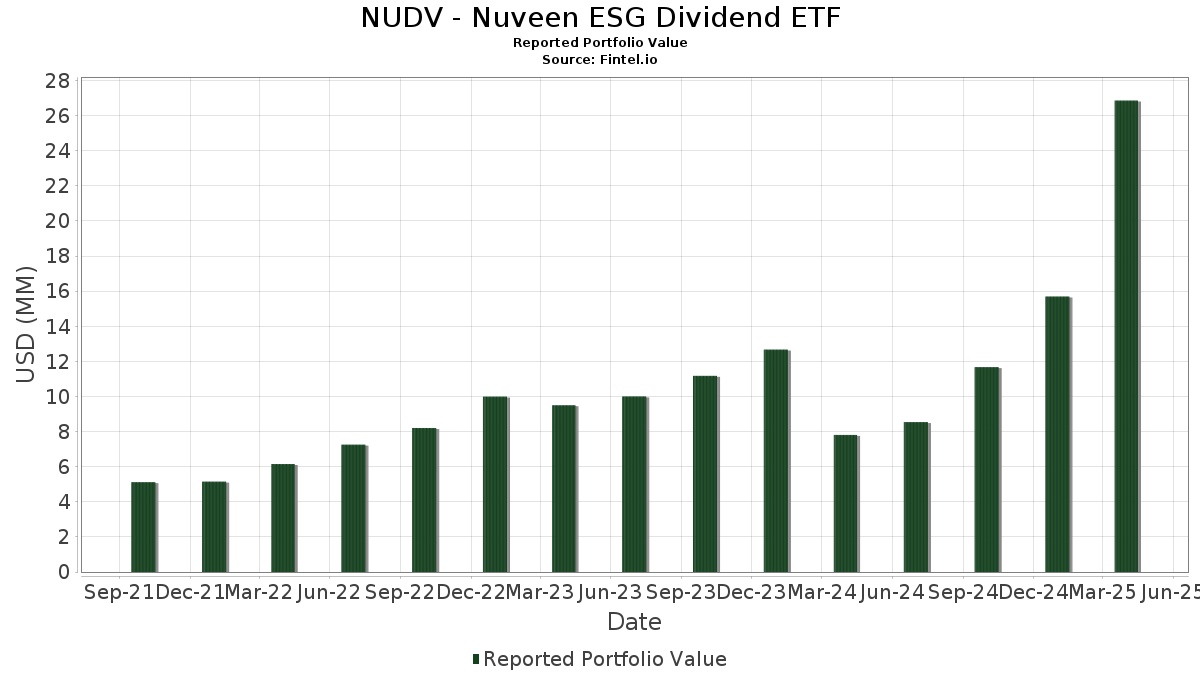
NUDV - Nuveen ESG Dividend ETF a déclaré un total de 124 positions dans ses derniers dépôts auprès de la SEC. La valeur la plus récente du portefeuille est calculée à 26 861 544 USD. Les actifs sous gestion réels (ASG) sont cette valeur plus les liquidités (qui ne sont pas divulguées). Les principales positions de NUDV - Nuveen ESG Dividend ETF sont The Procter & Gamble Company (US:PG) , AbbVie Inc. (US:ABBV) , The Coca-Cola Company (US:KO) , The Home Depot, Inc. (US:HD) , and American Tower Corporation (US:AMT) . Les nouvelles positions de NUDV - Nuveen ESG Dividend ETF incluent AbbVie Inc. (US:ABBV) , Zoetis Inc. (US:ZTS) , CSX Corporation (GB:0HRJ) , The Allstate Corporation (US:ALL) , and Humana Inc. (US:HUM) .
Meilleures augmentations ce trimestre
Nous utilisons la variation de l'allocation du portefeuille car il s'agit de l'indicateur le plus significatif. Les changements peuvent être dus à des transactions ou à des variations de prix des actions.
| Titre | Actions (en millions) |
Valeur ($ en millions) |
% du portefeuille | ΔPortefeuille % |
|---|---|---|---|---|
| 0,00 | 0,54 | 2,0157 | 2,0157 | |
| 0,00 | 0,38 | 1,4046 | 1,4046 | |
| 0,01 | 0,29 | 1,0790 | 1,0790 | |
| 0,00 | 0,28 | 1,0462 | 1,0462 | |
| 0,00 | 0,19 | 0,7079 | 0,6385 | |
| 0,00 | 0,17 | 0,6267 | 0,6267 | |
| 0,00 | 0,49 | 1,8018 | 0,4341 | |
| 0,01 | 0,27 | 1,0133 | 0,4021 | |
| 0,00 | 0,12 | 0,4549 | 0,3735 | |
| 0,00 | 0,09 | 0,3241 | 0,3241 |
Principales baisses ce trimestre
Nous utilisons la variation de l'allocation du portefeuille car il s'agit de l'indicateur le plus significatif. Les changements peuvent être dus à des transactions ou à des variations de prix des actions.
| Titre | Actions (en millions) |
Valeur ($ en millions) |
% du portefeuille | ΔPortefeuille % |
|---|---|---|---|---|
| 0,00 | 0,19 | 0,6903 | -0,5946 | |
| 0,01 | 0,36 | 1,3393 | -0,4573 | |
| 0,00 | 0,24 | 0,8821 | -0,3426 | |
| 0,00 | 0,39 | 1,4305 | -0,3256 | |
| 0,00 | 0,45 | 1,6745 | -0,3170 | |
| 0,00 | 0,38 | 1,4043 | -0,3132 | |
| 0,00 | 0,40 | 1,4777 | -0,3131 | |
| 0,00 | 0,37 | 1,3766 | -0,2674 | |
| 0,00 | 0,38 | 1,3954 | -0,2170 | |
| 0,01 | 0,45 | 1,6876 | -0,2145 |
Déclarations 13F et dépôts de fonds
Ce formulaire a été déposé le 2025-06-26 pour la période de déclaration 2025-04-30. Cliquez sur l'icône du lien pour voir l'historique complet des transactions.
Mettre à niveau pour débloquer les données premium et exporter vers Excel ![]() .
.
| Titre | Type | Prix moyen de l'action | Actions (en millions) |
ΔActions (%) |
ΔActions (%) |
Valeur ($ en millions) |
Portefeuille (%) |
ΔPortefeuille (%) |
|
|---|---|---|---|---|---|---|---|---|---|
| PG / The Procter & Gamble Company | 0,00 | 206,96 | 0,56 | 260,65 | 2,0759 | -0,0622 | |||
| ABBV / AbbVie Inc. | 0,00 | 0,54 | 2,0157 | 2,0157 | |||||
| KO / The Coca-Cola Company | 0,01 | 68,15 | 0,54 | 92,14 | 1,9969 | 0,2195 | |||
| HD / The Home Depot, Inc. | 0,00 | 80,61 | 0,51 | 57,85 | 1,9063 | -0,1569 | |||
| AMT / American Tower Corporation | 0,00 | 84,89 | 0,49 | 125,58 | 1,8018 | 0,4341 | |||
| VZ / Verizon Communications Inc. | 0,01 | 79,67 | 0,49 | 101,24 | 1,8005 | 0,2681 | |||
| MRK / Merck & Co., Inc. | 0,01 | 103,33 | 0,48 | 75,36 | 1,7975 | 0,0436 | |||
| BAC / Bank of America Corporation | 0,01 | 76,19 | 0,45 | 51,84 | 1,6876 | -0,2145 | |||
| IBM / International Business Machines Corporation | 0,00 | 52,08 | 0,45 | 44,09 | 1,6745 | -0,3170 | |||
| ELV / Elevance Health, Inc. | 0,00 | 90,86 | 0,45 | 103,18 | 1,6622 | 0,2607 | |||
| AMGN / Amgen Inc. | 0,00 | 84,36 | 0,44 | 88,09 | 1,6421 | 0,1474 | |||
| GILD / Gilead Sciences, Inc. | 0,00 | 61,77 | 0,44 | 77,24 | 1,6194 | 0,0572 | |||
| PFE / Pfizer Inc. | 0,02 | 86,25 | 0,42 | 71,60 | 1,5506 | 0,0035 | |||
| ADP / Automatic Data Processing, Inc. | 0,00 | 78,78 | 0,42 | 77,35 | 1,5417 | 0,0549 | |||
| WELL / Welltower Inc. | 0,00 | 63,23 | 0,42 | 82,82 | 1,5408 | 0,0967 | |||
| MMC / Marsh & McLennan Companies, Inc. | 0,00 | 76,77 | 0,41 | 83,48 | 1,5278 | 0,1058 | |||
| CMCSA / Comcast Corporation | 0,01 | 108,94 | 0,41 | 112,50 | 1,5163 | 0,2946 | |||
| DE / Deere & Company | 0,00 | 45,10 | 0,40 | 41,13 | 1,4777 | -0,3131 | |||
| CAT / Caterpillar Inc. | 0,00 | 92,46 | 0,39 | 60,16 | 1,4645 | -0,0987 | |||
| LOW / Lowe's Companies, Inc. | 0,00 | 92,38 | 0,39 | 65,53 | 1,4444 | -0,0494 | |||
| TXN / Texas Instruments Incorporated | 0,00 | 94,39 | 0,39 | 68,26 | 1,4397 | -0,0215 | |||
| BMY / Bristol-Myers Squibb Company | 0,01 | 91,32 | 0,39 | 63,29 | 1,4374 | -0,0717 | |||
| GS / The Goldman Sachs Group, Inc. | 0,00 | 62,96 | 0,39 | 39,49 | 1,4305 | -0,3256 | |||
| UNP / Union Pacific Corporation | 0,00 | 73,20 | 0,38 | 51,00 | 1,4069 | -0,1895 | |||
| ZTS / Zoetis Inc. | 0,00 | 0,38 | 1,4046 | 1,4046 | |||||
| ACN / Accenture plc | 0,00 | 184,27 | 0,38 | 157,14 | 1,4043 | -0,3132 | |||
| EQIX / Equinix, Inc. | 0,00 | 74,90 | 0,38 | 64,63 | 1,4023 | -0,0534 | |||
| MMM / 3M Company | 0,00 | 62,19 | 0,38 | 48,03 | 1,3954 | -0,2170 | |||
| MS / Morgan Stanley | 0,00 | 71,78 | 0,37 | 42,86 | 1,3766 | -0,2674 | |||
| ITW / Illinois Tool Works Inc. | 0,00 | 86,74 | 0,37 | 72,77 | 1,3666 | 0,0144 | |||
| C / Citigroup Inc. | 0,01 | 51,84 | 0,36 | 27,21 | 1,3393 | -0,4573 | |||
| PLD / Prologis, Inc. | 0,00 | 127,29 | 0,35 | 131,37 | 1,3172 | -0,0554 | |||
| USB / U.S. Bancorp | 0,01 | 91,22 | 0,34 | 62,02 | 1,2521 | -0,0745 | |||
| PNC / The PNC Financial Services Group, Inc. | 0,00 | 90,32 | 0,33 | 52,56 | 1,2189 | -0,1510 | |||
| NEM / Newmont Corporation | 0,01 | 75,88 | 0,32 | 116,89 | 1,1949 | 0,2526 | |||
| TRV / The Travelers Companies, Inc. | 0,00 | 75,72 | 0,32 | 89,94 | 1,1919 | 0,1150 | |||
| BK / The Bank of New York Mellon Corporation | 0,00 | 71,23 | 0,31 | 60,42 | 1,1456 | -0,0773 | |||
| AFL / Aflac Incorporated | 0,00 | 75,31 | 0,31 | 77,46 | 1,1426 | 0,0411 | |||
| JCI / Johnson Controls International plc | 0,00 | 75,12 | 0,30 | 88,61 | 1,1069 | 0,1018 | |||
| 0HRJ / CSX Corporation | 0,01 | 0,29 | 1,0790 | 1,0790 | |||||
| ALL / The Allstate Corporation | 0,00 | 0,28 | 1,0462 | 1,0462 | |||||
| TFC / Truist Financial Corporation | 0,01 | 252,23 | 0,27 | 184,38 | 1,0133 | 0,4021 | |||
| OKE / ONEOK, Inc. | 0,00 | 87,37 | 0,27 | 58,14 | 1,0129 | -0,0807 | |||
| CARR / Carrier Global Corporation | 0,00 | 206,14 | 0,27 | 211,49 | 1,0061 | -0,1061 | |||
| PAYX / Paychex, Inc. | 0,00 | 76,35 | 0,26 | 75,86 | 0,9483 | 0,0251 | |||
| EXC / Exelon Corporation | 0,01 | 77,46 | 0,25 | 108,26 | 0,9386 | 0,1670 | |||
| SRE / Sempra | 0,00 | 76,46 | 0,25 | 58,49 | 0,9357 | -0,0771 | |||
| NXPI / NXP Semiconductors N.V. | 0,00 | 76,20 | 0,25 | 55,90 | 0,9316 | -0,0917 | |||
| DFS / Discover Financial Services | 0,00 | 76,77 | 0,25 | 60,78 | 0,9131 | -0,0595 | |||
| KVUE / Kenvue Inc. | 0,01 | 76,80 | 0,24 | 96,75 | 0,9008 | 0,1146 | |||
| MET / MetLife, Inc. | 0,00 | 74,50 | 0,24 | 51,92 | 0,8824 | -0,1104 | |||
| TGT / Target Corporation | 0,00 | 75,70 | 0,24 | 23,44 | 0,8821 | -0,3426 | |||
| KMB / Kimberly-Clark Corporation | 0,00 | 75,17 | 0,24 | 78,79 | 0,8763 | 0,0324 | |||
| FIS / Fidelity National Information Services, Inc. | 0,00 | 74,49 | 0,23 | 68,89 | 0,8468 | -0,0106 | |||
| CMI / Cummins Inc. | 0,00 | 77,16 | 0,22 | 45,95 | 0,8037 | -0,1370 | |||
| ED / Consolidated Edison, Inc. | 0,00 | 77,60 | 0,21 | 114,29 | 0,7795 | 0,1553 | |||
| PRU / Prudential Financial, Inc. | 0,00 | 75,58 | 0,20 | 48,85 | 0,7261 | -0,1056 | |||
| HIG / The Hartford Insurance Group, Inc. | 0,00 | 1 486,73 | 0,19 | 1 800,00 | 0,7079 | 0,6385 | |||
| BKR / Baker Hughes Company | 0,01 | 75,70 | 0,19 | 34,53 | 0,6964 | -0,1880 | |||
| CI / The Cigna Group | 0,00 | -20,49 | 0,19 | -7,92 | 0,6903 | -0,5946 | |||
| CAH / Cardinal Health, Inc. | 0,00 | 76,73 | 0,18 | 103,33 | 0,6811 | 0,1042 | |||
| FERG / Ferguson Enterprises Inc. | 0,00 | 76,35 | 0,18 | 65,45 | 0,6762 | -0,0239 | |||
| HUM / Humana Inc. | 0,00 | 0,17 | 0,6267 | 0,6267 | |||||
| BR / Broadridge Financial Solutions, Inc. | 0,00 | 75,77 | 0,15 | 79,76 | 0,5613 | 0,0245 | |||
| ROK / Rockwell Automation, Inc. | 0,00 | 75,29 | 0,15 | 56,84 | 0,5542 | -0,0537 | |||
| TSCO / Tractor Supply Company | 0,00 | 75,23 | 0,15 | 62,92 | 0,5395 | -0,0260 | |||
| RJF / Raymond James Financial, Inc. | 0,00 | 198,57 | 0,14 | 238,10 | 0,5299 | -0,0139 | |||
| KHC / The Kraft Heinz Company | 0,00 | 229,80 | 0,14 | 187,76 | 0,5246 | 0,1034 | |||
| IRM / Iron Mountain Incorporated | 0,00 | 76,66 | 0,14 | 56,67 | 0,5238 | -0,0507 | |||
| STT / State Street Corporation | 0,00 | 76,15 | 0,14 | 53,33 | 0,5143 | -0,0617 | |||
| PPG / PPG Industries, Inc. | 0,00 | 75,42 | 0,14 | 66,67 | 0,5017 | -0,0168 | |||
| ATO / Atmos Energy Corporation | 0,00 | 76,91 | 0,13 | 100,00 | 0,4977 | 0,0708 | |||
| HPQ / HP Inc. | 0,01 | 71,61 | 0,13 | 34,74 | 0,4766 | -0,1272 | |||
| K / Kellanova | 0,00 | 843,31 | 0,12 | 916,67 | 0,4549 | 0,3735 | |||
| IP / International Paper Company | 0,00 | 167,37 | 0,12 | 121,82 | 0,4541 | 0,1003 | |||
| ADM / Archer-Daniels-Midland Company | 0,00 | 76,03 | 0,12 | 64,86 | 0,4529 | -0,0192 | |||
| ES / Eversource Energy | 0,00 | 80,11 | 0,12 | 87,10 | 0,4317 | 0,0341 | |||
| HPE / Hewlett Packard Enterprise Company | 0,01 | 79,32 | 0,11 | 37,35 | 0,4258 | -0,1048 | |||
| HBAN / Huntington Bancshares Incorporated | 0,01 | 350,03 | 0,11 | 334,62 | 0,4196 | 0,1892 | |||
| SYF / Synchrony Financial | 0,00 | 73,67 | 0,11 | 31,71 | 0,4018 | -0,1237 | |||
| IFF / International Flavors & Fragrances Inc. | 0,00 | 76,71 | 0,11 | 59,70 | 0,3998 | -0,0298 | |||
| DGX / Quest Diagnostics Incorporated | 0,00 | 77,22 | 0,11 | 92,73 | 0,3962 | 0,0462 | |||
| TROW / T. Rowe Price Group, Inc. | 0,00 | 76,22 | 0,11 | 32,91 | 0,3920 | -0,1104 | |||
| HUBB / Hubbell Incorporated | 0,00 | 78,75 | 0,10 | 94,34 | 0,3855 | -0,0371 | |||
| MKC / McCormick & Company, Incorporated | 0,00 | 76,76 | 0,10 | 74,58 | 0,3852 | 0,0097 | |||
| STX / Seagate Technology Holdings plc | 0,00 | 78,25 | 0,10 | 68,85 | 0,3848 | -0,0061 | |||
| STLD / Steel Dynamics, Inc. | 0,00 | 74,44 | 0,10 | 75,44 | 0,3745 | 0,0116 | |||
| RF / Regions Financial Corporation | 0,00 | 75,16 | 0,10 | 45,59 | 0,3686 | -0,0659 | |||
| NTAP / NetApp, Inc. | 0,00 | 74,32 | 0,10 | 27,63 | 0,3617 | -0,1211 | |||
| CLX / The Clorox Company | 0,00 | 76,53 | 0,09 | 59,32 | 0,3496 | -0,0281 | |||
| HAL / Halliburton Company | 0,00 | 76,44 | 0,09 | 34,78 | 0,3480 | -0,0949 | |||
| PFG / Principal Financial Group, Inc. | 0,00 | 73,86 | 0,09 | 55,17 | 0,3368 | -0,0316 | |||
| CFG / Citizens Financial Group, Inc. | 0,00 | 74,36 | 0,09 | 35,94 | 0,3249 | -0,0861 | |||
| GPC / Genuine Parts Company | 0,00 | 0,09 | 0,3241 | 0,3241 | |||||
| BLL / Ball Corp. | 0,00 | 73,43 | 0,08 | 62,75 | 0,3082 | -0,0178 | |||
| EQH / Equitable Holdings, Inc. | 0,00 | 74,35 | 0,08 | 59,62 | 0,3081 | -0,0245 | |||
| OMC / Omnicom Group Inc. | 0,00 | 0,08 | 0,2982 | 0,2982 | |||||
| AVY / Avery Dennison Corporation | 0,00 | 77,46 | 0,07 | 64,44 | 0,2749 | -0,0127 | |||
| GGG / Graco Inc. | 0,00 | 0,07 | 0,2735 | 0,2735 | |||||
| BBY / Best Buy Co., Inc. | 0,00 | 75,44 | 0,07 | 35,85 | 0,2688 | -0,0686 | |||
| IEX / IDEX Corporation | 0,00 | 0,07 | 0,2608 | 0,2608 | |||||
| JKHY / Jack Henry & Associates, Inc. | 0,00 | 78,28 | 0,07 | 78,95 | 0,2536 | 0,0094 | |||
| OC / Owens Corning | 0,00 | 130,00 | 0,07 | 88,57 | 0,2482 | -0,0539 | |||
| DOC / Healthpeak Properties, Inc. | 0,00 | 130,15 | 0,07 | 83,33 | 0,2476 | -0,0642 | |||
| SJM / The J. M. Smucker Company | 0,00 | 81,33 | 0,07 | 60,98 | 0,2472 | -0,0799 | |||
| REG / Regency Centers Corporation | 0,00 | 127,09 | 0,07 | 127,59 | 0,2470 | -0,0009 | |||
| RPRX / Royalty Pharma plc | 0,00 | 74,76 | 0,07 | 83,33 | 0,2463 | 0,0143 | |||
| ALLE / Allegion plc | 0,00 | 75,09 | 0,06 | 82,86 | 0,2397 | 0,0164 | |||
| JNPR / Juniper Networks, Inc. | 0,00 | 77,60 | 0,06 | 88,24 | 0,2394 | 0,0181 | |||
| CAG / Conagra Brands, Inc. | 0,00 | 0,06 | 0,2344 | 0,2344 | |||||
| GIS / General Mills, Inc. | 0,00 | 0,06 | 0,2270 | 0,2270 | |||||
| POOL / Pool Corporation | 0,00 | 72,03 | 0,06 | 47,50 | 0,2208 | -0,0370 | |||
| NLY / Annaly Capital Management, Inc. | 0,00 | 84,46 | 0,06 | 78,79 | 0,2194 | 0,0076 | |||
| DKS / DICK'S Sporting Goods, Inc. | 0,00 | 133,58 | 0,06 | 123,08 | 0,2181 | -0,0061 | |||
| BG / Bunge Global SA | 0,00 | 73,49 | 0,06 | 81,25 | 0,2179 | 0,0101 | |||
| WTRG / Essential Utilities, Inc. | 0,00 | 76,96 | 0,06 | 103,57 | 0,2134 | 0,0355 | |||
| CHRW / C.H. Robinson Worldwide, Inc. | 0,00 | 78,37 | 0,06 | 60,00 | 0,2102 | -0,0146 | |||
| CNH / CNH Industrial N.V. | 0,00 | 75,68 | 0,05 | 58,82 | 0,2010 | -0,0169 | |||
| LKQ / LKQ Corporation | 0,00 | 74,38 | 0,05 | 82,76 | 0,1978 | 0,0079 | |||
| AIZ / Assurant, Inc. | 0,00 | 130,00 | 0,05 | 130,43 | 0,1974 | 0,0008 | |||
| BXP / Boston Properties, Inc. | 0,00 | 76,48 | 0,05 | 54,55 | 0,1899 | -0,0213 | |||
| IPG / The Interpublic Group of Companies, Inc. | 0,00 | 75,02 | 0,05 | 56,25 | 0,1862 | -0,0215 | |||
| CPB / The Campbell's Company | 0,00 | 0,04 | 0,1404 | 0,1404 | |||||
| FBHS / Fortune Brands Home & Security Inc | 0,00 | 76,13 | 0,04 | 29,63 | 0,1326 | -0,0389 |