Statistiques de base
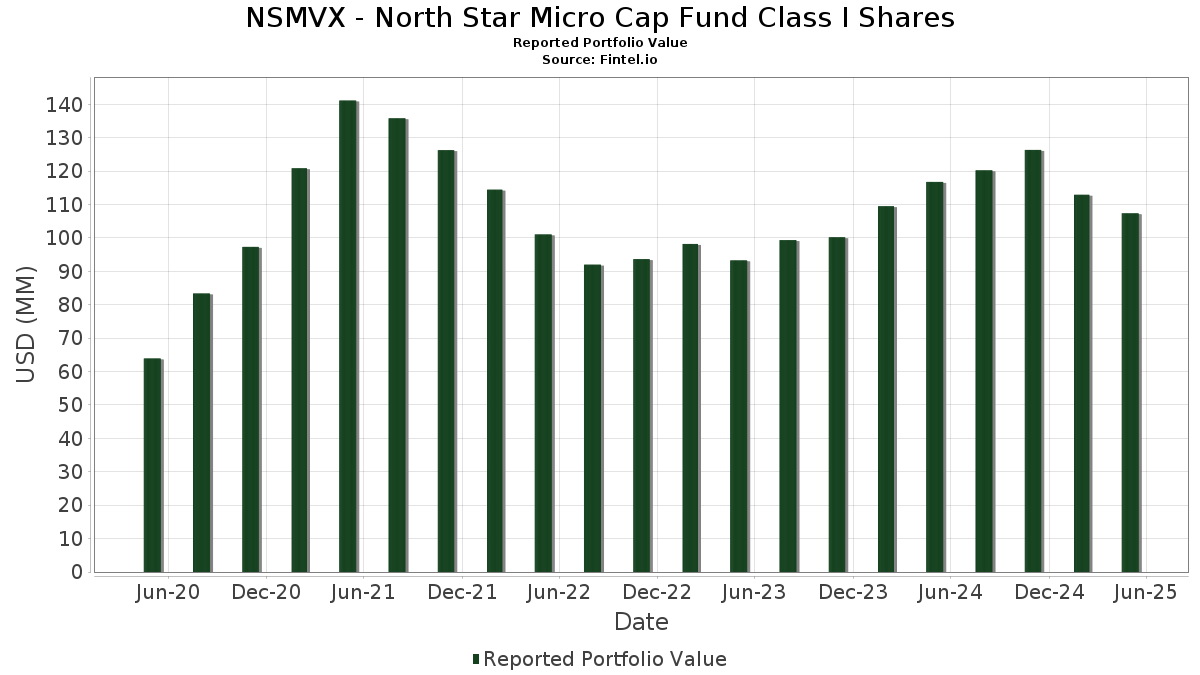
| Valeur du portefeuille | $ 107 363 229 |
| Positions actuelles | 53 |
Dernières positions, performances, ASG (à partir des dépôts 13F, 13D)
NSMVX - North Star Micro Cap Fund Class I Shares a déclaré un total de 53 positions dans ses derniers dépôts auprès de la SEC. La valeur la plus récente du portefeuille est calculée à 107 363 229 USD. Les actifs sous gestion réels (ASG) sont cette valeur plus les liquidités (qui ne sont pas divulguées). Les principales positions de NSMVX - North Star Micro Cap Fund Class I Shares sont First American Funds Inc - First American Treasury Obligations Fund Class X (US:FXFXX) , United States Lime & Minerals, Inc. (US:USLM) , Barrett Business Services, Inc. (US:BBSI) , Green Brick Partners, Inc. (US:GRBK) , and Q.E.P. Co., Inc. (US:QEPC) . Les nouvelles positions de NSMVX - North Star Micro Cap Fund Class I Shares incluent First American Funds Inc - First American Treasury Obligations Fund Class X (US:FXFXX) , Simulations Plus, Inc. (US:SLP) , FreightCar America, Inc. (US:RAIL) , CECO Environmental Corp. (US:CECO) , and Global Water Resources, Inc. (US:GWRS) .
Meilleures augmentations ce trimestre
Nous utilisons la variation de l'allocation du portefeuille car il s'agit de l'indicateur le plus significatif. Les changements peuvent être dus à des transactions ou à des variations de prix des actions.
| Titre | Actions (en millions) |
Valeur ($ en millions) |
% du portefeuille | ΔPortefeuille % |
|---|---|---|---|---|
| 9,27 | 8,6909 | 2,1670 | ||
| 0,04 | 1,35 | 1,2684 | 1,2684 | |
| 0,15 | 1,19 | 1,1120 | 1,1120 | |
| 0,04 | 1,18 | 1,1089 | 1,1089 | |
| 0,11 | 1,12 | 1,0464 | 1,0464 | |
| 0,19 | 2,04 | 1,9091 | 0,9644 | |
| 0,14 | 1,95 | 1,8236 | 0,8914 | |
| 0,02 | 3,37 | 3,1551 | 0,8726 | |
| 0,10 | 2,38 | 2,2306 | 0,8458 | |
| 0,05 | 4,73 | 4,4310 | 0,5983 |
Principales baisses ce trimestre
Nous utilisons la variation de l'allocation du portefeuille car il s'agit de l'indicateur le plus significatif. Les changements peuvent être dus à des transactions ou à des variations de prix des actions.
| Titre | Actions (en millions) |
Valeur ($ en millions) |
% du portefeuille | ΔPortefeuille % |
|---|---|---|---|---|
| 0,07 | 3,78 | 3,5398 | -1,5099 | |
| 0,11 | 2,50 | 2,3436 | -1,4016 | |
| 0,07 | 1,81 | 1,7006 | -1,1854 | |
| 0,11 | 2,12 | 1,9828 | -1,1390 | |
| 0,06 | 2,36 | 2,2125 | -0,7513 | |
| 0,09 | 3,79 | 3,5521 | -0,7111 | |
| 0,17 | 1,73 | 1,6172 | -0,6030 | |
| 0,12 | 2,68 | 2,5159 | -0,4778 | |
| 0,05 | 2,24 | 2,1030 | -0,4424 | |
| 0,16 | 0,85 | 0,7946 | -0,3818 |
Déclarations 13F et dépôts de fonds
Ce formulaire a été déposé le 2025-07-23 pour la période de déclaration 2025-05-31. Cliquez sur l'icône du lien pour voir l'historique complet des transactions.
Mettre à niveau pour débloquer les données premium et exporter vers Excel ![]() .
.
| Titre | Type | Prix moyen de l'action | Actions (en millions) |
ΔActions (%) |
ΔActions (%) |
Valeur ($ en millions) |
Portefeuille (%) |
ΔPortefeuille (%) |
|
|---|---|---|---|---|---|---|---|---|---|
| FXFXX / First American Funds Inc - First American Treasury Obligations Fund Class X | 9,27 | 26,20 | 8,6909 | 2,1670 | |||||
| USLM / United States Lime & Minerals, Inc. | 0,05 | 0,00 | 4,73 | 9,50 | 4,4310 | 0,5983 | |||
| BBSI / Barrett Business Services, Inc. | 0,11 | 0,00 | 4,63 | 2,66 | 4,3378 | 0,3356 | |||
| GRBK / Green Brick Partners, Inc. | 0,07 | -6,58 | 4,15 | -8,59 | 3,8894 | -0,1407 | |||
| QEPC / Q.E.P. Co., Inc. | 0,09 | -3,27 | 3,79 | -21,07 | 3,5521 | -0,7111 | |||
| BBW / Build-A-Bear Workshop, Inc. | 0,07 | -46,76 | 3,78 | -33,60 | 3,5398 | -1,5099 | |||
| BOOT / Boot Barn Holdings, Inc. | 0,02 | 0,00 | 3,37 | 30,92 | 3,1551 | 0,8726 | |||
| ACU / Acme United Corporation | 0,08 | -10,99 | 3,22 | -9,39 | 3,0214 | -0,1367 | |||
| ALG / Alamo Group Inc. | 0,02 | 0,00 | 3,19 | 13,17 | 2,9883 | 0,4872 | |||
| ESCA / Escalade, Incorporated | 0,21 | -10,08 | 3,18 | -12,39 | 2,9764 | -0,2417 | |||
| TILE / Interface, Inc. | 0,14 | 0,00 | 2,87 | -0,69 | 2,6925 | 0,1242 | |||
| EML / The Eastern Company | 0,12 | 0,00 | 2,68 | -20,40 | 2,5159 | -0,4778 | |||
| HBB / Hamilton Beach Brands Holding Company | 0,14 | 0,00 | 2,59 | -6,25 | 2,4315 | -0,0256 | |||
| LQDT / Liquidity Services, Inc. | 0,11 | -15,08 | 2,50 | -40,73 | 2,3436 | -1,4016 | |||
| RCKY / Rocky Brands, Inc. | 0,10 | -6,67 | 2,39 | 4,37 | 2,2388 | 0,2073 | |||
| LINC / Lincoln Educational Services Corporation | 0,10 | 17,65 | 2,38 | 52,66 | 2,2306 | 0,8458 | |||
| BLBD / Blue Bird Corporation | 0,06 | -35,79 | 2,36 | -29,30 | 2,2125 | -0,7513 | |||
| PSTL / Postal Realty Trust, Inc. | 0,16 | 0,00 | 2,26 | -0,66 | 2,1143 | 0,0985 | |||
| MLR / Miller Industries, Inc. | 0,05 | 0,00 | 2,24 | -21,76 | 2,1030 | -0,4424 | |||
| LAKE / Lakeland Industries, Inc. | 0,11 | -25,50 | 2,12 | -39,85 | 1,9828 | -1,1390 | |||
| ETD / Ethan Allen Interiors Inc. | 0,08 | 0,00 | 2,06 | -8,31 | 1,9347 | -0,0642 | |||
| LIND / Lindblad Expeditions Holdings, Inc. | 0,19 | 103,65 | 2,04 | 91,45 | 1,9091 | 0,9644 | |||
| TBCH / Turtle Beach Corporation | 0,18 | 39,68 | 2,02 | -6,44 | 1,8936 | -0,0237 | |||
| CTLP / Cantaloupe, Inc. | 0,24 | 12,38 | 1,98 | -4,22 | 1,8513 | 0,0205 | |||
| EPM / Evolution Petroleum Corporation | 0,43 | 0,00 | 1,95 | -10,90 | 1,8305 | -0,1159 | |||
| HCSG / Healthcare Services Group, Inc. | 0,14 | 38,00 | 1,95 | 85,24 | 1,8236 | 0,8914 | |||
| HCKT / The Hackett Group, Inc. | 0,07 | -30,84 | 1,81 | -44,18 | 1,7006 | -1,1854 | |||
| SGC / Superior Group of Companies, Inc. | 0,17 | 0,00 | 1,73 | -31,00 | 1,6172 | -0,6030 | |||
| BHB / Bar Harbor Bankshares | 0,05 | 0,00 | 1,47 | -9,49 | 1,3763 | -0,0637 | |||
| DCO / Ducommun Incorporated | 0,02 | 0,00 | 1,43 | 20,10 | 1,3390 | 0,2825 | |||
| WHG / Westwood Holdings Group, Inc. | 0,09 | 0,00 | 1,36 | -6,40 | 1,2753 | -0,0153 | |||
| SLP / Simulations Plus, Inc. | 0,04 | 1,35 | 1,2684 | 1,2684 | |||||
| PENG / Penguin Solutions, Inc. | 0,07 | 0,00 | 1,24 | -10,90 | 1,1651 | -0,0734 | |||
| RAIL / FreightCar America, Inc. | 0,15 | 1,19 | 1,1120 | 1,1120 | |||||
| ALNT / Allient Inc. | 0,04 | -18,75 | 1,19 | -0,75 | 1,1112 | 0,0509 | |||
| CECO / CECO Environmental Corp. | 0,04 | 1,18 | 1,1089 | 1,1089 | |||||
| MOV / Movado Group, Inc. | 0,07 | 20,00 | 1,17 | 0,69 | 1,0932 | 0,0646 | |||
| GWRS / Global Water Resources, Inc. | 0,11 | 1,12 | 1,0464 | 1,0464 | |||||
| NATR / Nature's Sunshine Products, Inc. | 0,07 | 0,00 | 1,11 | 6,10 | 1,0432 | 0,1119 | |||
| BUSE / First Busey Corporation | 0,05 | 0,00 | 1,11 | -7,76 | 1,0366 | -0,0284 | |||
| VIRC / Virco Mfg. Corporation | 0,12 | 9,09 | 1,01 | -10,71 | 0,9458 | -0,0581 | |||
| ARAY / Accuray Incorporated | 0,59 | 0,00 | 0,91 | -23,85 | 0,8532 | -0,2086 | |||
| JOUT / Johnson Outdoors Inc. | 0,03 | 0,00 | 0,87 | 1,04 | 0,8180 | 0,0514 | |||
| PUMP / ProPetro Holding Corp. | 0,16 | 0,00 | 0,85 | -36,08 | 0,7946 | -0,3818 | |||
| TNC / Tennant Company | 0,01 | 0,00 | 0,78 | -13,99 | 0,7324 | -0,0746 | |||
| NATH / Nathan's Famous, Inc. | 0,01 | 0,00 | 0,75 | 4,91 | 0,7018 | 0,0685 | |||
| ACCO / ACCO Brands Corporation | 0,21 | 0,00 | 0,75 | -23,17 | 0,6998 | -0,1625 | |||
| APOG / Apogee Enterprises, Inc. | 0,02 | 0,00 | 0,73 | -19,34 | 0,6882 | -0,1204 | |||
| CENT / Central Garden & Pet Company | 0,02 | 0,00 | 0,71 | 2,15 | 0,6692 | 0,0488 | |||
| SCVL / Shoe Carnival, Inc. | 0,03 | 0,00 | 0,63 | -13,15 | 0,5944 | -0,0542 | |||
| HDSN / Hudson Technologies, Inc. | 0,08 | -42,42 | 0,59 | -28,59 | 0,5556 | -0,1808 | |||
| CRWS / Crown Crafts, Inc. | 0,14 | -8,28 | 0,47 | -27,19 | 0,4373 | -0,1314 | |||
| CENTA / Central Garden & Pet Company | 0,00 | 0,00 | 0,16 | 1,94 | 0,1483 | 0,0100 | |||
| THST / Truett-Hurst, Inc. | 0,28 | 0,00 | 0,00 | 0,0000 | 0,0000 |