Statistiques de base
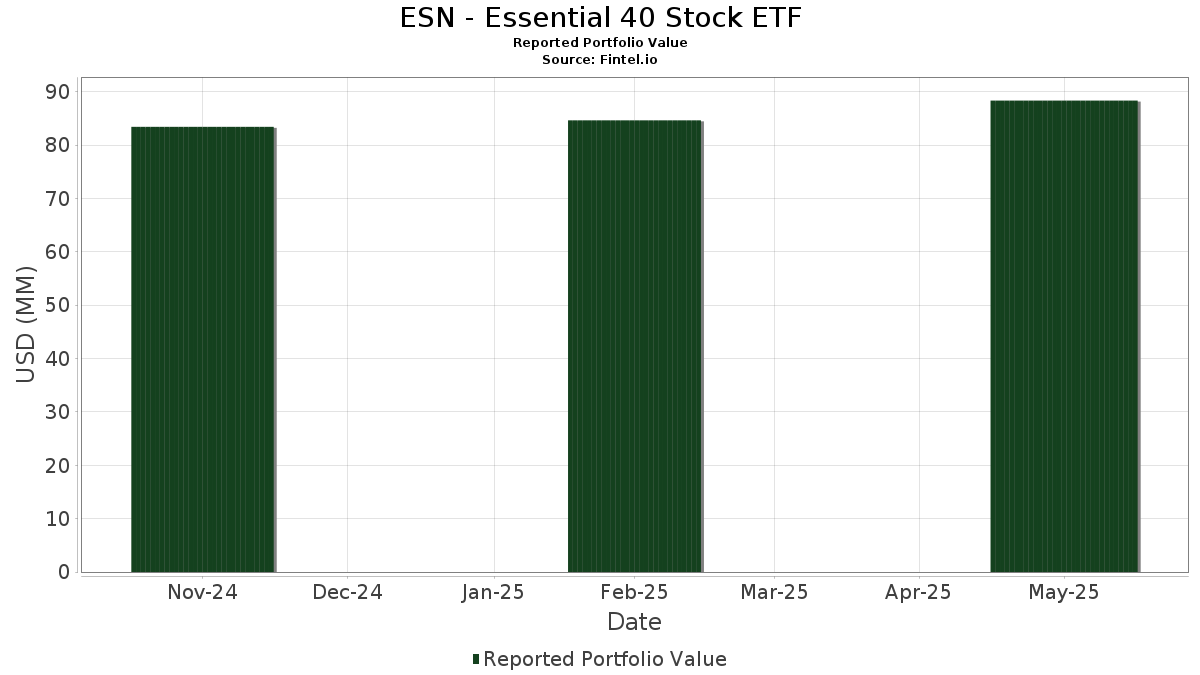
| Valeur du portefeuille | $ 88 327 489 |
| Positions actuelles | 41 |
Dernières positions, performances, ASG (à partir des dépôts 13F, 13D)
ESN - Essential 40 Stock ETF a déclaré un total de 41 positions dans ses derniers dépôts auprès de la SEC. La valeur la plus récente du portefeuille est calculée à 88 327 489 USD. Les actifs sous gestion réels (ASG) sont cette valeur plus les liquidités (qui ne sont pas divulguées). Les principales positions de ESN - Essential 40 Stock ETF sont CME Group Inc. (US:CME) , International Business Machines Corporation (US:IBM) , CVS Health Corporation (US:CVS) , Visa Inc. (US:V) , and The Boeing Company (US:BA) .
Meilleures augmentations ce trimestre
Nous utilisons la variation de l'allocation du portefeuille car il s'agit de l'indicateur le plus significatif. Les changements peuvent être dus à des transactions ou à des variations de prix des actions.
| Titre | Actions (en millions) |
Valeur ($ en millions) |
% du portefeuille | ΔPortefeuille % |
|---|---|---|---|---|
| 0,89 | 1,0096 | 1,0096 | ||
| 0,01 | 2,51 | 2,8380 | 0,4432 | |
| 0,01 | 2,66 | 3,0089 | 0,4165 | |
| 0,01 | 2,32 | 2,6256 | 0,3919 | |
| 0,04 | 2,42 | 2,7368 | 0,3313 | |
| 0,21 | 2,22 | 2,5119 | 0,2092 | |
| 0,01 | 2,29 | 2,5866 | 0,1930 | |
| 0,00 | 2,10 | 2,3720 | 0,1890 | |
| 0,02 | 2,47 | 2,7951 | 0,1594 | |
| 0,01 | 2,41 | 2,7279 | 0,1557 |
Principales baisses ce trimestre
Nous utilisons la variation de l'allocation du portefeuille car il s'agit de l'indicateur le plus significatif. Les changements peuvent être dus à des transactions ou à des variations de prix des actions.
| Titre | Actions (en millions) |
Valeur ($ en millions) |
% du portefeuille | ΔPortefeuille % |
|---|---|---|---|---|
| 0,00 | 1,17 | 1,3190 | -0,7305 | |
| 0,10 | 2,05 | 2,3178 | -0,5503 | |
| 0,00 | 1,97 | 2,2241 | -0,4858 | |
| 0,03 | 1,80 | 2,0382 | -0,3710 | |
| 0,01 | 1,84 | 2,0834 | -0,3580 | |
| 0,03 | 1,64 | 1,8500 | -0,3540 | |
| 0,01 | 1,68 | 1,8953 | -0,3500 | |
| 0,08 | 1,83 | 2,0701 | -0,2390 | |
| 0,02 | 1,98 | 2,2374 | -0,1544 | |
| 0,01 | 2,23 | 2,5184 | -0,1414 |
Déclarations 13F et dépôts de fonds
Ce formulaire a été déposé le 2025-07-28 pour la période de déclaration 2025-05-31. Cliquez sur l'icône du lien pour voir l'historique complet des transactions.
Mettre à niveau pour débloquer les données premium et exporter vers Excel ![]() .
.
| Titre | Type | Prix moyen de l'action | Actions (en millions) |
ΔActions (%) |
ΔActions (%) |
Valeur ($ en millions) |
Portefeuille (%) |
ΔPortefeuille (%) |
|
|---|---|---|---|---|---|---|---|---|---|
| CME / CME Group Inc. | 0,01 | 6,28 | 2,66 | 21,02 | 3,0089 | 0,4165 | |||
| IBM / International Business Machines Corporation | 0,01 | 7,38 | 2,56 | 10,20 | 2,8970 | 0,1557 | |||
| CVS / CVS Health Corporation | 0,04 | 3,65 | 2,53 | 1,00 | 2,8637 | -0,0928 | |||
| V / Visa Inc. | 0,01 | 6,26 | 2,53 | 6,98 | 2,8592 | 0,0724 | |||
| BA / The Boeing Company | 0,01 | 4,09 | 2,51 | 23,60 | 2,8380 | 0,4432 | |||
| AWK / American Water Works Company, Inc. | 0,02 | 5,17 | 2,47 | 10,61 | 2,7951 | 0,1594 | |||
| WM / Waste Management, Inc. | 0,01 | 6,36 | 2,47 | 10,14 | 2,7879 | 0,1475 | |||
| PANW / Palo Alto Networks, Inc. | 0,01 | 6,27 | 2,44 | 7,40 | 2,7589 | 0,0797 | |||
| COST / Costco Wholesale Corporation | 0,00 | 7,86 | 2,43 | 6,97 | 2,7433 | 0,0697 | |||
| NTR / Nutrien Ltd. | 0,04 | 5,24 | 2,42 | 18,64 | 2,7368 | 0,3313 | |||
| BRK.B / Berkshire Hathaway Inc. | 0,00 | 6,81 | 2,42 | 4,77 | 2,7352 | 0,0125 | |||
| VZ / Verizon Communications Inc. | 0,05 | 5,41 | 2,42 | 7,52 | 2,7320 | 0,0823 | |||
| CB / Chubb Limited | 0,01 | 6,23 | 2,41 | 10,59 | 2,7279 | 0,1557 | |||
| ADP / Automatic Data Processing, Inc. | 0,01 | 6,91 | 2,40 | 10,41 | 2,7107 | 0,1508 | |||
| MMM / 3M Company | 0,02 | 6,84 | 2,36 | 2,16 | 2,6733 | -0,0550 | |||
| META / Meta Platforms, Inc. | 0,00 | 9,21 | 2,35 | 5,81 | 2,6581 | 0,0387 | |||
| ORCL / Oracle Corporation | 0,01 | 8,32 | 2,35 | 8,01 | 2,6521 | 0,0907 | |||
| JPM / JPMorgan Chase & Co. | 0,01 | 7,85 | 2,34 | 7,58 | 2,6492 | 0,0815 | |||
| DUK / Duke Energy Corporation | 0,02 | 6,00 | 2,34 | 6,23 | 2,6408 | 0,0478 | |||
| MSFT / Microsoft Corporation | 0,01 | 5,70 | 2,32 | 22,54 | 2,6256 | 0,3919 | |||
| MPC / Marathon Petroleum Corporation | 0,01 | 5,28 | 2,29 | 12,72 | 2,5866 | 0,1930 | |||
| JNJ / Johnson & Johnson | 0,01 | 4,98 | 2,23 | -1,29 | 2,5184 | -0,1414 | |||
| F / Ford Motor Company | 0,21 | 4,66 | 2,22 | 13,78 | 2,5119 | 0,2092 | |||
| LMT / Lockheed Martin Corporation | 0,00 | 5,79 | 2,10 | 13,29 | 2,3720 | 0,1890 | |||
| SYY / Sysco Corporation | 0,03 | 5,56 | 2,07 | 2,02 | 2,3431 | -0,0520 | |||
| INTC / Intel Corporation | 0,10 | 2,29 | 2,05 | -15,71 | 2,3178 | -0,5503 | |||
| AMZN / Amazon.com, Inc. | 0,01 | 8,15 | 2,03 | 4,41 | 2,3011 | 0,0037 | |||
| EPD / Enterprise Products Partners L.P. - Limited Partnership | 0,07 | 6,94 | 2,02 | -1,37 | 2,2841 | -0,1305 | |||
| HD / The Home Depot, Inc. | 0,01 | 5,99 | 1,99 | -1,58 | 2,2546 | -0,1341 | |||
| XOM / Exxon Mobil Corporation | 0,02 | 6,16 | 1,98 | -2,47 | 2,2374 | -0,1544 | |||
| LLY / Eli Lilly and Company | 0,00 | 6,81 | 1,97 | -14,41 | 2,2241 | -0,4858 | |||
| CMCSA / Comcast Corporation | 0,06 | 4,76 | 1,97 | 0,92 | 2,2230 | -0,0736 | |||
| GOOGL / Alphabet Inc. | 0,01 | 7,76 | 1,95 | 8,72 | 2,2012 | 0,0892 | |||
| FCX / Freeport-McMoRan Inc. | 0,05 | 0,00 | 1,91 | 4,21 | 2,1578 | -0,0005 | |||
| AAPL / Apple Inc. | 0,01 | 7,15 | 1,84 | -11,01 | 2,0834 | -0,3580 | |||
| PFE / Pfizer Inc. | 0,08 | 5,19 | 1,83 | -6,54 | 2,0701 | -0,2390 | |||
| MAS / Masco Corporation | 0,03 | 6,26 | 1,80 | -11,75 | 2,0382 | -0,3710 | |||
| FDX / FedEx Corporation | 0,01 | 6,10 | 1,68 | -11,98 | 1,8953 | -0,3500 | |||
| DAL / Delta Air Lines, Inc. | 0,03 | 8,75 | 1,64 | -12,47 | 1,8500 | -0,3540 | |||
| UNH / UnitedHealth Group Incorporated | 0,00 | 5,58 | 1,17 | -32,87 | 1,3190 | -0,7305 | |||
| BBH SWEEP VEHICLE / STIV (N/A) | 0,89 | 1,0096 | 1,0096 |