Statistiques de base
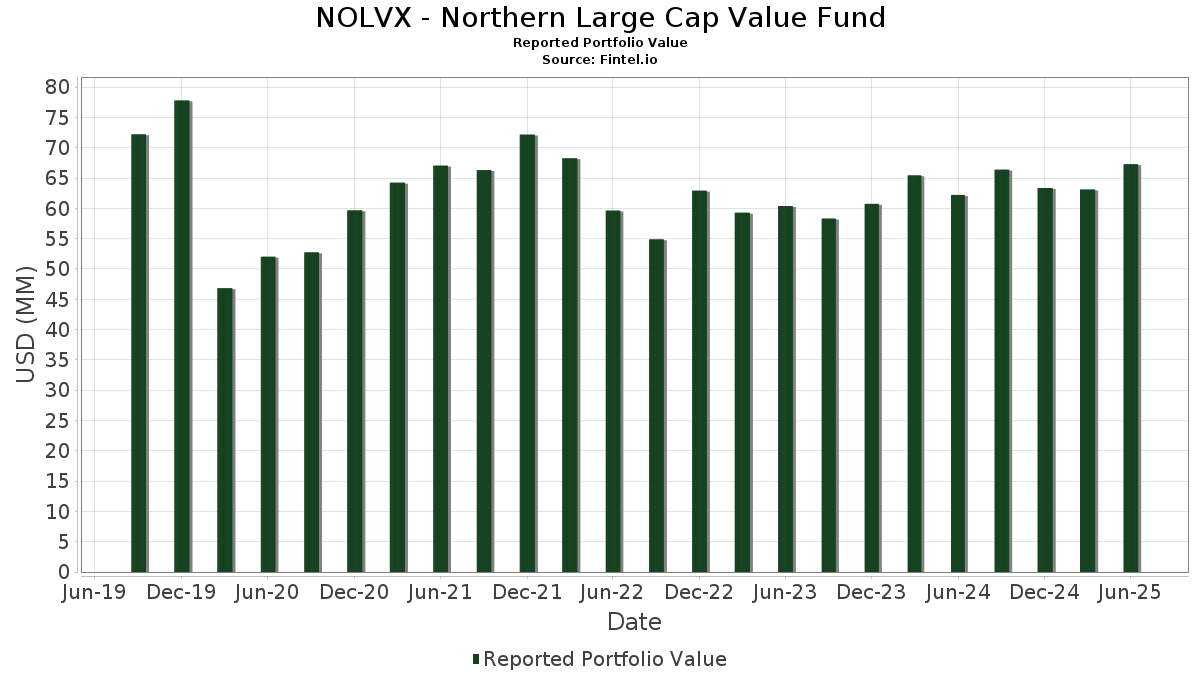
| Valeur du portefeuille | $ 67 274 255 |
| Positions actuelles | 184 |
Dernières positions, performances, ASG (à partir des dépôts 13F, 13D)
NOLVX - Northern Large Cap Value Fund a déclaré un total de 184 positions dans ses derniers dépôts auprès de la SEC. La valeur la plus récente du portefeuille est calculée à 67 274 255 USD. Les actifs sous gestion réels (ASG) sont cette valeur plus les liquidités (qui ne sont pas divulguées). Les principales positions de NOLVX - Northern Large Cap Value Fund sont JPMorgan Chase & Co. (US:JPM) , Berkshire Hathaway Inc. (US:BRK.B) , Cisco Systems, Inc. (US:CSCO) , Chevron Corporation (US:CVX) , and Citigroup Inc. (US:C) . Les nouvelles positions de NOLVX - Northern Large Cap Value Fund incluent United Parcel Service, Inc. (US:UPS) , AMETEK, Inc. (US:AME) , Amcor plc (US:AMCR) , ResMed Inc. (US:RMD) , and Hasbro, Inc. (US:HAS) .
Meilleures augmentations ce trimestre
Nous utilisons la variation de l'allocation du portefeuille car il s'agit de l'indicateur le plus significatif. Les changements peuvent être dus à des transactions ou à des variations de prix des actions.
| Titre | Actions (en millions) |
Valeur ($ en millions) |
% du portefeuille | ΔPortefeuille % |
|---|---|---|---|---|
| 1,03 | 1,6385 | 1,6385 | ||
| 1,03 | 1,6385 | 1,6385 | ||
| 1,03 | 1,6385 | 1,6385 | ||
| 1,03 | 1,6385 | 1,6385 | ||
| 0,04 | 0,92 | 1,4639 | 1,4134 | |
| 0,01 | 0,81 | 1,2875 | 1,2875 | |
| 0,01 | 0,64 | 1,0151 | 1,0151 | |
| 1,05 | 1,05 | 1,6608 | 0,8599 | |
| 0,01 | 1,00 | 1,5873 | 0,8244 | |
| 0,00 | 0,51 | 0,8100 | 0,8100 |
Principales baisses ce trimestre
Nous utilisons la variation de l'allocation du portefeuille car il s'agit de l'indicateur le plus significatif. Les changements peuvent être dus à des transactions ou à des variations de prix des actions.
| Titre | Actions (en millions) |
Valeur ($ en millions) |
% du portefeuille | ΔPortefeuille % |
|---|---|---|---|---|
| 0,00 | 0,11 | 0,1762 | -1,3635 | |
| 0,00 | 0,12 | 0,1940 | -1,0402 | |
| 0,01 | 0,44 | 0,6984 | -0,7316 | |
| 0,00 | 0,25 | 0,3996 | -0,6324 | |
| 0,00 | 1,86 | 2,9520 | -0,5210 | |
| 0,00 | 0,28 | 0,4393 | -0,4949 | |
| 0,01 | 0,85 | 1,3490 | -0,4561 | |
| 0,01 | 0,66 | 1,0543 | -0,4423 | |
| 0,01 | 1,11 | 1,7571 | -0,4370 | |
| 0,01 | 0,89 | 1,4112 | -0,4264 |
Déclarations 13F et dépôts de fonds
Ce formulaire a été déposé le 2025-08-26 pour la période de déclaration 2025-06-30. Cliquez sur l'icône du lien pour voir l'historique complet des transactions.
Mettre à niveau pour débloquer les données premium et exporter vers Excel ![]() .
.
| Titre | Type | Prix moyen de l'action | Actions (en millions) |
ΔActions (%) |
ΔActions (%) |
Valeur ($ en millions) |
Portefeuille (%) |
ΔPortefeuille (%) |
|
|---|---|---|---|---|---|---|---|---|---|
| JPM / JPMorgan Chase & Co. | 0,01 | -4,85 | 2,67 | 12,43 | 4,2393 | 0,4487 | |||
| BRK.B / Berkshire Hathaway Inc. | 0,00 | -6,29 | 1,86 | -14,53 | 2,9520 | -0,5210 | |||
| CSCO / Cisco Systems, Inc. | 0,02 | -8,30 | 1,34 | 3,15 | 2,1326 | 0,0526 | |||
| CVX / Chevron Corporation | 0,01 | -5,92 | 1,11 | -19,51 | 1,7571 | -0,4370 | |||
| C / Citigroup Inc. | 0,01 | -3,44 | 1,11 | 15,83 | 1,7552 | 0,2308 | |||
| US6652784041 / NORTHERN INSTITUTIONAL GOVERNMENT PORTFOLIO | 1,05 | 108,52 | 1,05 | 108,58 | 1,6608 | 0,8599 | |||
| FUT. CME MICRO S&P SEP25 / DE (000000000) | 1,03 | 1,6385 | 1,6385 | ||||||
| FUT. CME MICRO S&P SEP25 / DE (000000000) | 1,03 | 1,6385 | 1,6385 | ||||||
| FUT. CME MICRO S&P SEP25 / DE (000000000) | 1,03 | 1,6385 | 1,6385 | ||||||
| FUT. CME MICRO S&P SEP25 / DE (000000000) | 1,03 | 1,6385 | 1,6385 | ||||||
| MS / Morgan Stanley | 0,01 | -3,44 | 1,01 | 16,57 | 1,6095 | 0,2213 | |||
| JNJ / Johnson & Johnson | 0,01 | 127,14 | 1,00 | 109,43 | 1,5873 | 0,8244 | |||
| ACN / Accenture plc | 0,00 | -3,46 | 0,97 | -7,55 | 1,5368 | -0,1343 | |||
| EMR / Emerson Electric Co. | 0,01 | -12,46 | 0,93 | 19,08 | 1,4776 | 0,3246 | |||
| PFE / Pfizer Inc. | 0,04 | 2 945,08 | 0,92 | 2 870,97 | 1,4639 | 1,4134 | |||
| GILD / Gilead Sciences, Inc. | 0,01 | -21,96 | 0,89 | -22,78 | 1,4112 | -0,4264 | |||
| TMO / Thermo Fisher Scientific Inc. | 0,00 | -3,43 | 0,87 | -21,34 | 1,3759 | -0,3824 | |||
| XOM / Exxon Mobil Corporation | 0,01 | -17,09 | 0,85 | -24,87 | 1,3490 | -0,4561 | |||
| NEM / Newmont Corporation | 0,01 | 0,81 | 1,2875 | 1,2875 | |||||
| BAC / Bank of America Corporation | 0,02 | -3,45 | 0,80 | 9,45 | 1,2694 | 0,1036 | |||
| BK / The Bank of New York Mellon Corporation | 0,01 | -6,02 | 0,78 | 2,09 | 1,2413 | 0,0186 | |||
| EOG / EOG Resources, Inc. | 0,01 | -3,80 | 0,76 | -8,62 | 1,2131 | -0,1395 | |||
| CSX / CSX Corporation | 0,02 | -3,44 | 0,72 | 7,10 | 1,1508 | 0,0699 | |||
| CI / The Cigna Group | 0,00 | 37,68 | 0,71 | 38,25 | 1,1317 | 0,3091 | |||
| IBM / International Business Machines Corporation | 0,00 | -3,44 | 0,69 | 14,52 | 1,1023 | 0,1340 | |||
| MDT / Medtronic plc | 0,01 | -26,98 | 0,66 | -29,24 | 1,0543 | -0,4423 | |||
| UPS / United Parcel Service, Inc. | 0,01 | 0,64 | 1,0151 | 1,0151 | |||||
| WFC / Wells Fargo & Company | 0,01 | -3,45 | 0,60 | 7,68 | 0,9585 | 0,0640 | |||
| AFL / Aflac Incorporated | 0,01 | -40,95 | 0,60 | -10,86 | 0,9522 | -0,1758 | |||
| MET / MetLife, Inc. | 0,01 | -4,90 | 0,56 | -4,80 | 0,8828 | -0,0491 | |||
| MDLZ / Mondelez International, Inc. | 0,01 | -3,44 | 0,54 | -4,10 | 0,8555 | -0,0409 | |||
| FIS / Fidelity National Information Services, Inc. | 0,01 | -7,36 | 0,52 | 0,97 | 0,8315 | 0,0036 | |||
| EA / Electronic Arts Inc. | 0,00 | 396,46 | 0,52 | 505,88 | 0,8183 | 0,6963 | |||
| AME / AMETEK, Inc. | 0,00 | 0,51 | 0,8100 | 0,8100 | |||||
| VLO / Valero Energy Corporation | 0,00 | -4,43 | 0,51 | -2,88 | 0,8049 | -0,0272 | |||
| JBL / Jabil Inc. | 0,00 | -3,47 | 0,50 | 54,46 | 0,7986 | 0,2796 | |||
| GS / The Goldman Sachs Group, Inc. | 0,00 | -3,44 | 0,50 | 25,25 | 0,7878 | 0,1545 | |||
| VZ / Verizon Communications Inc. | 0,01 | 0,49 | 0,7800 | 0,7800 | |||||
| AIG / American International Group, Inc. | 0,01 | 152,01 | 0,48 | 148,45 | 0,7658 | 0,4554 | |||
| GD / General Dynamics Corporation | 0,00 | -3,48 | 0,48 | 3,25 | 0,7577 | 0,0200 | |||
| PRU / Prudential Financial, Inc. | 0,00 | -3,45 | 0,46 | -7,07 | 0,7314 | -0,0604 | |||
| EME / EMCOR Group, Inc. | 0,00 | -37,42 | 0,45 | -4,43 | 0,7202 | -0,0082 | |||
| TGT / Target Corporation | 0,00 | 97,82 | 0,45 | 25,21 | 0,7099 | 0,1680 | |||
| ADI / Analog Devices, Inc. | 0,00 | -3,48 | 0,44 | 13,92 | 0,7022 | 0,0824 | |||
| CMCSA / Comcast Corporation | 0,01 | -49,23 | 0,44 | -50,95 | 0,6984 | -0,7316 | |||
| WAB / Westinghouse Air Brake Technologies Corporation | 0,00 | -4,44 | 0,43 | 10,49 | 0,6865 | 0,0607 | |||
| NKE / NIKE, Inc. | 0,01 | 785,74 | 0,43 | 893,02 | 0,6794 | 0,6105 | |||
| EBAY / eBay Inc. | 0,01 | -11,22 | 0,42 | -2,53 | 0,6748 | -0,0204 | |||
| AMCR / Amcor plc | 0,05 | 0,42 | 0,6616 | 0,6616 | |||||
| D / Dominion Energy, Inc. | 0,01 | -3,44 | 0,41 | -2,82 | 0,6569 | -0,0218 | |||
| EL / The Estée Lauder Companies Inc. | 0,01 | -3,44 | 0,41 | 18,05 | 0,6551 | 0,0978 | |||
| HUBB / Hubbell Incorporated | 0,00 | -37,89 | 0,41 | 13,73 | 0,6453 | -0,0100 | |||
| RL / Ralph Lauren Corporation | 0,00 | -9,27 | 0,41 | 12,81 | 0,6437 | 0,0696 | |||
| RMD / ResMed Inc. | 0,00 | 0,40 | 0,6321 | 0,6321 | |||||
| INTU / Intuit Inc. | 0,00 | 6,26 | 0,39 | 34,84 | 0,6153 | 0,1790 | |||
| HAS / Hasbro, Inc. | 0,01 | 0,38 | 0,6082 | 0,6082 | |||||
| CF / CF Industries Holdings, Inc. | 0,00 | 1,12 | 0,38 | 19,12 | 0,6041 | 0,0938 | |||
| LDOS / Leidos Holdings, Inc. | 0,00 | 0,52 | 0,37 | 17,57 | 0,5847 | 0,0844 | |||
| SLM / SLM Corporation | 0,01 | -18,08 | 0,37 | -8,48 | 0,5831 | -0,0580 | |||
| AVB / AvalonBay Communities, Inc. | 0,00 | -17,65 | 0,37 | -11,41 | 0,5804 | -0,1124 | |||
| FFIV / F5, Inc. | 0,00 | -16,00 | 0,36 | -7,16 | 0,5767 | -0,0478 | |||
| AMAT / Applied Materials, Inc. | 0,00 | -3,45 | 0,36 | 21,77 | 0,5695 | 0,0993 | |||
| STE / STERIS plc | 0,00 | -12,81 | 0,36 | -7,75 | 0,5684 | -0,0501 | |||
| EQR / Equity Residential | 0,01 | 77,19 | 0,35 | 67,30 | 0,5611 | 0,2234 | |||
| QGEN / Qiagen N.V. | 0,01 | 0,35 | 0,5585 | 0,5585 | |||||
| MTG / MGIC Investment Corporation | 0,01 | -7,30 | 0,35 | 4,20 | 0,5516 | 0,0190 | |||
| GEN / Gen Digital Inc. | 0,01 | -3,44 | 0,35 | 7,12 | 0,5500 | 0,0329 | |||
| JLL / Jones Lang LaSalle Incorporated | 0,00 | 2,55 | 0,34 | 5,94 | 0,5386 | 0,0267 | |||
| ED / Consolidated Edison, Inc. | 0,00 | -18,57 | 0,34 | -26,15 | 0,5344 | -0,1929 | |||
| UGI / UGI Corporation | 0,01 | -30,35 | 0,34 | -23,34 | 0,5327 | -0,1656 | |||
| PPL / PPL Corporation | 0,01 | -12,96 | 0,33 | -18,36 | 0,5234 | -0,1209 | |||
| GOOGL / Alphabet Inc. | 0,00 | 2 320,78 | 0,33 | 53,27 | 0,5216 | 0,2057 | |||
| ALSN / Allison Transmission Holdings, Inc. | 0,00 | -18,92 | 0,33 | -19,90 | 0,5192 | -0,0997 | |||
| J / Jacobs Solutions Inc. | 0,00 | -3,46 | 0,33 | 4,82 | 0,5185 | 0,0218 | |||
| NVR / NVR, Inc. | 0,00 | 2,33 | 0,32 | 4,18 | 0,5160 | 0,0186 | |||
| QCOM / QUALCOMM Incorporated | 0,00 | -3,47 | 0,32 | 0,00 | 0,5136 | -0,0024 | |||
| EVRG / Evergy, Inc. | 0,00 | -15,39 | 0,32 | -15,49 | 0,5119 | -0,0967 | |||
| NXST / Nexstar Media Group, Inc. | 0,00 | 101,09 | 0,32 | 95,09 | 0,5053 | 0,2435 | |||
| IQV / IQVIA Holdings Inc. | 0,00 | -3,45 | 0,31 | -13,77 | 0,4975 | -0,0821 | |||
| REG / Regency Centers Corporation | 0,00 | -7,83 | 0,31 | -11,11 | 0,4966 | -0,0644 | |||
| ORI / Old Republic International Corporation | 0,01 | -10,19 | 0,31 | -12,11 | 0,4966 | -0,0707 | |||
| INGR / Ingredion Incorporated | 0,00 | -6,45 | 0,31 | -6,34 | 0,4938 | -0,0354 | |||
| VMI / Valmont Industries, Inc. | 0,00 | -3,46 | 0,31 | 10,71 | 0,4926 | 0,0443 | |||
| NYT / The New York Times Company | 0,01 | -3,45 | 0,31 | 9,25 | 0,4878 | 0,0377 | |||
| SNA / Snap-on Incorporated | 0,00 | -3,44 | 0,31 | -10,82 | 0,4852 | -0,0620 | |||
| AGO / Assured Guaranty Ltd. | 0,00 | -3,42 | 0,30 | -4,70 | 0,4837 | -0,0257 | |||
| DCI / Donaldson Company, Inc. | 0,00 | -3,44 | 0,30 | -0,33 | 0,4761 | -0,0033 | |||
| PG / The Procter & Gamble Company | 0,00 | 8,11 | 0,30 | 1,01 | 0,4756 | 0,0024 | |||
| COF / Capital One Financial Corporation | 0,00 | 117,26 | 0,30 | 158,26 | 0,4720 | 0,2879 | |||
| MDU / MDU Resources Group, Inc. | 0,02 | 192,03 | 0,30 | 187,38 | 0,4713 | 0,3067 | |||
| HST / Host Hotels & Resorts, Inc. | 0,02 | -3,44 | 0,30 | 4,59 | 0,4705 | 0,0172 | |||
| FR / First Industrial Realty Trust, Inc. | 0,01 | -3,44 | 0,30 | -13,99 | 0,4697 | -0,0787 | |||
| UTHR / United Therapeutics Corporation | 0,00 | 3,12 | 0,29 | -3,92 | 0,4672 | -0,0215 | |||
| SAIC / Science Applications International Corporation | 0,00 | -7,46 | 0,29 | -7,07 | 0,4592 | -0,0383 | |||
| BIIB / Biogen Inc. | 0,00 | -3,42 | 0,29 | -11,42 | 0,4567 | -0,0614 | |||
| PSX / Phillips 66 | 0,00 | -3,46 | 0,29 | -6,54 | 0,4545 | -0,0355 | |||
| KR / The Kroger Co. | 0,00 | -9,62 | 0,28 | -4,39 | 0,4507 | -0,0225 | |||
| KRC / Kilroy Realty Corporation | 0,01 | -3,44 | 0,28 | 1,07 | 0,4501 | 0,0026 | |||
| JHG / Janus Henderson Group plc | 0,01 | -3,45 | 0,28 | 3,70 | 0,4454 | 0,0137 | |||
| ABT / Abbott Laboratories | 0,00 | -62,33 | 0,28 | -55,12 | 0,4393 | -0,4949 | |||
| STWD / Starwood Property Trust, Inc. | 0,01 | -3,44 | 0,27 | -1,81 | 0,4311 | -0,0111 | |||
| CW / Curtiss-Wright Corporation | 0,00 | -44,97 | 0,27 | -15,24 | 0,4243 | -0,0792 | |||
| MRK / Merck & Co., Inc. | 0,00 | 73,62 | 0,27 | 3,91 | 0,4236 | 0,0304 | |||
| OVV / Ovintiv Inc. | 0,01 | -3,45 | 0,26 | -13,95 | 0,4115 | -0,0705 | |||
| SCHW / The Charles Schwab Corporation | 0,00 | 10,69 | 0,26 | 29,29 | 0,4067 | 0,0897 | |||
| EXC / Exelon Corporation | 0,01 | -44,38 | 0,26 | -47,64 | 0,4055 | -0,3725 | |||
| TECH / Bio-Techne Corporation | 0,00 | -3,44 | 0,26 | -15,28 | 0,4055 | -0,0757 | |||
| RYN / Rayonier Inc. | 0,01 | 0,29 | 0,25 | -20,44 | 0,4031 | -0,1049 | |||
| REYN / Reynolds Consumer Products Inc. | 0,01 | 0,67 | 0,25 | -9,68 | 0,4008 | -0,0452 | |||
| GNRC / Generac Holdings Inc. | 0,00 | -3,40 | 0,25 | 9,57 | 0,4002 | 0,0318 | |||
| DHR / Danaher Corporation | 0,00 | -47,91 | 0,25 | -63,09 | 0,3996 | -0,6324 | |||
| SYF / Synchrony Financial | 0,00 | -3,44 | 0,25 | 21,36 | 0,3985 | 0,0693 | |||
| JAZZ / Jazz Pharmaceuticals plc | 0,00 | 17,69 | 0,25 | 11,76 | 0,3935 | 0,0580 | |||
| PPC / Pilgrim's Pride Corporation | 0,01 | -12,06 | 0,25 | -27,65 | 0,3920 | -0,1512 | |||
| UNH / UnitedHealth Group Incorporated | 0,00 | 0,39 | 0,24 | -40,20 | 0,3834 | -0,2614 | |||
| FOXA / Fox Corporation | 0,00 | -3,45 | 0,24 | -4,45 | 0,3762 | -0,0195 | |||
| WWD / Woodward, Inc. | 0,00 | -3,43 | 0,23 | 30,00 | 0,3724 | 0,0837 | |||
| GEHC / GE HealthCare Technologies Inc. | 0,00 | -38,29 | 0,23 | -43,41 | 0,3693 | -0,2864 | |||
| CTSH / Cognizant Technology Solutions Corporation | 0,00 | -3,43 | 0,23 | -1,71 | 0,3665 | -0,0076 | |||
| LULU / lululemon athletica inc. | 0,00 | 0,23 | 0,3652 | 0,3652 | |||||
| FHB / First Hawaiian, Inc. | 0,01 | -3,44 | 0,23 | -1,72 | 0,3649 | -0,0072 | |||
| BFB / Brown-Forman Corp. - Class B | 0,01 | 0,22 | 0,3521 | 0,3521 | |||||
| SAM / The Boston Beer Company, Inc. | 0,00 | 10,76 | 0,22 | -11,29 | 0,3493 | -0,0477 | |||
| BBY / Best Buy Co., Inc. | 0,00 | -3,43 | 0,21 | -11,98 | 0,3391 | -0,0481 | |||
| DECK / Deckers Outdoor Corporation | 0,00 | 2 411,25 | 0,21 | 728,00 | 0,3288 | 0,2829 | |||
| L / Loews Corporation | 0,00 | -3,44 | 0,21 | -3,76 | 0,3269 | -0,0145 | |||
| PM / Philip Morris International Inc. | 0,00 | 0,20 | 0,3135 | 0,3135 | |||||
| SSNC / SS&C Technologies Holdings, Inc. | 0,00 | -13,29 | 0,19 | -13,84 | 0,3070 | -0,0522 | |||
| VICI / VICI Properties Inc. | 0,01 | -3,43 | 0,19 | -3,52 | 0,3057 | -0,0128 | |||
| MTN / Vail Resorts, Inc. | 0,00 | 0,19 | 0,2957 | 0,2957 | |||||
| GIS / General Mills, Inc. | 0,00 | -48,78 | 0,18 | -55,58 | 0,2907 | -0,3679 | |||
| DOV / Dover Corporation | 0,00 | -11,93 | 0,18 | -8,08 | 0,2901 | -0,0275 | |||
| PLD / Prologis, Inc. | 0,00 | 0,18 | 0,2803 | 0,2803 | |||||
| NNN / NNN REIT, Inc. | 0,00 | -3,44 | 0,17 | -2,26 | 0,2750 | -0,0079 | |||
| WY / Weyerhaeuser Company | 0,01 | -3,45 | 0,17 | -15,35 | 0,2728 | -0,0510 | |||
| BHF / Brighthouse Financial, Inc. | 0,00 | -3,42 | 0,17 | -10,47 | 0,2724 | -0,0335 | |||
| G / Genpact Limited | 0,00 | -3,43 | 0,17 | -15,92 | 0,2693 | -0,0517 | |||
| DOX / Amdocs Limited | 0,00 | -3,48 | 0,17 | -3,43 | 0,2689 | -0,0121 | |||
| RHI / Robert Half Inc. | 0,00 | -3,43 | 0,16 | -27,35 | 0,2585 | -0,0992 | |||
| GRMN / Garmin Ltd. | 0,00 | -3,40 | 0,16 | -6,98 | 0,2545 | -0,0211 | |||
| WMT / Walmart Inc. | 0,00 | -64,10 | 0,16 | -41,91 | 0,2521 | -0,1657 | |||
| OGE / OGE Energy Corp. | 0,00 | -54,81 | 0,16 | -56,51 | 0,2508 | -0,3272 | |||
| ACI / Albertsons Companies, Inc. | 0,01 | -10,53 | 0,16 | -12,36 | 0,2480 | -0,0370 | |||
| OMC / Omnicom Group Inc. | 0,00 | -3,44 | 0,15 | -16,18 | 0,2311 | -0,0462 | |||
| ASH / Ashland Inc. | 0,00 | -15,10 | 0,14 | -28,14 | 0,2275 | -0,0903 | |||
| HHH / Howard Hughes Holdings Inc. | 0,00 | 0,14 | 0,2220 | 0,2220 | |||||
| IVZ / Invesco Ltd. | 0,01 | -3,44 | 0,14 | 0,74 | 0,2160 | -0,0004 | |||
| BLD / TopBuild Corp. | 0,00 | 0,13 | 0,2133 | 0,2133 | |||||
| HSIC / Henry Schein, Inc. | 0,00 | 0,13 | 0,2095 | 0,2095 | |||||
| HRL / Hormel Foods Corporation | 0,00 | -3,45 | 0,12 | -5,43 | 0,1947 | -0,0127 | |||
| DIS / The Walt Disney Company | 0,00 | -87,42 | 0,12 | -84,20 | 0,1940 | -1,0402 | |||
| TAP / Molson Coors Beverage Company | 0,00 | -3,45 | 0,12 | -23,53 | 0,1859 | -0,0592 | |||
| PYPL / PayPal Holdings, Inc. | 0,00 | 0,11 | 0,1788 | 0,1788 | |||||
| RTX / RTX Corporation | 0,00 | -89,56 | 0,11 | -88,59 | 0,1762 | -1,3635 | |||
| RS / Reliance, Inc. | 0,00 | -3,65 | 0,11 | 4,90 | 0,1710 | 0,0068 | |||
| PHM / PulteGroup, Inc. | 0,00 | -24,79 | 0,11 | -22,63 | 0,1686 | -0,0512 | |||
| USB / U.S. Bancorp | 0,00 | -77,86 | 0,11 | -69,65 | 0,1668 | -0,4146 | |||
| IFF / International Flavors & Fragrances Inc. | 0,00 | -3,37 | 0,10 | -8,57 | 0,1538 | -0,0151 | |||
| MSM / MSC Industrial Direct Co., Inc. | 0,00 | -3,43 | 0,10 | 5,56 | 0,1520 | 0,0074 | |||
| IPG / The Interpublic Group of Companies, Inc. | 0,00 | -3,45 | 0,09 | -12,62 | 0,1436 | -0,0223 | |||
| TFC / Truist Financial Corporation | 0,00 | -3,44 | 0,09 | 1,15 | 0,1399 | 0,0004 | |||
| GGG / Graco Inc. | 0,00 | -78,17 | 0,07 | -77,74 | 0,1174 | -0,4078 | |||
| CRUS / Cirrus Logic, Inc. | 0,00 | -3,49 | 0,07 | 1,41 | 0,1146 | 0,0005 | |||
| UNITED STATES TSY. 0.00% / DBT (US912797NL78) | 0,07 | 0,1139 | 0,1139 | ||||||
| UNITED STATES TSY. 0.00% / DBT (US912797NL78) | 0,07 | 0,1139 | 0,1139 | ||||||
| UNITED STATES TSY. 0.00% / DBT (US912797NL78) | 0,07 | 0,1139 | 0,1139 | ||||||
| UNITED STATES TSY. 0.00% / DBT (US912797NL78) | 0,07 | 0,1139 | 0,1139 | ||||||
| VNT / Vontier Corporation | 0,00 | -3,43 | 0,06 | 8,47 | 0,1022 | 0,0075 | |||
| PTC / PTC Inc. | 0,00 | 0,06 | 0,1010 | 0,1010 | |||||
| EFX / Equifax Inc. | 0,00 | -3,28 | 0,06 | 3,39 | 0,0972 | 0,0023 | |||
| LYB / LyondellBasell Industries N.V. | 0,00 | -3,49 | 0,06 | -21,05 | 0,0967 | -0,0259 | |||
| COLM / Columbia Sportswear Company | 0,00 | -1,26 | 0,04 | -20,37 | 0,0684 | -0,0179 | |||
| TXN / Texas Instruments Incorporated | 0,00 | 0,04 | 0,0593 | 0,0593 | |||||
| BKR / Baker Hughes Company | 0,00 | 0,04 | 0,0558 | 0,0558 | |||||
| SWKS / Skyworks Solutions, Inc. | 0,00 | 0,00 | 0,03 | 13,79 | 0,0537 | 0,0069 | |||
| BLK / BlackRock, Inc. | 0,00 | 0,03 | 0,0433 | 0,0433 | |||||
| ROST / Ross Stores, Inc. | 0,00 | 0,02 | 0,0377 | 0,0377 | |||||
| PINC / Premier, Inc. | 0,00 | 0,00 | 0,02 | 16,67 | 0,0336 | 0,0039 | |||
| TDY / Teledyne Technologies Incorporated | 0,00 | 0,02 | 0,0268 | 0,0268 | |||||
| TTC / The Toro Company | 0,00 | 0,01 | 0,0180 | 0,0180 | |||||
| ALLY / Ally Financial Inc. | 0,00 | 0,00 | 0,01 | 0,00 | 0,0138 | 0,0008 | |||
| GPN / Global Payments Inc. | 0,00 | 0,00 | 0,01 | -25,00 | 0,0107 | -0,0025 | |||
| AMTM / Amentum Holdings, Inc. | 0,00 | -82,47 | 0,00 | -89,29 | 0,0057 | -0,0370 | |||
| MAT / Mattel, Inc. | 0,00 | 0,00 | 0,00 | 0,00 | 0,0055 | 0,0001 | |||
| MCHP / Microchip Technology Incorporated | 0,00 | -100,00 | 0,00 | -100,00 | -0,2525 |