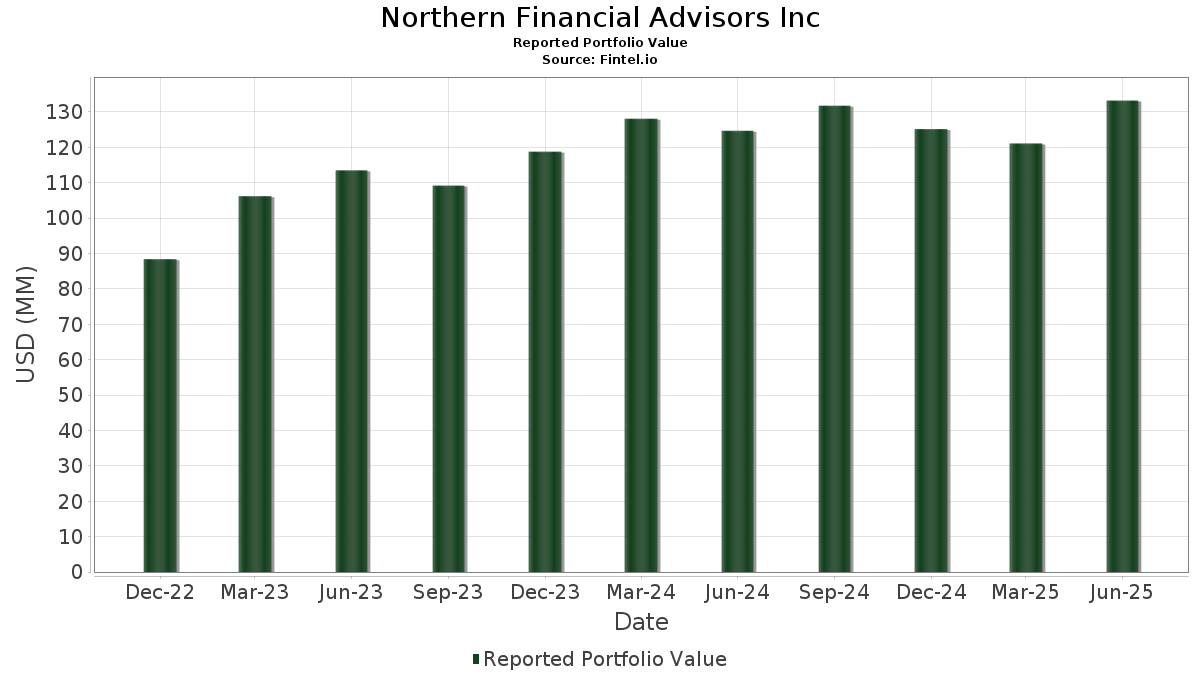
Statistiques de base
| Valeur du portefeuille | $ 133 229 407 |
| Positions actuelles | 107 |
Dernières positions, performances, ASG (à partir des dépôts 13F, 13D)
Northern Financial Advisors Inc a déclaré un total de 107 positions dans ses derniers dépôts auprès de la SEC. La valeur la plus récente du portefeuille est calculée à 133 229 407 USD. Les actifs sous gestion réels (ASG) sont cette valeur plus les liquidités (qui ne sont pas divulguées). Les principales positions de Northern Financial Advisors Inc sont SPDR S&P 500 ETF (US:SPY) , Netflix, Inc. (US:NFLX) , SPDR Dow Jones Industrial Average ETF Trust (US:DIA) , Broadcom Inc. (US:AVGO) , and Walmart Inc. (US:WMT) . Les nouvelles positions de Northern Financial Advisors Inc incluent CONV. NOTE (US:US780153BQ43) , .
Meilleures augmentations ce trimestre
Nous utilisons la variation de l'allocation du portefeuille car il s'agit de l'indicateur le plus significatif. Les changements peuvent être dus à des transactions ou à des variations de prix des actions.
| Titre | Actions (en millions) |
Valeur ($ en millions) |
% du portefeuille | ΔPortefeuille % |
|---|---|---|---|---|
| 0,02 | 4,38 | 3,2856 | 1,0943 | |
| 0,00 | 5,74 | 4,3120 | 1,0372 | |
| 0,02 | 3,54 | 2,6581 | 1,0354 | |
| 0,02 | 1,22 | 0,9180 | 0,9180 | |
| 0,01 | 2,73 | 2,0487 | 0,6296 | |
| 0,01 | 4,04 | 3,0338 | 0,4706 | |
| 0,00 | 0,56 | 0,4223 | 0,4223 | |
| 0,00 | 2,65 | 1,9926 | 0,2975 | |
| 0,00 | 0,37 | 0,2780 | 0,2780 | |
| 0,00 | 2,23 | 1,6760 | 0,2620 |
Principales baisses ce trimestre
Nous utilisons la variation de l'allocation du portefeuille car il s'agit de l'indicateur le plus significatif. Les changements peuvent être dus à des transactions ou à des variations de prix des actions.
| Titre | Actions (en millions) |
Valeur ($ en millions) |
% du portefeuille | ΔPortefeuille % |
|---|---|---|---|---|
| 0,00 | 0,56 | 0,4208 | -0,8468 | |
| 0,01 | 0,14 | 0,1018 | -0,7902 | |
| 0,02 | 3,84 | 2,8857 | -0,5582 | |
| 0,00 | 0,71 | 0,5312 | -0,5469 | |
| 0,00 | 0,60 | 0,4470 | -0,3581 | |
| 0,02 | 2,57 | 1,9317 | -0,3238 | |
| 0,01 | 1,49 | 1,1199 | -0,2713 | |
| 0,00 | 0,97 | 0,7283 | -0,2545 | |
| 0,01 | 0,56 | 0,4172 | -0,2436 | |
| 0,00 | 0,63 | 0,4701 | -0,2193 |
Déclarations 13F et dépôts de fonds
Ce formulaire a été déposé le 2025-07-23 pour la période de déclaration 2025-06-30. Cliquez sur l'icône du lien pour voir l'historique complet des transactions.
Mettre à niveau pour débloquer les données premium et exporter vers Excel ![]() .
.
| Titre | Type | Prix moyen de l'action | Actions (en millions) |
ΔActions (%) |
ΔActions (%) |
Valeur ($ en millions) |
Portefeuille (%) |
ΔPortefeuille (%) |
|
|---|---|---|---|---|---|---|---|---|---|
| SPY / SPDR S&P 500 ETF | 0,02 | -0,95 | 11,41 | 9,40 | 8,5656 | -0,0478 | |||
| NFLX / Netflix, Inc. | 0,00 | 0,87 | 5,74 | 44,83 | 4,3120 | 1,0372 | |||
| DIA / SPDR Dow Jones Industrial Average ETF Trust | 0,01 | -0,27 | 4,77 | 4,67 | 3,5831 | -0,1827 | |||
| AVGO / Broadcom Inc. | 0,02 | 0,19 | 4,38 | 64,98 | 3,2856 | 1,0943 | |||
| WMT / Walmart Inc. | 0,04 | -0,41 | 4,29 | 10,92 | 3,2188 | 0,0266 | |||
| MSFT / Microsoft Corporation | 0,01 | -1,73 | 4,04 | 30,19 | 3,0338 | 0,4706 | |||
| AAPL / Apple Inc. | 0,02 | -0,20 | 3,84 | -7,82 | 2,8857 | -0,5582 | |||
| NVDA / NVIDIA Corporation | 0,02 | 23,62 | 3,54 | 80,20 | 2,6581 | 1,0354 | |||
| NVR / NVR, Inc. | 0,00 | 0,00 | 3,32 | 1,97 | 2,4891 | -0,1967 | |||
| JPM / JPMorgan Chase & Co. | 0,01 | 0,71 | 3,21 | 19,06 | 2,4102 | 0,1825 | |||
| AXP / American Express Company | 0,01 | -1,00 | 2,80 | 17,38 | 2,1041 | 0,1320 | |||
| ORCL / Oracle Corporation | 0,01 | 1,56 | 2,73 | 58,85 | 2,0487 | 0,6296 | |||
| GSCE / GS Connect S&P GSCI Enhanced Commodity Total Return ETN | 0,00 | -0,19 | 2,65 | 29,34 | 1,9926 | 0,2975 | |||
| XOM / Exxon Mobil Corporation | 0,02 | 3,94 | 2,57 | -5,79 | 1,9317 | -0,3238 | |||
| QQQ / Invesco QQQ Trust, Series 1 | 0,00 | 0,07 | 2,31 | 17,72 | 1,7306 | 0,1133 | |||
| NOW / ServiceNow, Inc. | 0,00 | 0,98 | 2,23 | 30,37 | 1,6760 | 0,2620 | |||
| V / Visa Inc. | 0,01 | 1,56 | 2,11 | 2,88 | 1,5818 | -0,1098 | |||
| IBM / International Business Machines Corporation | 0,01 | 0,10 | 2,08 | 18,64 | 1,5623 | 0,1138 | |||
| CAT / Caterpillar Inc. | 0,01 | -1,37 | 1,95 | 16,12 | 1,4657 | 0,0768 | |||
| META / Meta Platforms, Inc. | 0,00 | -2,27 | 1,90 | 25,20 | 1,4286 | 0,1727 | |||
| TRV / The Travelers Companies, Inc. | 0,01 | 1,87 | 1,79 | 3,05 | 1,3452 | -0,0907 | |||
| LLY / Eli Lilly and Company | 0,00 | 11,21 | 1,74 | 4,95 | 1,3060 | -0,0627 | |||
| MMM / 3M Company | 0,01 | 17,02 | 1,70 | 21,30 | 1,2741 | 0,1187 | |||
| SAP / SAP SE - Depositary Receipt (Common Stock) | 0,01 | -0,81 | 1,64 | 12,39 | 1,2326 | 0,0259 | |||
| COST / Costco Wholesale Corporation | 0,00 | 1,14 | 1,58 | 5,82 | 1,1881 | -0,0466 | |||
| KO / The Coca-Cola Company | 0,02 | 0,41 | 1,55 | -0,77 | 1,1642 | -0,1270 | |||
| TMUS / T-Mobile US, Inc. | 0,01 | -0,87 | 1,49 | -11,46 | 1,1199 | -0,2713 | |||
| HON / Honeywell International Inc. | 0,01 | -6,65 | 1,47 | 2,66 | 1,1000 | -0,0787 | |||
| RTX / RTX Corporation | 0,01 | 1,36 | 1,46 | 11,72 | 1,0946 | 0,0169 | |||
| GJR / Strats Trust For Procter & Gambel Security - Preferred Security | 0,01 | -0,58 | 1,40 | -7,04 | 1,0510 | -0,1929 | |||
| CSCO / Cisco Systems, Inc. | 0,02 | 6,49 | 1,31 | 19,74 | 0,9839 | 0,0798 | |||
| MA / Mastercard Incorporated | 0,00 | -0,91 | 1,28 | 1,58 | 0,9642 | -0,0800 | |||
| PGR / The Progressive Corporation | 0,00 | 0,00 | 1,27 | -5,71 | 0,9542 | -0,1590 | |||
| HD / The Home Depot, Inc. | 0,00 | 5,38 | 1,26 | 5,37 | 0,9434 | -0,0410 | |||
| ETN / Eaton Corporation plc | 0,00 | 0,00 | 1,26 | 31,38 | 0,9429 | 0,1531 | |||
| NKE / NIKE, Inc. | 0,02 | 1,22 | 0,9180 | 0,9180 | |||||
| COF / Capital One Financial Corporation | 0,01 | 7,45 | 1,21 | 27,52 | 0,9119 | 0,1251 | |||
| LOW / Lowe's Companies, Inc. | 0,01 | -3,77 | 1,20 | -8,49 | 0,8981 | -0,1811 | |||
| SHW / The Sherwin-Williams Company | 0,00 | 17,05 | 1,04 | 15,10 | 0,7840 | 0,0346 | |||
| MCD / McDonald's Corporation | 0,00 | -0,51 | 1,02 | -7,00 | 0,7684 | -0,1400 | |||
| T / AT&T Inc. | 0,04 | 0,25 | 1,01 | 2,63 | 0,7616 | -0,0550 | |||
| GILD / Gilead Sciences, Inc. | 0,01 | -0,42 | 1,01 | -1,47 | 0,7559 | -0,0881 | |||
| EPD / Enterprise Products Partners L.P. - Limited Partnership | 0,03 | 0,00 | 1,00 | -9,24 | 0,7527 | -0,1589 | |||
| GD / General Dynamics Corporation | 0,00 | 0,41 | 1,00 | 7,43 | 0,7498 | -0,0179 | |||
| AMGN / Amgen Inc. | 0,00 | -9,03 | 0,97 | -18,49 | 0,7283 | -0,2545 | |||
| INTU / Intuit Inc. | 0,00 | 1,26 | 0,95 | 29,88 | 0,7147 | 0,1094 | |||
| TDG / TransDigm Group Incorporated | 0,00 | 0,00 | 0,84 | 9,95 | 0,6312 | -0,0005 | |||
| BLK / BlackRock, Inc. | 0,00 | -1,24 | 0,83 | 9,59 | 0,6261 | -0,0030 | |||
| ELV / Elevance Health, Inc. | 0,00 | 34,50 | 0,79 | 20,27 | 0,5930 | 0,0506 | |||
| EBAY / eBay Inc. | 0,01 | 49,22 | 0,79 | 64,17 | 0,5917 | 0,1949 | |||
| MS / Morgan Stanley | 0,01 | 1,74 | 0,75 | 22,95 | 0,5632 | 0,0588 | |||
| ABBV / AbbVie Inc. | 0,00 | 16,53 | 0,74 | 3,23 | 0,5530 | -0,0363 | |||
| CMG / Chipotle Mexican Grill, Inc. | 0,01 | 0,01 | 0,72 | 11,78 | 0,5415 | 0,0089 | |||
| TXN / Texas Instruments Incorporated | 0,00 | -53,08 | 0,71 | -45,82 | 0,5312 | -0,5469 | |||
| BAC / Bank of America Corporation | 0,01 | -2,35 | 0,66 | 10,67 | 0,4988 | 0,0033 | |||
| CVX / Chevron Corporation | 0,00 | -12,36 | 0,63 | -24,94 | 0,4701 | -0,2193 | |||
| MRK / Merck & Co., Inc. | 0,01 | -8,14 | 0,62 | -18,96 | 0,4686 | -0,1678 | |||
| DE / Deere & Company | 0,00 | 12,23 | 0,60 | 21,59 | 0,4484 | 0,0427 | |||
| AMZN / Amazon.com, Inc. | 0,00 | -47,02 | 0,60 | -38,97 | 0,4470 | -0,3581 | |||
| MET / MetLife, Inc. | 0,01 | 0,00 | 0,59 | 0,17 | 0,4426 | -0,0435 | |||
| AMD / Advanced Micro Devices, Inc. | 0,00 | 0,56 | 0,4223 | 0,4223 | |||||
| UNH / UnitedHealth Group Incorporated | 0,00 | -38,69 | 0,56 | -63,52 | 0,4208 | -0,8468 | |||
| YUM / Yum! Brands, Inc. | 0,00 | 2,65 | 0,56 | -3,30 | 0,4184 | -0,0578 | |||
| DD / DuPont de Nemours, Inc. | 0,01 | -24,38 | 0,56 | -30,62 | 0,4172 | -0,2436 | |||
| LIN / Linde plc | 0,00 | -0,85 | 0,55 | 0,00 | 0,4124 | -0,0417 | |||
| CMI / Cummins Inc. | 0,00 | 0,00 | 0,53 | 4,50 | 0,4012 | -0,0212 | |||
| C / Citigroup Inc. | 0,01 | 3,12 | 0,53 | 23,72 | 0,3994 | 0,0440 | |||
| SLB / Schlumberger Limited | 0,02 | 0,00 | 0,53 | -19,20 | 0,3955 | -0,1425 | |||
| LMT / Lockheed Martin Corporation | 0,00 | 0,83 | 0,51 | 4,54 | 0,3810 | -0,0199 | |||
| ITW / Illinois Tool Works Inc. | 0,00 | -12,61 | 0,51 | -12,89 | 0,3808 | -0,1000 | |||
| CL / Colgate-Palmolive Company | 0,01 | 0,82 | 0,50 | -2,33 | 0,3790 | -0,0473 | |||
| NOC / Northrop Grumman Corporation | 0,00 | 5,43 | 0,49 | 2,92 | 0,3715 | -0,0254 | |||
| CI / The Cigna Group | 0,00 | 99,47 | 0,49 | 100,81 | 0,3712 | 0,1675 | |||
| VZ / Verizon Communications Inc. | 0,01 | 4,86 | 0,48 | 0,21 | 0,3595 | -0,0359 | |||
| SBUX / Starbucks Corporation | 0,01 | -2,41 | 0,48 | -9,00 | 0,3573 | -0,0738 | |||
| CRM / Salesforce, Inc. | 0,00 | -5,79 | 0,47 | -4,28 | 0,3533 | -0,0527 | |||
| JNJ / Johnson & Johnson | 0,00 | -25,13 | 0,47 | -31,07 | 0,3501 | -0,2083 | |||
| MU / Micron Technology, Inc. | 0,00 | 0,00 | 0,46 | 41,90 | 0,3487 | 0,0783 | |||
| QCOM / QUALCOMM Incorporated | 0,00 | -19,32 | 0,45 | -16,45 | 0,3359 | -0,1059 | |||
| PH / Parker-Hannifin Corporation | 0,00 | 0,00 | 0,41 | 15,08 | 0,3093 | 0,0132 | |||
| CB / Chubb Limited | 0,00 | -2,83 | 0,39 | -6,73 | 0,2914 | -0,0525 | |||
| DELL / Dell Technologies Inc. | 0,00 | 0,06 | 0,38 | 34,63 | 0,2865 | 0,0523 | |||
| TGT / Target Corporation | 0,00 | 0,37 | 0,2780 | 0,2780 | |||||
| PNC / The PNC Financial Services Group, Inc. | 0,00 | 0,05 | 0,36 | 6,18 | 0,2712 | -0,0099 | |||
| ACN / Accenture plc | 0,00 | -2,06 | 0,36 | -6,08 | 0,2665 | -0,0461 | |||
| SCHX / Schwab Strategic Trust - Schwab U.S. Large-Cap ETF | 0,01 | 1,19 | 0,34 | 12,13 | 0,2572 | 0,0046 | |||
| GOOGL / Alphabet Inc. | 0,00 | -5,06 | 0,33 | 8,20 | 0,2481 | -0,0042 | |||
| DHR / Danaher Corporation | 0,00 | -11,61 | 0,33 | -14,84 | 0,2460 | -0,0717 | |||
| GOOG / Alphabet Inc. | 0,00 | 10,23 | 0,32 | 25,10 | 0,2395 | 0,0289 | |||
| ADBE / Adobe Inc. | 0,00 | 3,32 | 0,30 | 4,15 | 0,2262 | -0,0126 | |||
| DBEF / DBX ETF Trust - Xtrackers MSCI EAFE Hedged Equity ETF | 0,01 | 3,23 | 0,30 | 4,17 | 0,2258 | -0,0123 | |||
| SPYX / SPDR Series Trust - SPDR S&P 500 Fossil Fuel Reserves Free ETF | 0,01 | 0,26 | 0,30 | 11,94 | 0,2252 | 0,0032 | |||
| DFUS / Dimensional ETF Trust - Dimensional U.S. Equity Market ETF | 0,00 | 0,09 | 0,29 | 11,07 | 0,2186 | 0,0018 | |||
| SU / Suncor Energy Inc. | 0,01 | 0,00 | 0,27 | -3,19 | 0,2054 | -0,0282 | |||
| ABT / Abbott Laboratories | 0,00 | 10,76 | 0,26 | 13,54 | 0,1954 | 0,0061 | |||
| KDP / Keurig Dr Pepper Inc. | 0,01 | 3,31 | 0,26 | -0,39 | 0,1935 | -0,0198 | |||
| US780153BQ43 / CONV. NOTE | 0,00 | 0,24 | 0,1836 | 0,1836 | |||||
| IWM / iShares Trust - iShares Russell 2000 ETF | 0,00 | 0,18 | 0,24 | 8,72 | 0,1780 | -0,0027 | |||
| USB / U.S. Bancorp | 0,01 | 5,03 | 0,23 | 12,38 | 0,1709 | 0,0039 | |||
| EMN / Eastman Chemical Company | 0,00 | -3,75 | 0,22 | -18,61 | 0,1681 | -0,0586 | |||
| IWD / iShares Trust - iShares Russell 1000 Value ETF | 0,00 | 0,00 | 0,22 | 3,29 | 0,1653 | -0,0109 | |||
| AVY / Avery Dennison Corporation | 0,00 | 0,00 | 0,22 | -1,35 | 0,1649 | -0,0191 | |||
| PFE / Pfizer Inc. | 0,01 | -5,98 | 0,21 | -10,08 | 0,1611 | -0,0359 | |||
| PEP / PepsiCo, Inc. | 0,00 | -32,73 | 0,21 | -40,78 | 0,1593 | -0,1365 | |||
| DON / WisdomTree Trust - WisdomTree U.S. MidCap Dividend Fund | 0,00 | 0,66 | 0,21 | 1,98 | 0,1549 | -0,0123 | |||
| DIS / The Walt Disney Company | 0,00 | -20,66 | 0,21 | 0,00 | 0,1548 | -0,0160 | |||
| QEPC / Q.E.P. Co., Inc. | 0,01 | -83,42 | 0,14 | -87,50 | 0,1018 | -0,7902 | |||
| TMO / Thermo Fisher Scientific Inc. | 0,00 | -100,00 | 0,00 | 0,0000 | |||||
| APD / Air Products and Chemicals, Inc. | 0,00 | -100,00 | 0,00 | 0,0000 |