Statistiques de base
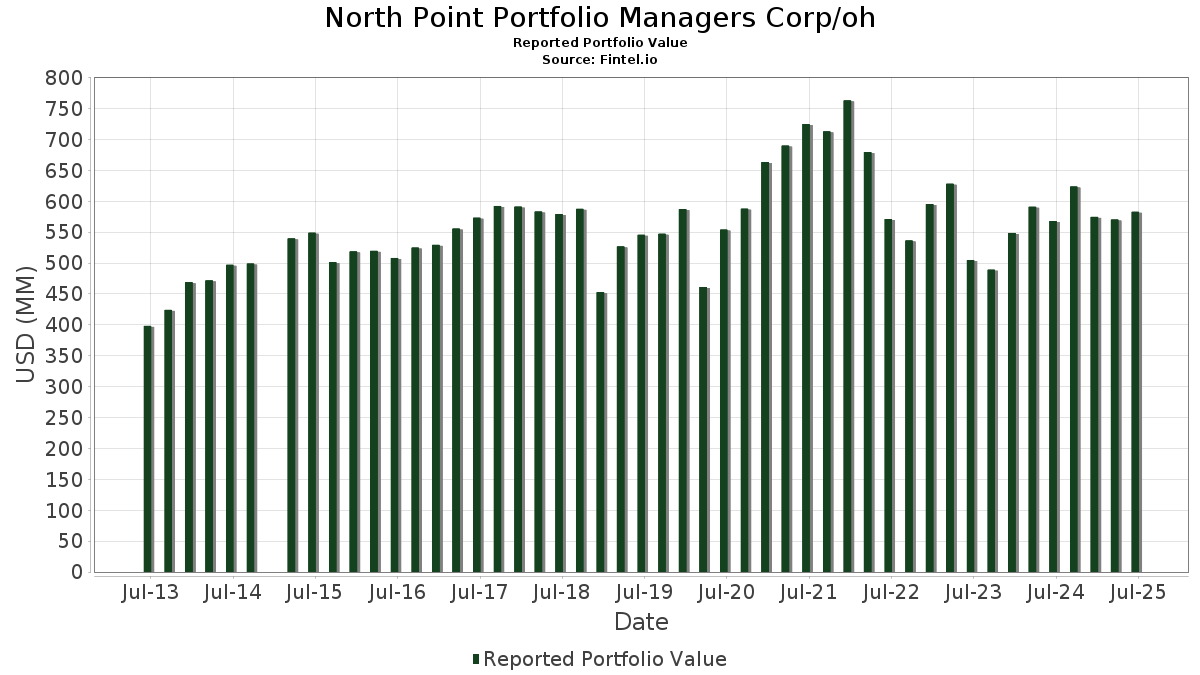
| Valeur du portefeuille | $ 582 922 391 |
| Positions actuelles | 72 |
Dernières positions, performances, ASG (à partir des dépôts 13F, 13D)
North Point Portfolio Managers Corp/oh a déclaré un total de 72 positions dans ses derniers dépôts auprès de la SEC. La valeur la plus récente du portefeuille est calculée à 582 922 391 USD. Les actifs sous gestion réels (ASG) sont cette valeur plus les liquidités (qui ne sont pas divulguées). Les principales positions de North Point Portfolio Managers Corp/oh sont Amphenol Corporation (US:APH) , Costco Wholesale Corporation (US:COST) , Visa Inc. (US:V) , Amazon.com, Inc. (US:AMZN) , and Arthur J. Gallagher & Co. (US:AJG) . Les nouvelles positions de North Point Portfolio Managers Corp/oh incluent Arista Networks Inc (US:ANET) , .
Meilleures augmentations ce trimestre
Nous utilisons la variation de l'allocation du portefeuille car il s'agit de l'indicateur le plus significatif. Les changements peuvent être dus à des transactions ou à des variations de prix des actions.
| Titre | Actions (en millions) |
Valeur ($ en millions) |
% du portefeuille | ΔPortefeuille % |
|---|---|---|---|---|
| 0,11 | 11,46 | 1,9651 | 1,9651 | |
| 0,02 | 12,46 | 2,1375 | 1,2597 | |
| 0,32 | 31,28 | 5,3662 | 0,9102 | |
| 0,02 | 16,08 | 2,7582 | 0,7819 | |
| 0,03 | 19,95 | 3,4221 | 0,6845 | |
| 0,03 | 17,30 | 2,9679 | 0,6315 | |
| 0,16 | 15,39 | 2,6407 | 0,5014 | |
| 0,02 | 18,28 | 3,1364 | 0,4369 | |
| 0,10 | 22,66 | 3,8878 | 0,4027 | |
| 0,06 | 12,85 | 2,2036 | 0,3357 |
Principales baisses ce trimestre
Nous utilisons la variation de l'allocation du portefeuille car il s'agit de l'indicateur le plus significatif. Les changements peuvent être dus à des transactions ou à des variations de prix des actions.
| Titre | Actions (en millions) |
Valeur ($ en millions) |
% du portefeuille | ΔPortefeuille % |
|---|---|---|---|---|
| 0,12 | 21,33 | 3,6583 | -1,1867 | |
| 0,02 | 7,59 | 1,3017 | -0,9742 | |
| 0,01 | 12,79 | 2,1941 | -0,6702 | |
| 0,07 | 21,73 | 3,7275 | -0,4509 | |
| 0,02 | 8,86 | 1,5200 | -0,3967 | |
| 0,13 | 12,07 | 2,0713 | -0,3910 | |
| 0,07 | 9,22 | 1,5810 | -0,2851 | |
| 0,06 | 17,57 | 3,0138 | -0,2477 | |
| 0,02 | 13,52 | 2,3201 | -0,1936 | |
| 0,10 | 11,27 | 1,9334 | -0,1719 |
Déclarations 13F et dépôts de fonds
Ce formulaire a été déposé le 2025-07-30 pour la période de déclaration 2025-06-30. Cliquez sur l'icône du lien pour voir l'historique complet des transactions.
Mettre à niveau pour débloquer les données premium et exporter vers Excel ![]() .
.
| Titre | Type | Prix moyen de l'action | Actions (en millions) |
ΔActions (%) |
ΔActions (%) |
Valeur ($ en millions) |
Portefeuille (%) |
ΔPortefeuille (%) |
|
|---|---|---|---|---|---|---|---|---|---|
| APH / Amphenol Corporation | 0,32 | -18,24 | 31,28 | 23,10 | 5,3662 | 0,9102 | |||
| COST / Costco Wholesale Corporation | 0,03 | -1,37 | 26,14 | 3,23 | 4,4839 | 0,0440 | |||
| V / Visa Inc. | 0,07 | -1,80 | 26,03 | -0,52 | 4,4651 | -0,1226 | |||
| AMZN / Amazon.com, Inc. | 0,10 | -1,11 | 22,66 | 14,02 | 3,8878 | 0,4027 | |||
| AJG / Arthur J. Gallagher & Co. | 0,07 | -1,66 | 21,73 | -8,81 | 3,7275 | -0,4509 | |||
| XPRO / Expro Group Holdings N.V. | 0,12 | -1,14 | 21,33 | -22,82 | 3,6583 | -1,1867 | |||
| GS / The Goldman Sachs Group, Inc. | 0,03 | -1,38 | 19,95 | 27,78 | 3,4221 | 0,6845 | |||
| BLK / BlackRock, Inc. | 0,02 | -1,36 | 18,97 | 9,35 | 3,2548 | 0,2124 | |||
| HD / The Home Depot, Inc. | 0,05 | -1,30 | 18,35 | -1,26 | 3,1487 | -0,1109 | |||
| ANSS / ANSYS, Inc. | 0,05 | -2,46 | 18,29 | 8,21 | 3,1377 | 0,1739 | |||
| URI / United Rentals, Inc. | 0,02 | -1,21 | 18,28 | 18,76 | 3,1364 | 0,4369 | |||
| ACN / Accenture plc | 0,06 | -1,39 | 17,57 | -5,54 | 3,0138 | -0,2477 | |||
| MSFT / Microsoft Corporation | 0,03 | -2,01 | 17,30 | 29,85 | 2,9679 | 0,6315 | |||
| ASML / ASML Holding N.V. - Depositary Receipt (Common Stock) | 0,02 | 17,96 | 16,08 | 42,66 | 2,7582 | 0,7819 | |||
| UBER / Uber Technologies, Inc. | 0,16 | -1,47 | 15,39 | 26,18 | 2,6407 | 0,5014 | |||
| ROL / Rollins, Inc. | 0,27 | -1,39 | 15,19 | 2,97 | 2,6054 | 0,0190 | |||
| TTWO / Take-Two Interactive Software, Inc. | 0,06 | -1,02 | 14,74 | 15,98 | 2,5279 | 0,3000 | |||
| ROP / Roper Technologies, Inc. | 0,02 | -1,87 | 13,52 | -5,65 | 2,3201 | -0,1936 | |||
| DHR / Danaher Corporation | 0,07 | -1,07 | 13,33 | -4,67 | 2,2872 | -0,1653 | |||
| ABT / Abbott Laboratories | 0,10 | -1,67 | 13,12 | 0,81 | 2,2509 | -0,0312 | |||
| BA / The Boeing Company | 0,06 | -1,85 | 12,85 | 20,59 | 2,2036 | 0,3357 | |||
| TPL / Texas Pacific Land Corporation | 0,01 | -1,79 | 12,79 | -21,70 | 2,1941 | -0,6702 | |||
| MPC / Marathon Petroleum Corporation | 0,08 | -1,27 | 12,64 | 12,57 | 2,1685 | 0,1994 | |||
| SNPS / Synopsys, Inc. | 0,02 | 108,19 | 12,46 | 148,90 | 2,1375 | 1,2597 | |||
| DOV / Dover Corporation | 0,07 | -1,79 | 12,38 | 2,43 | 2,1231 | 0,0044 | |||
| CHD / Church & Dwight Co., Inc. | 0,13 | -1,51 | 12,07 | -14,02 | 2,0713 | -0,3910 | |||
| ROST / Ross Stores, Inc. | 0,09 | -1,77 | 11,84 | -1,93 | 2,0305 | -0,0858 | |||
| ANET / Arista Networks Inc | 0,11 | 11,46 | 1,9651 | 1,9651 | |||||
| RPM / RPM International Inc. | 0,10 | -1,14 | 11,27 | -6,13 | 1,9334 | -0,1719 | |||
| MTD / Mettler-Toledo International Inc. | 0,01 | -1,00 | 10,79 | -1,52 | 1,8508 | -0,0702 | |||
| ZBRA / Zebra Technologies Corporation | 0,03 | -1,58 | 9,43 | 7,40 | 1,6175 | 0,0782 | |||
| NXT / Nextracker Inc. | 0,17 | -0,64 | 9,22 | 28,20 | 1,5825 | 0,3207 | |||
| PEP / PepsiCo, Inc. | 0,07 | -1,66 | 9,22 | -13,40 | 1,5810 | -0,2851 | |||
| ADBE / Adobe Inc. | 0,02 | -2,35 | 9,02 | -1,50 | 1,5475 | -0,0583 | |||
| REGN / Regeneron Pharmaceuticals, Inc. | 0,02 | -2,07 | 8,86 | -18,94 | 1,5200 | -0,3967 | |||
| UNH / UnitedHealth Group Incorporated | 0,02 | -1,85 | 7,59 | -41,54 | 1,3017 | -0,9742 | |||
| GNTX / Gentex Corporation | 0,34 | -1,81 | 7,53 | -7,34 | 1,2926 | -0,1332 | |||
| FMC / FMC Corporation | 0,12 | -2,24 | 4,88 | -3,25 | 0,8373 | -0,0474 | |||
| QQQ / Invesco QQQ Trust, Series 1 | 0,00 | 0,00 | 1,43 | 17,66 | 0,2447 | 0,0321 | |||
| LLY / Eli Lilly and Company | 0,00 | 0,00 | 1,42 | -5,64 | 0,2442 | -0,0203 | |||
| AAPL / Apple Inc. | 0,01 | -2,20 | 1,28 | -9,65 | 0,2202 | -0,0290 | |||
| GJR / Strats Trust For Procter & Gambel Security - Preferred Security | 0,01 | -0,60 | 0,93 | -7,10 | 0,1595 | -0,0159 | |||
| JPM / JPMorgan Chase & Co. | 0,00 | 0,00 | 0,89 | 18,22 | 0,1526 | 0,0206 | |||
| XOM / Exxon Mobil Corporation | 0,01 | 0,00 | 0,79 | -9,35 | 0,1348 | -0,0172 | |||
| SPY / SPDR S&P 500 ETF | 0,00 | -1,51 | 0,77 | 8,79 | 0,1317 | 0,0080 | |||
| US9229087104 / VANGUARD 500 INDEX FUND VANGUARD 500 INDEX ADM | 0,00 | 0,00 | 0,75 | 10,60 | 0,1289 | 0,0098 | |||
| MCD / McDonald's Corporation | 0,00 | 0,00 | 0,74 | -6,55 | 0,1275 | -0,0118 | |||
| VOO / Vanguard Index Funds - Vanguard S&P 500 ETF | 0,00 | 3,44 | 0,68 | 14,41 | 0,1172 | 0,0124 | |||
| FXAIX / Fidelity Concord Street Trust - Fidelity 500 Index Fund | 0,00 | 0,00 | 0,64 | 10,63 | 0,1090 | 0,0082 | |||
| ABBV / AbbVie Inc. | 0,00 | 0,00 | 0,46 | -11,39 | 0,0787 | -0,0121 | |||
| VTI / Vanguard Index Funds - Vanguard Total Stock Market ETF | 0,00 | 0,00 | 0,44 | 10,63 | 0,0750 | 0,0057 | |||
| FMAGX / Fidelity Magellan Fund - Fidelity Magellan | 0,03 | 0,00 | 0,43 | 12,27 | 0,0738 | 0,0066 | |||
| VANGUARD GROWTH & INCOME-ADM / MUT (921913208) | 0,00 | 0,42 | 0,0000 | ||||||
| GOOGL / Alphabet Inc. | 0,00 | 0,00 | 0,40 | 13,96 | 0,0686 | 0,0071 | |||
| BNL / Broadstone Net Lease, Inc. | 0,02 | 0,00 | 0,39 | -5,83 | 0,0667 | -0,0057 | |||
| IBM / International Business Machines Corporation | 0,00 | 0,00 | 0,39 | 18,35 | 0,0665 | 0,0092 | |||
| MRK / Merck & Co., Inc. | 0,00 | 0,00 | 0,34 | -11,83 | 0,0590 | -0,0094 | |||
| CVX / Chevron Corporation | 0,00 | 0,00 | 0,34 | -14,32 | 0,0576 | -0,0112 | |||
| GGG / Graco Inc. | 0,00 | -15,19 | 0,30 | -12,54 | 0,0515 | -0,0088 | |||
| PPG / PPG Industries, Inc. | 0,00 | 0,00 | 0,30 | 3,87 | 0,0507 | 0,0009 | |||
| HON / Honeywell International Inc. | 0,00 | 0,00 | 0,28 | 9,88 | 0,0478 | 0,0034 | |||
| VWNEX / Vanguard Windsor Funds - Vanguard Windsor Admiral Class | 0,00 | 0,00 | 0,28 | 2,21 | 0,0477 | 0,0001 | |||
| JNJ / Johnson & Johnson | 0,00 | 0,00 | 0,26 | -8,16 | 0,0446 | -0,0049 | |||
| OAKMX / Harris Associates Investment Trust - Oakmark Fund Investor Class | 0,00 | 0,00 | 0,25 | 4,13 | 0,0434 | 0,0009 | |||
| PNC / The PNC Financial Services Group, Inc. | 0,00 | 0,00 | 0,25 | 6,47 | 0,0424 | 0,0015 | |||
| EMR / Emerson Electric Co. | 0,00 | 0,24 | 0,0407 | 0,0407 | |||||
| VTSAX / Vanguard Index Funds - Vanguard Total Stock Market Index Fund Admiral | 0,00 | 0,00 | 0,23 | 10,48 | 0,0399 | 0,0030 | |||
| IWF / iShares Trust - iShares Russell 1000 Growth ETF | 0,00 | 0,22 | 0,0378 | 0,0378 | |||||
| US0549371070 / BB&T Corp. | 0,00 | 0,22 | 0,0375 | 0,0375 | |||||
| FIDELITY DISCIPLINED EQUITY FU / MUT (316066208) | 0,00 | 0,22 | 0,0000 | ||||||
| GOOG / Alphabet Inc. | 0,00 | 0,21 | 0,0365 | 0,0365 | |||||
| BP / BP p.l.c. - Depositary Receipt (Common Stock) | 0,01 | 0,00 | 0,21 | -11,49 | 0,0357 | -0,0055 | |||
| UFPI / UFP Industries, Inc. | 0,00 | -100,00 | 0,00 | 0,0000 | |||||
| RPG / Invesco Exchange-Traded Fund Trust - Invesco S&P 500 Pure Growth ETF | 0,00 | -100,00 | 0,00 | 0,0000 | |||||
| ASGN / ASGN Incorporated | 0,00 | -100,00 | 0,00 | 0,0000 | |||||
| BRK.A / Berkshire Hathaway Inc. | 0,00 | -100,00 | 0,00 | 0,0000 | |||||
| NVDA / NVIDIA Corporation | 0,00 | -100,00 | 0,00 | 0,0000 |